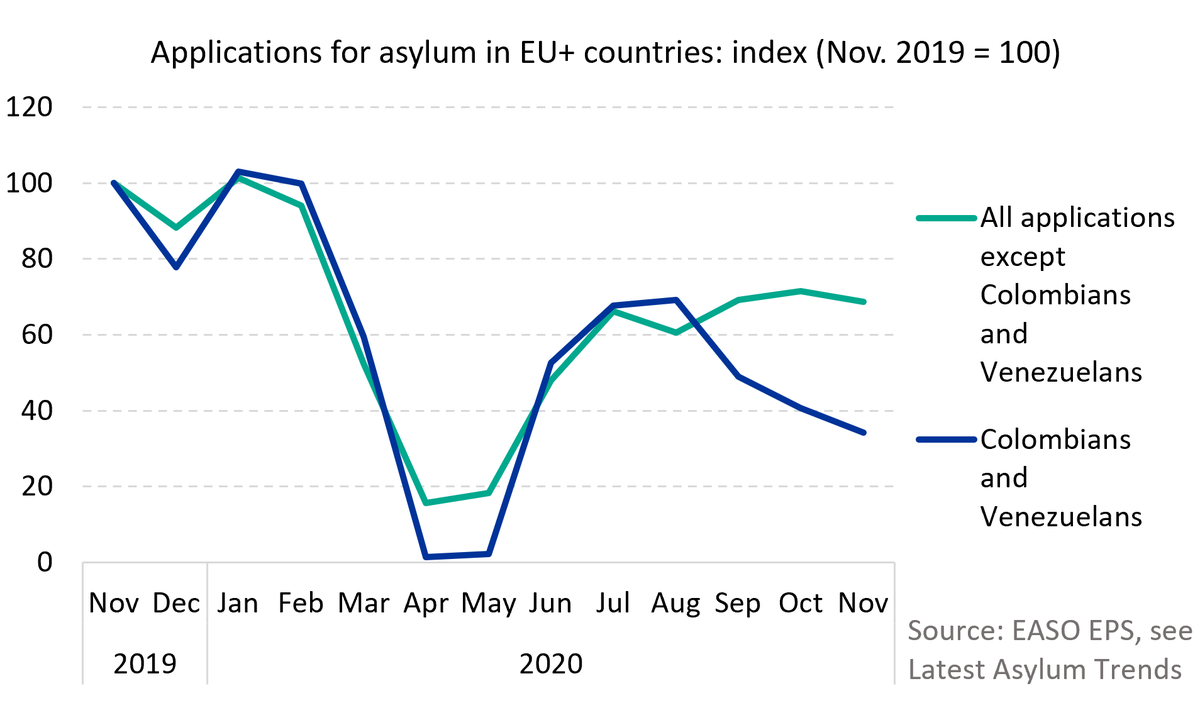
This indicates how strongly #asylum applications in EU+ countries were affected by restrictions on movement in 2020, incl. border closures
https://t.co/juezBngqrr
#MigrationEU#migration#refugees#EUAA
I got inspiration from a recent @f_l_o_u_r_i_s_h blog post and made this step-by-step animated line chart.
Based on an animation by @jburnmurdoch:
https://t.co/0Ij7zvu548
❓Did you know that #EU#asylum decisions exceed applications for first time since 2017 due to #COVID19?
ℹ️ Find out more about the 2020 asylum trends here: https://t.co/JJbU88vHuK
The EASO COI team published its first #podcast aimed at supporting asylum practitioners' understanding of the situation in countries of origin. This first podcast is on #Libya and can be streamed via this link: https://t.co/soJWEBtEcX
📊About 521 000 decisions were issued at first instance in 2020, which exceeded the number of applications for the first time since 2017.
As a result, the backlog of cases was reduced somewhat, falling by more than 74 000 cases at first instance.
More➡️ https://t.co/JJbU88vHuK
In 2020, #asylum applications substantially decreased for most citizenships. In contrast with this general trend, the number rose for applicants from #Belarus, #Brazil, #Comoros, and #Cuba.
📊The top countries of origin remained unchanged from 2019, although applications decreased for almost all citizenships.
Syrians lodged the most applications, accounting for 14% of all applications in the EU+. More: https://t.co/JJbU88vHuK & https://t.co/xlEiKhu3Bd.
#Asylum applications from Venezuelans and Colombians have fallen especially strongly during COVID-19. Not needing a visa to come to Europe, these applicants likely rely on normal travel links – which are now heavily restricted https://t.co/FqPzXneuV2 #Refugees#migration
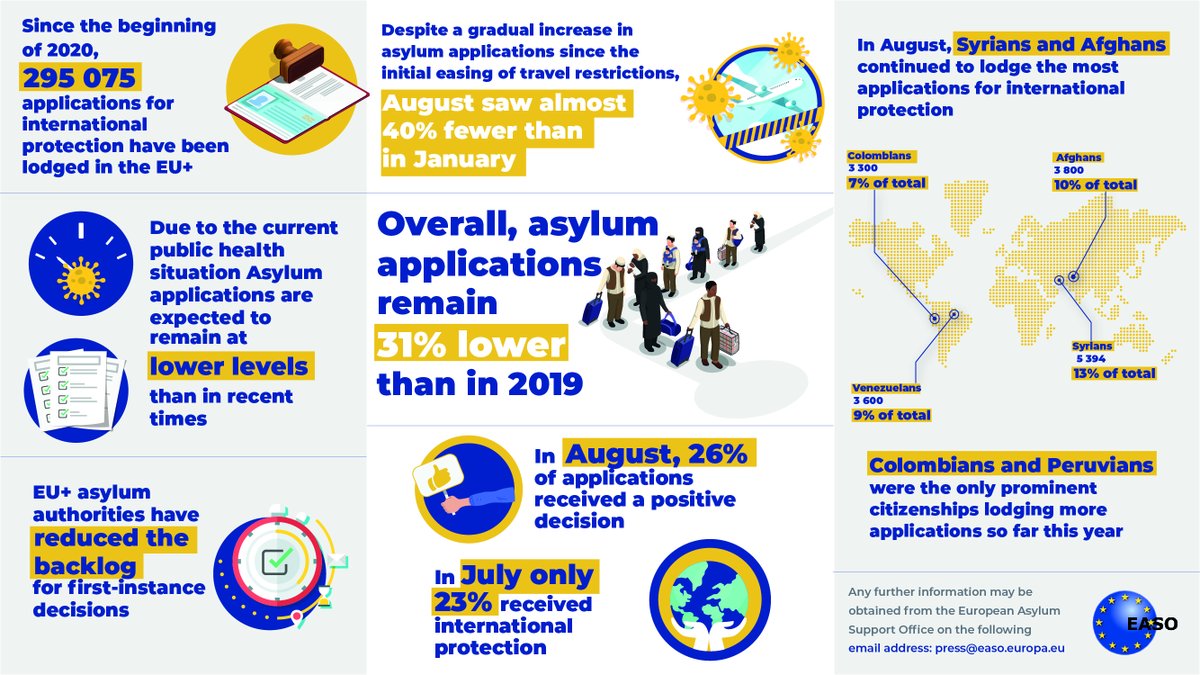
📊Analysis released by #EASO on #asylum trends in 2020 shows that EU asylum decisions exceed applications for first time since 2017 due to #COVID19. Applications decreased by 31% compared to 2019, down to the lowest levels since 2013!
📰PR: https://t.co/tEq4uOqa1n
📢 Check it out!
New study co-authored by @teddy_wilkin & @MCarammia - members of @QuantMig Advisory Board - indicates that adaptive machine learning algorithms in official statistics and non-traditional data sources can effectively forecast asylum-related migration flows.
#COVID19 Partial lockdowns, travel bans, and other preventative health measures continue to reduce the mobility of #asylumseekers in general and the extent to which they are able to reach the EU+ and lodge #asylum applications. Click for @easo #dataviz https://t.co/rhjmWVcQAw
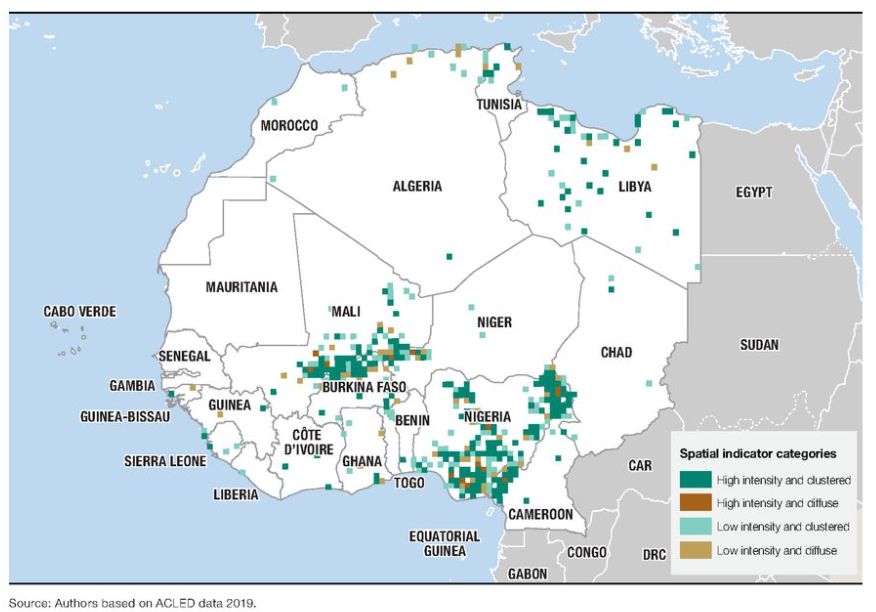
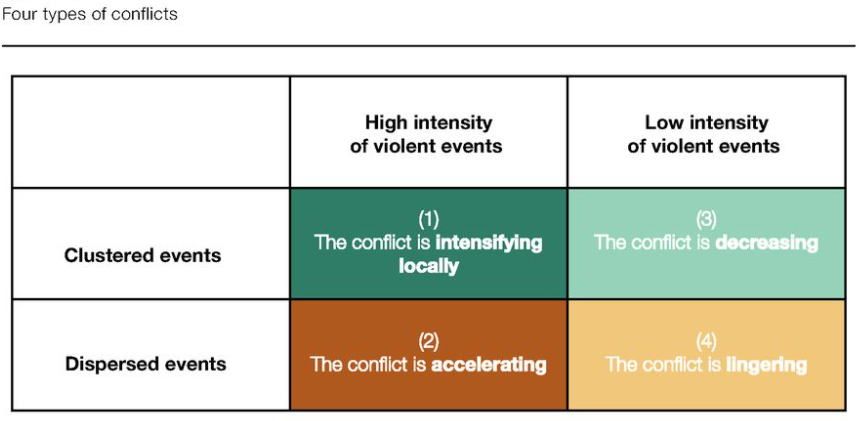
In North and West Africa #conflict events are more likely to occur near one another. In the #Sahel however violence is spilling across borders to previously unaffected regions.
Interesting spatial analysis of @ACLEDINFO data with #ArcGIS by @SWAC_OECD: https://t.co/aRylwcCOob.
Airwars used geolocation data disclosed by the US military to reveal the precise locations of events that caused harm to civilians in the fight against ISIS. Good to see #data used to bring greater transparency in the context of #conflict.
New: Following several years of patient engagement with the US-led Coalition @CJTFOIR in Iraq and Syria, Airwars has obtained the close locations of 99% of all officially confirmed or 'Credible' civilian harm events. It's a major transparency breakthrough. https://t.co/p2KDeb5M4R
Civilians suffered intensely under ISIS’s so-called caliphate, as militants conducted mass killings, enslaved women and children, and used gruesome violence. The U.S. unleashed massive firepower that decimated ISIS. It also killed thousands of civilians.
https://t.co/kU1xXwlRqO
[NEW] I spent a big part of the past months working on the new @worldbank Sutainable Development Goals Atlas. It just went live: 17 articles on the current state of the world, packed with charts, maps and interactives! https://t.co/oOdNHUehGU #SDGAtlas 1/n
Amazing trove of data visualizations from the 2020 Atlas of the Sustainable Goals by @worldbankdata and @maartenzam. #Scrollytelling at its best, one example: this shifted marimekko chart to show distribution of learning poverty between regions
https://t.co/5fG8PF9w4A #SDGAtlas
Despite a gradual increase in #asylum applications August saw over 40 000 registered, almost 4️⃣0️⃣% fewer than in January.
👀 This infographic introduces the key findings of the latest #asylum trends.
ℹ️ Interactive viz👉https://t.co/0cI7bPG0Es
@EUHomeAffairs#EASO





![maartenzam's tweet photo. [NEW] I spent a big part of the past months working on the new @worldbank Sutainable Development Goals Atlas. It just went live: 17 articles on the current state of the world, packed with charts, maps and interactives! https://t.co/oOdNHUehGU #SDGAtlas 1/n https://t.co/GgA0nmYiAQ](https://pbs.twimg.com/media/Em9EHrPWEAAAX21.jpg)