Foresight Analytics is a leading provider of evidenced based investment consulting, data analytics, research and diligence solutions to global investors.
Overview of the US Treasuries Market
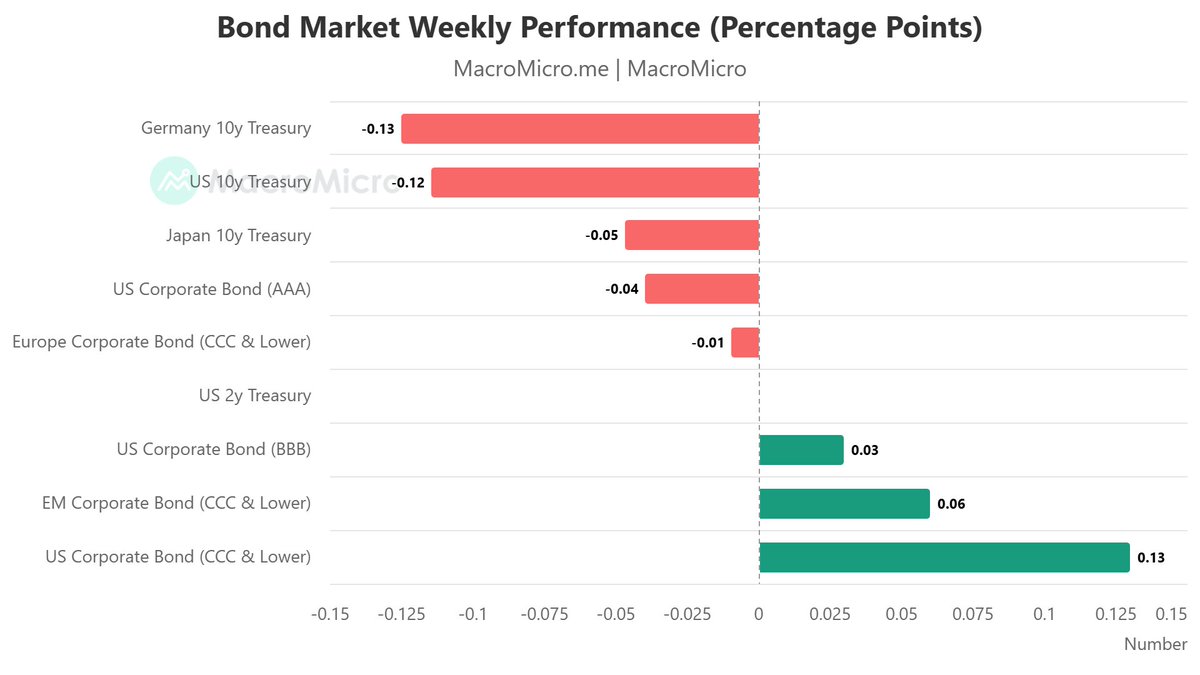
Treasury Yields Ease as Falling Oil Prices Calm Inflation Fears
US Treasury markets rallied for a third consecutive week as easing geopolitical tensions in the Middle East and a sharp decline in oil prices reduced immediate inflation concerns and reinforced expectations that the Federal Reserve is likely to remain on hold in the near term. The benchmark 10-year Treasury yield fell 8 basis points over the week to 4.37%, while the policy-sensitive two-year yield declined 9 basis points to 4.09%, reflecting a moderation in expectations for additional rate hikes.
The primary catalyst was the almost 10% fall in crude oil prices as prospects for a lasting US-Iran peace agreement improved. Lower energy prices eased concerns that the recent conflict would generate another sustained inflation shock, allowing bond investors to reassess the outlook for monetary policy. Markets also took comfort from May core PCE inflation, which broadly matched expectations despite remaining well above the Federal Reserve’s 2% target.
Economic data painted a mixed picture. Consumer sentiment improved modestly, while investors are looking ahead to softer payroll growth and consumer confidence data to gauge whether economic momentum is beginning to slow. Futures markets continue to price a meaningful probability of one further Fed rate increase this year, although expectations for a second hike have diminished as inflation forecasts have moderated.Across Europe, government bond markets also strengthened. German Bund yields fell to multi-month lows as investors reduced expectations of further European Central Bank tightening following the decline in energy prices. However, strategists caution that the rally may have run ahead of fundamentals, with many expecting Bund yields to stabilise ahead of the ECB’s next meeting.
Despite the recent rally, bond market participants remain cautious. Several strategists believe the 10-year Treasury yield is likely to trade within a broad 4.30% to 4.50% range over coming months. While lower oil prices have eased inflation concerns, a sustained decline in yields will require further evidence of softer economic growth, moderating labour market conditions and a more dovish Federal Reserve.
The broader message from fixed-income markets is that investors are becoming increasingly data dependent. With geopolitical risks receding and oil prices normalising, attention is shifting back to economic fundamentals. Inflation, labour market trends and central bank communication will determine whether the recent bond rally can be sustained or whether higher-for-longer interest rates re-emerge as the dominant market narrative.
#USTreasuries #BondMarket #TreasuryYields #InterestRates #USDollar #foresightanalytics #GlobalMarkets
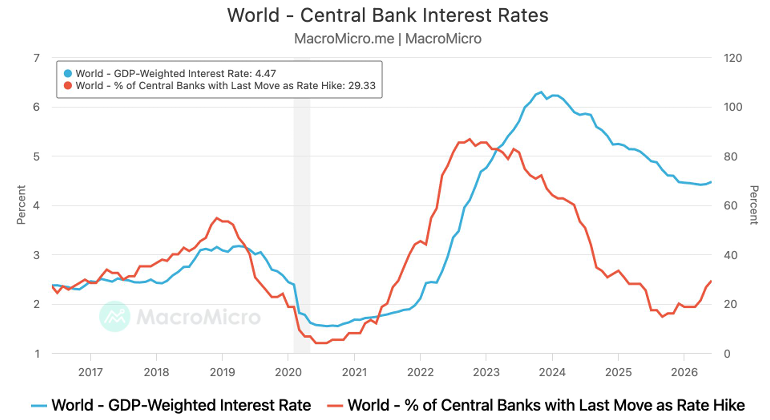
Chart of the Week - Super Central Bank Week & Global Rates
Following last week's "super central bank week", global central banks have adopted a modestly more hawkish tone, with the weighted average policy rate and the proportion of central banks raising interest rates both edging higher. However, the recent ceasefire agreement is expected to reduce energy-driven inflation pressures, lowering the need for aggressive monetary tightening. Rather than signalling a return to the widespread rate hikes seen in 2022, recent policy actions appear to be precautionary. The outlook for the U.S. Federal Reserve also remains relatively benign, as inflation forecasts may prove overly pessimistic. As a result, the base case remains that the Fed will keep interest rates unchanged through 2026.
#ChartOfTheWeek #CentralBanks #InterestRates #GlobalRates #MonetaryPolicy #FederalReserve #Inflation #BondMarkets #FixedIncome #GlobalEconomy
Overview of the Australian Equities Market
Australian Shares End Higher as Gold Rebounds, But Weekly Losses Persist
Australian equities finished Friday modestly higher, supported by a rebound in precious metals and energy prices, although the market still recorded a weekly decline as global concerns over higher US interest rates continued to weigh on investor sentiment. The S&P/ASX 200 rose 0.2% to close at 8,764.2, while the broader All Ordinaries gained 0.1%. Despite the positive finish, the benchmark index fell 0.7% over the week and remains up only 0.6% for the year.
The materials sector led the advance as gold prices recovered from an eight-month low. Gold climbed back above US$4,000 an ounce, prompting a strong rally across the sector, with all of the ASX 200’s top-performing stocks coming from gold mining. Kingsgate Consolidated, Ramelius Resources and Perseus Mining were among the strongest performers. Major diversified miners also benefited, with BHP, Rio Tinto and Fortescue posting solid gains as commodity prices stabilised.
Energy stocks also strengthened after Brent crude rebounded to around US$73.80 a barrel, supporting gains in Woodside, Santos and Whitehaven Coal.
Technology, however, remained under pressure following weakness in US mega-cap technology stocks amid renewed concerns over elevated valuations and the prospect of further Federal Reserve rate hikes. Data centre operator NEXTDC and Megaport were among the weakest performers. Healthcare also lagged as CSL fell sharply.
Read more - https://t.co/3RnkI4FpgG
#Australian Shares #auEquities #MarketUpdate #InvestingInsights #EconomyWatch #WeeklyOutlook #foresightanalytics
Overview of the US Equities Market
Stock Rally Meets Reality as Higher Rates and AI Concerns Trigger Market Rotation
After months of strong gains, US equity markets have encountered a significant reality check as investors reassessed valuations against a backdrop of higher interest rates, AI-related uncertainty and mounting concerns over private credit. The S&P 500 and Nasdaq Composite both declined in every trading session during the week, falling approximately 2% and 4.6%, respectively, marking their worst weekly performance in more than a year.
The market’s change in sentiment was largely driven by Federal Reserve Chairman Kevin Warsh’s hawkish stance following the June FOMC meeting. His emphasis on inflation risks prompted investors to scale back expectations of interest rate cuts and instead consider the possibility of further tightening. That shift pushed bond yields higher and challenged the high valuations of long-duration growth stocks, particularly those tied to artificial intelligence.
Technology stocks bore the brunt of the sell-off despite continued strong earnings. Semiconductor companies experienced broad declines, with Nvidia losing nearly 9% for the week, Broadcom falling 11%, while Palantir and several global chipmakers also retreated sharply. Even upbeat guidance from Micron failed to revive investor confidence, suggesting markets are increasingly questioning whether the massive capital expenditure required to support AI infrastructure will ultimately generate returns sufficient to justify current valuations.
The weakness also extended to newly listed growth companies, with SpaceX giving back much of its post-listing gains as investors became more selective towards speculative growth assets. Higher borrowing costs, continued supply chain disruptions and concerns about private credit exposures added further pressure to market sentiment. In contrast, investors rotated towards more defensive sectors. Healthcare, utilities and consumer staples all outperformed as investors sought stable earnings and lower valuation risk. The equal-weighted S&P 500 significantly outperformed the traditional market-cap weighted index, indicating that the sell-off was concentrated in the largest technology companies rather than the broader market.
Read more - https://t.co/0O1pbIrLGL
#USEquities #StockMarket #GlobalMarkets #MarketUpdate #InvestingInsights #EconomyWatch #FederalReserve #OilPrices #AIStocks #WeeklyOutlook #foresightanalytics
Australian interest rate market pricing has eased over the week to 19 June 2026, with the 19-Jun curve sitting visibly below both the 12-Jun and 5-Jun profiles across the full forward horizon. Unlike the gradual repricing seen in earlier weeks, this week’s move represents a genuine and consistent downward shift — though, notably, every reading across all three weeks still sits at or above the current cash rate, meaning the market continues to price some residual chance of further tightening rather than a swing toward easing.
https://t.co/bKwaS5YvES
#WeeklyCashReport #RBACashRate #InterestRateOutlook #AustralianMarkets #SavingsAccounts #FixedIncome #YieldReport
The ASX hybrid market pulled back across the week ending 19 June 2026, with negative price movement broadly distributed through the standard segment while the non-standard cohort held relatively steady — a week defined more by consolidation than conviction as income characteristics continued to underpin the asset class’s structural appeal.
Yield standings remained essentially intact. In the non-standard space, Nufarm (NFNG) reclaimed ground at 10.64%, widening ahead of Ramsay Health Care (RHCPA) at 9.17%. The standard cohort continued to be anchored at its higher-yielding end by Judo Capital (JDOPA) at 9.79%, followed by Latitude (LFSPA) at 9.21% and Macquarie Bank Capital Notes 2 (MBLPC) at 9.06% — names that preserve a substantial income margin over the densely grouped major bank hybrid cluster, continuing to attract yield-oriented demand.
Read more - https://t.co/97xdAc5mfm
#Hybrids #HybridSecurities #FixedIncome #IncomeInvesting #CreditMarkets #YieldInvesting #AustralianMarkets #InvestmentResearch #MarketUpdate #foresightanalytics #yieldreport
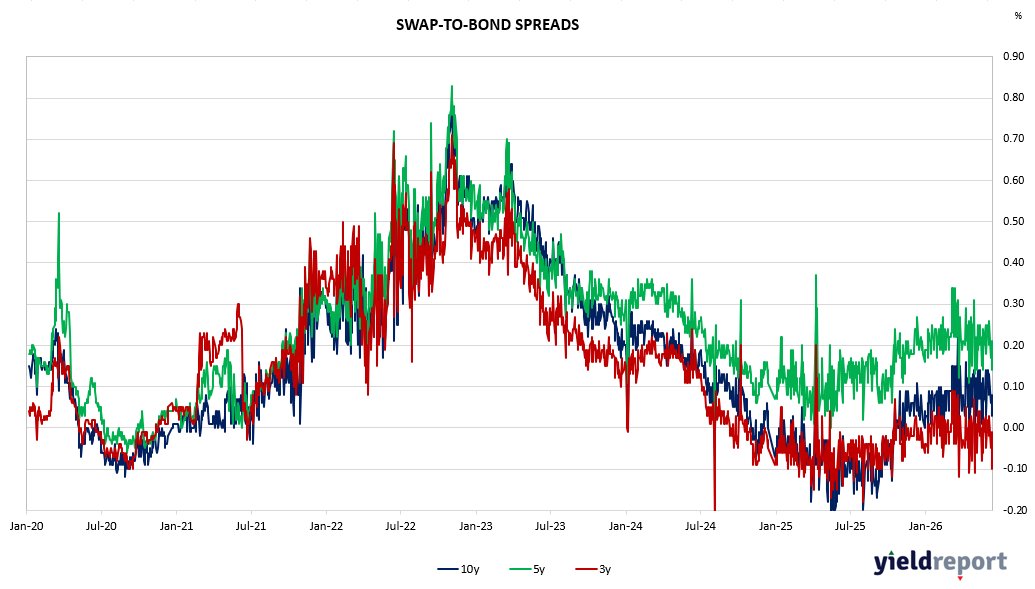
The structural split between near-term funding benchmarks and the interest rate swap curve persisted through the week to 19 June 2026, though the character of the divergence shifted in a notable way. Unlike the prior week’s one-sided retreat in swap rates, both BBSW and swap markets registered modest weekly gains in this period — yet their monthly profiles remain deeply at odds, with the swap curve carrying the accumulated weight of several weeks of aggressive repricing lower while the front end holds at levels consistent with a still-restrictive funding environment.
BBSW rates were virtually unchanged across all tenors on the week, sustaining the pattern of entrenched near-term firmness that has defined the short end since late April. All three tenors edged fractionally higher by less than 1 basis point, with the 1-month rate closing at 4.30 per cent, the 3-month at 4.46 per cent, and the 6-month at 4.84 per cent. Monthly movements across the strip tell a more graduated story: the 1-month is barely changed over four weeks, the 3-month has added just 1 basis point, and the 6-month has firmed 6 basis points — a profile that points to conditions stabilising at the very front end while some residual tightening pressure lingers at the six-month horizon. Taken together, BBSW continues to reflect a market operating under policy constraint, with little sign of easing in the immediate funding window.
Read More - https://t.co/PlQ9J3Gr89
#Weeklyswaps #weeklymarketinsights #InterestRateOutlook #AustralianMarkets #SavingsAccounts #FixedIncome #YieldReport #bankbillswaps #swaprates
Term Deposit markets continue to favour the mid-curve, with the strongest opportunities concentrated in the 6–12 month range. The 1-year tenor stands out—offering up to 5.45% (RACQ & Great Southern Bank) alongside the highest averages and tightest pricing dispersion, making it the most reliable yield point. Short-term rates remain inconsistent, while 3–6 months offer selective value and flexibility. Longer tenors (2–5 years) deliver attractive peak rates (up to 5.60% with Rabobank) but weaker overall averages. A balanced ladder across 6 months, 1 year, and selective long-term exposure continues to be the optimal strategy.
Read more 👉 https://t.co/TZXnJBYflT
#WeeklyTermDeposits#SavingsStrategy #BestRates #DepositLaddering#FixedIncome #InvestmentTips #HighYieldSavings #SmartInvesting#FinancialPlanning#InterestRates hashtag#DepositCurve#YieldReport
Weekly Overview of the ETF Markets
Australia – Tech and Crypto Rebound as Precious Metals Retreat
The week ending 12 June 2026 brought a decisive shift in tone, with growth and technology strategies reclaiming ground lost in the prior week’s sell-off. Global X Semiconductor ETF (SEMI) led all comers at +8.8%, extending a remarkable 154.8% twelve-month run. ETFS Global Lithium Miners ETF (VOLT) added 7.1% and Betashares Crypto Innovators ETF (CRYP) gained 7.0%, while Bitcoin ETFs — VanEck (VBTC), iShares (IBIT), and Betashares (QBTC) — each recovered between 5.9% and 6.6%, suggesting the prior week’s digital asset rout had run its course for now.
The week’s laggards were clustered in precious metals and defensive strategies. Global X Physical Platinum (ETPMPT) fell 7.9%, Physical Silver (ETPMAG) shed 7.4%, and Betashares Gold Bullion ETF – Ccy Hedged (QAU) dropped 5.5%. Inverse products gave back ground in line with the risk-on tone, with SNAS off 5.3% and BBOZ declining 5.1%. Crude oil (OOO) also retreated 5.9% despite retaining a strong 73.5% year-to-date gain.
Over longer horizons, semiconductor and Asian technology themes remain firmly in command. iShares MSCI South Korea Capped ETF (IKO) holds +172.9% over twelve months, while SEMI sits at +154.8% and Global X Hydrogen ETF (HGEN) at +133.2%. Energy transition exposures — Green Metal Miners (GMTL) and Battery Tech & Lithium (ACDC) — have each returned over 90% annually. Crypto products anchor the bottom, with Ethereum ETFs down 43–45% over twelve months and SNAS off 51%.
https://t.co/34sBPiaY16
#ETF #ETFInvesting #Investing #USMarkets #ASX #SP500 #AustralianShares #GlobalMarkets #MarketUpdate #InvestmentStrategy #foresightanalytics #yield
The ASX hybrid market pulled back across the week ending 19 June 2026, with negative price movement broadly distributed through the standard segment while the non-standard cohort held relatively steady — a week defined more by consolidation than conviction as income characteristics continued to underpin the asset class’s structural appeal.
Yield standings remained essentially intact. In the non-standard space, Nufarm (NFNG) reclaimed ground at 10.64%, widening ahead of Ramsay Health Care (RHCPA) at 9.17%. The standard cohort continued to be anchored at its higher-yielding end by Judo Capital (JDOPA) at 9.79%, followed by Latitude (LFSPA) at 9.21% and Macquarie Bank Capital Notes 2 (MBLPC) at 9.06% — names that preserve a substantial income margin over the densely grouped major bank hybrid cluster, continuing to attract yield-oriented demand.
Read more - https://t.co/EL17cOGHNz
#Hybrids #HybridSecurities #FixedIncome #IncomeInvesting #CreditMarkets #YieldInvesting #AustralianMarkets #InvestmentResearch #MarketUpdate #foresightanalytics
Chart of the Week – Global Earnings Growth Supportive of Ongoing Rally
Global earnings breadth remains exceptionally strong, supporting the ongoing rally in world equities. As at May 2026, 73.2% of major global equity markets are reporting positive year-on-year earnings per share (EPS) growth, while an even stronger 92.9% of markets are expected to deliver positive forward EPS growth. Historically, readings above 70% indicate broad-based earnings expansion rather than gains being concentrated in a handful of markets or sectors. The forward earnings measure near 93% suggests analysts remain highly optimistic about corporate profit growth over the coming year. This robust earnings backdrop has coincided with the MSCI All Country World Index (ACWI) reaching a record high of 1,126. While earnings breadth has eased slightly from recent peaks, it remains well above long-term averages and continues to signal healthy global economic momentum, supportive equity market fundamentals, and a favourable environment for risk assets despite ongoing geopolitical and macroeconomic uncertainties.
#GlobalEquities #EarningsGrowth #EPS #MarketBreadth #MSCIACWI #EquityMarkets #InvestmentStrategy #GlobalEconomy #RiskAssets #MarketOutlook
Overview of the US Equities Market
Markets Rebound as U.S.–Iran Peace Deal Eases Energy Fears
Global equity markets rallied strongly as investors welcomed a preliminary peace agreement between the U.S. and Iran, reducing fears of a prolonged Middle East conflict and easing concerns over energy supply disruptions. The most immediate impact was seen in oil and gasoline markets. Brent crude finished near US$80 per barrel, down significantly from recent highs and moving closer to its pre-conflict level of around US$72.50. U.S. gasoline prices also fell below US$4 per gallon for the first time in more than two months, providing relief to consumers and helping moderate inflation concerns.
Equity markets responded positively. The Nasdaq surged 1.9%, leading gains as investors returned aggressively to technology and AI-related stocks. The S&P 500 rose 1.1%, while the Dow Jones added 0.1%. For the week, all major indices finished higher, with technology stocks once again driving performance. Semiconductor shares were particularly strong, with the semiconductor index jumping 6.4%, supported by renewed enthusiasm around AI infrastructure spending and domestic chip manufacturing initiatives.
The rally came despite a notably hawkish Federal Reserve. At his first meeting as Fed Chair, Kevin Warsh emphasized the Fed’s commitment to restoring inflation to its 2% target. Markets have sharply repriced rate expectations, with traders now assigning roughly a 50% probability of cumulative rate increases of at least 50 basis points by year-end, compared with only 16% a week earlier.
Bond markets reflected this mixed outlook. The 10-year Treasury yield eased slightly to 4.45%, supporting equity valuations, while the 2-year yield climbed to its highest level since early 2025, reflecting expectations of tighter monetary policy. While investors celebrated the peace agreement, some strategists warned that markets may be underestimating risks. Oil supply normalization could take time, the Fed remains firmly hawkish, and any setback in the peace process could trigger renewed volatility. Nonetheless, for now, lower energy prices and enthusiasm for AI-driven growth have outweighed concerns about higher-for-longer interest rates.
#USEquities #StockMarket #GlobalMarkets #MarketUpdate #InvestingInsights #EconomyWatch #FederalReserve #OilPrices #AIStocks #WeeklyOutlook #foresightanalytics
Australian interest rate market pricing has remained broadly stable over the week to 12 June 2026, with the three observed curve profiles 29-May, 5-Jun, and 12-Jun clustered tightly across the full forward horizon. The absence of any meaningful divergence between weekly snapshots confirms a market that is consolidating around current pricing rather than committing to a clear directional move.
At the front end, implied rates for June 2026 sit close to the prevailing cash rate of 4.35%, which the RBA Cash Rate chart confirms as the current setting as of mid-2026. Near-term pricing reflects comfort with the RBA remaining on hold in the immediate term, with no material probability of a move priced for the coming month.
Further out, the forward curve across all three observation dates plateaus in the 4.40–4.50% range through late 2026 and into mid-2027, embedding a modest residual premium above the current cash rate setting of 4.35%. This implies markets are pricing in a limited probability of one additional move of approximately 10–15 basis points over the forecast horizon, rather than anticipating a sustained tightening or easing cycle.
Read more - https://t.co/82GAAs6rnM
#AustralianCashRate #RBACashRate #SavingsAccounts #CashRateOutlook #YieldReport
The ASX hybrid market closed the week ending 12 June 2026 on a firm footing, with price gains broadening across the standard segment and income appeal continuing to anchor demand in both the standard and non-standard cohorts.
Yield rankings remained largely unchanged. Nufarm (NFNG) retained top billing in the non-standard space at 10.43%, ahead of Ramsay Health Care (RHCPA) at 9.19%. Within the standard universe, Judo Capital (JDOPA) strengthened its lead to 9.87%, with Latitude (LFSPA) at 9.27% and Macquarie Bank Capital Notes 2 (MBLPC) at 9.13% names that collectively sustain a considerable yield advantage over the tighter-spread major bank issues and remain the primary destination for income-focused allocators.
Price momentum across the standard segment was broadly positive, with gains notably widespread. Westpac Capital Notes 7 (WBCPJ) was the standout, advancing +1.57%, followed by ANZ Capital Notes 6 (AN3PI) at +0.63% and MBLPC recovering a further +0.69%. NAB Capital Notes 5 (NABPH) added +0.38% and Judo Capital (JDOPA) rose +0.37%. Declines were limited and shallow Latitude (LFSPA) eased just –0.16%, Bank of Queensland Capital Notes 2 (BOQPF) dipped –0.24%, and Bendigo Bank Capital Notes (BENPH) slipped –0.12%. In the non-standard space, NFNG gave back a modest –0.07% while RHCPA edged +0.03% higher.
Read more - https://t.co/3IXExHDexV
#WeeklyTermDeposits #SavingsStrategy #BestRates #DepositLaddering #FixedIncome #InvestmentTips #HighYieldSavings #SmartInvesting #FinancialPlanning #InterestRates #DepositCurve #YieldReport
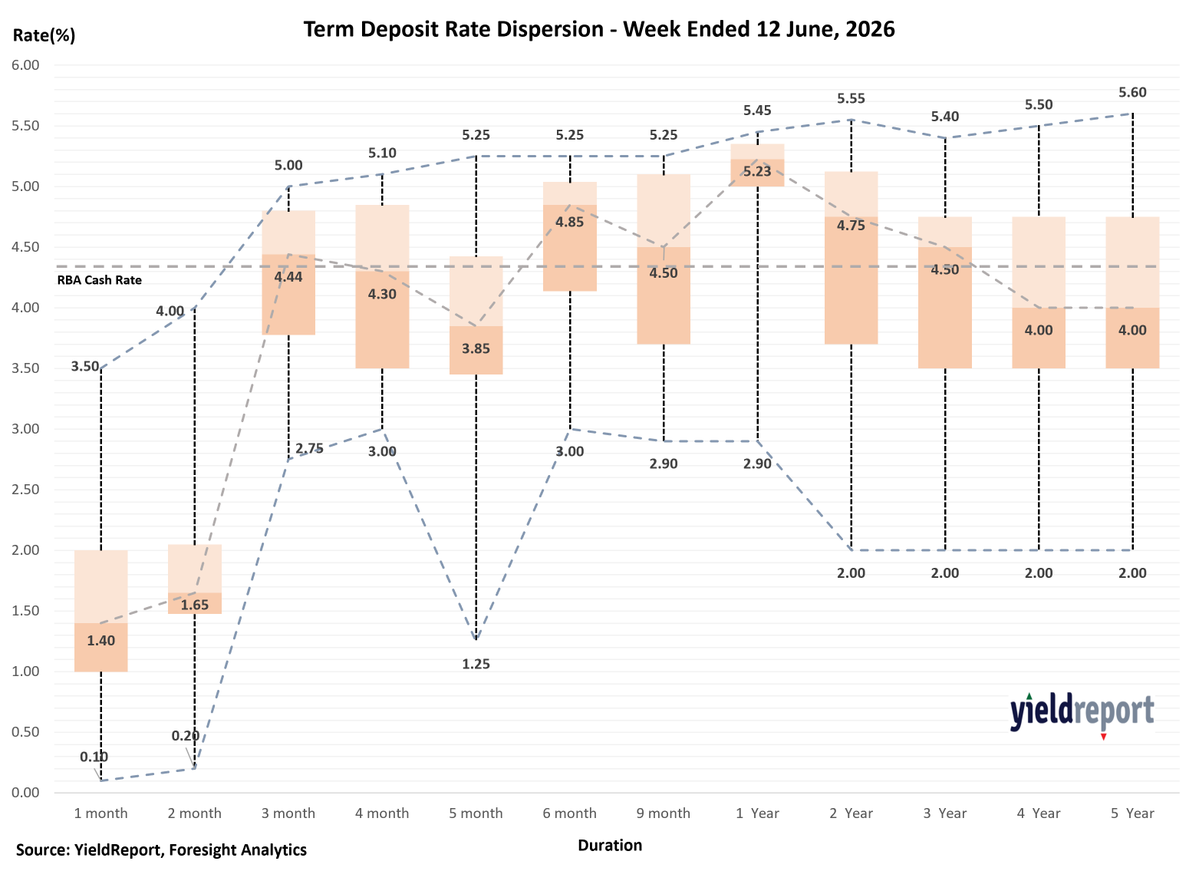
Over the past week, ending June 12, 2026, the strongest opportunity across the deposit curve remains concentrated around 6 months to 1 year, where average rates are highest and competition is deepest. The standout tenor is 1 year, with an average rate of 4.95%, median 5.23%, and top rates of 5.45% from RACQ Bank and Great Southern Bank. This suggests the 1-year segment continues to offer the best balance of yield, breadth and reliability.
For shorter terms, value remains uneven. 1–2-month deposits have low average rates of 1.54% and 1.79%, with wide ranges driven by a few high-rate outliers. Great Southern Bank and in1bank lead at 3.50%–4.00%, but most institutions are materially lower. These terms suit liquidity parking only.
The 3–5-month range is more attractive. The 3-month average is 4.25%, median 4.44%, with top rates led by Great Southern Bank and Bank Australia at 5.00%, Judo Bank, Bank First and Macquarie Bank at 4.95%, and Arab Bank Australia at 4.85%. At 5 months, P&N Bank at 5.25% and Judo Bank at 4.90% stand out, although dispersion remains high due to BOQ’s low 1.25% outlier. The 4-month tenor has also improved with Bank First reaching 5.05%.
Read more - https://t.co/UMov7eYO3c
#WeeklyTermDeposits #SavingsStrategy #BestRates #DepositLaddering #FixedIncome #InvestmentTips #HighYieldSavings #SmartInvesting #FinancialPlanning #InterestRates #DepositCurve #YieldReport
The divergence that has characterised Australian short-term and fixed income markets in recent weeks widened materially through the period to 12 June 2026, as the two segments of the market moved in starkly opposing directions. While BBSW rates displayed ongoing resilience at the front end, swap rates fell sharply across all tenors with the belly of the curve absorbing the most pronounced decline, signalling a decisive re-pricing lower in medium-term rate expectations that stands in marked contrast to the persistent firmness in near-term funding conditions.
At the front end, BBSW rates proved largely immovable on the week, underscoring the entrenched tightness that has defined the immediate funding window since late April. The 1-month tenor edged fractionally higher by less than 1 basis point to close at 4.30 per cent, its monthly gain of just 1 basis point reflecting a near-complete stabilization at that horizon. The 3-month rate was effectively flat on the week at 4.46 per cent, with a modest monthly advance of 3 basis points pointing to incrementally easing but still elevated conditions at that maturity. The 6-month tenor slipped 1 basis point to 4.84 per cent, though its monthly rise of 6 basis points indicates that conditions in the medium-term funding window remain somewhat firmer than a month ago. Across the strip, the pattern is consistent: a policy environment that continues to constrain liquidity, with any softening gradual and concentrated at longer BBSW horizons.
Read more - https://t.co/XT2HzYZqqo
#HighYieldInvesting #foresightanalytics #IncomeInvesting #asx #bankbillswaps
Overview of the Weekly ETF Markets
The week ending 5 June 2026 saw a sharp reversal in sentiment, with defensive and inverse positioning dominating the top of the leaderboard amid a renewed downturn in growth assets. The Global X Ultra Short Nasdaq 100 Complex ETF (SNAS) topped weekly returns at 10.4%, while the Betashares US Equities Strong Bear HF – Hedged (BBUS) added 6.5%, signalling growing caution toward US tech valuations. Betashares S&P/ASX Australian Technology ETF (ATEC) bucked the broader trend with a 6.4% gain, and the Betashares Strong US Dollar Hedge Fund (YANK) rose 4.6% as the greenback firmed.
Digital asset products bore the brunt of the sell-off. Betashares Ethereum ETF (QETH) tumbled 20.7%, with Global X 21Shares Ethereum (EETH) down 17.8% and Monochrome Ethereum (IETH) off 17.2%. Bitcoin exposures were similarly battered, with VanEck Bitcoin (VBTC), iShares Bitcoin (IBIT) and Betashares Bitcoin (QBTC) all shedding between 16–17%. Betashares Space Industry ETF (RCKT) also fell sharply, down 18.7% for the week.
Over the year-to-date and twelve-month horizons, South Korean and semiconductor exposures continue to lead: iShares MSCI South Korea Capped ETF (IKO) remains the standout at 84.8% YTD and 179.5% over twelve months, followed closely by Global X Hydrogen (HGEN) and Global X Semiconductor (SEMI), both exceeding 144% annually. Crypto products dominate the bottom of the twelve-month table, with Ethereum ETFs down over 40% and SNAS off 50.2%.
On flows, Macquarie Subordinated Debt Active ETF (MQSD) attracted the largest weekly inflow at A$161.4 million, followed by VanEck MSCI World Ex-Australia Quality ETF (QUAL) at A$130.9 million and PIMCO Australian Bond Active ETF (PAUS) at A$100.8 million, pointing to a clear rotation toward fixed income and quality factors. Notable outflows hit iShares Core Corporate Bond ETF (ICOR) at -A$86.3 million and Betashares Gold Bullion ETF – Ccy Hedged (QAU) at -A$84.4 million, while Quay Global Real Estate funds remained persistent laggards across longer-term flow horizons.
Read more- https://t.co/TB6R4kpY7g
#ETF #ETFInvesting #Investing #USMarkets #ASX #SP500 #AustralianShares #GlobalMarkets #MarketUpdate #InvestmentStrategy #foresightanalytics #yield
We are pleased to share our latest press release with you below!
📢 Foresight Ratings has completed its inaugural assessment of the ORDE Income Fund, assigning a VERY STRONG Investment Rating and a MORE COMPLEX Product Complexity Rating.
The rating reflects a high level of confidence in the Fund's ability to deliver attractive risk-adjusted returns while recognising the specialist nature of its Australian private mortgage lending strategy.
Key highlights include:
✔️ VERY STRONG Investment Rating
✔️ Target return of RBA Cash Rate +1.65% p.a.
✔️ Diversified portfolio of first-registered Australian mortgage assets
✔️ Senior mortgage exposure with disciplined credit underwriting
✔️ Robust liquidity framework and ORDE-funded reserve structures
✔️ Institutional governance with independent oversight and custody
✔️ Supported by ORDE's $6 billion lending platform, 200+ staff, and 8,000+ broker network
As with any private credit investment, investors should consider factors such as the 12-month term lock-up, non-unitised structure and underlying credit exposures.
The assessment highlights ORDE's strong governance, experienced investment team and resilient portfolio construction framework, reinforcing its position as a compelling income solution for wholesale investors seeking exposure to Australian private credit.
𝘛𝘰 𝘳𝘦𝘢𝘥 𝘵𝘩𝘦 𝘧𝘶𝘭𝘭 𝘱𝘳𝘦𝘴𝘴 𝘳𝘦𝘭𝘦𝘢𝘴𝘦 𝘤𝘭𝘪𝘤𝘬 𝘩𝘦𝘳𝘦:
https://t.co/nwW44U8HPv
𝐑𝐞𝐠𝐢𝐬𝐭𝐞𝐫 𝐡𝐞𝐫𝐞 𝐭𝐨 𝐚𝐜𝐜𝐞𝐬𝐬 𝐭𝐡𝐞 𝐟𝐮𝐥𝐥 𝐫𝐞𝐩𝐨𝐫𝐭: https://t.co/hteaxhJhZ0
General Disclaimer on Investment Ratings: https://t.co/r9H3g8S7Pa
#ForesightRatings #InvestmentRatings #IncomeInvesting #ORDEIncomeFund #ForesightAnalytics #ORDEFinancial #FundRating #ManagedFunds #PrivateCredit #PrivateMortgage #FixedIncome #MortgageLending #AlternativeCredit
Chart of the Week - AI-related Mega IPOs
The coming wave of AI-related mega IPOs could become one of the largest capital-raising events in market history. SpaceX, OpenAI and Anthropic are collectively targeting around US$200 billion in IPO proceeds during the second half of 2026—more than the total capital raised during the entire dot-com IPO boom between 1995 and 2000. The motivation is clear: all three companies are competing aggressively for scarce compute capacity, AI talent and data infrastructure, making public markets the most efficient source of long-duration capital. Anthropic recently achieved a US$96.5 billion valuation following its Series H funding round, overtaking OpenAI’s US$85.2 billion valuation. Unlike SpaceX, which faces significant debt repayment requirements following its IPO, Anthropic enters the public market from a position of operational strength, with revenue growing rapidly and profitability increasingly within reach. The scale of these offerings has the potential to reshape capital flows across equities, technology sectors and alternative assets.
#MegaIPOs #AIInvestment #CapitalMarkets #SpaceXIPO #OpenaiIPO #AnthropicIPO #TechFunding #MarketHistory #ComputeCapacity #AIInfrastructure #GlobalMarkets #AlternativeAssets #foresightanalytics
Overview of the US Treasuries Market
Global bond markets ended the week on a constructive note as hopes of a diplomatic breakthrough between the United States and Iran reduced concerns about a prolonged disruption to global energy supplies. While yields rose modestly on Friday, Treasury markets still recorded solid weekly gains, reflecting growing confidence that inflation risks linked to the Middle East conflict may be easing.
The benchmark US 10-year Treasury yield finished the week at 4.49%, down around 5 basis points from the previous week, while the more policy-sensitive 2-year Treasury yield fell 8 basis points to 4.08%. The decline in yields was driven by optimism that the Strait of Hormuz could reopen and that oil prices, which fell more than 6% during the week, would continue to moderate. Lower energy prices reduce inflation risks and support the case for eventual Federal Reserve easing.
Despite the rally, investors are not yet pricing in an aggressive decline in yields. Strategists generally expect the 10-year Treasury yield to remain anchored around the 4.5% level in the near term, with meaningful downside likely only if inflation continues to soften and labour market conditions weaken. Under such a scenario, yields could gradually move towards 4.3% by the end of the year.
The implications of lower oil prices extended beyond the United States. Japanese government bonds strengthened as investors welcomed the prospect of easing inflation pressures, while European bond markets also benefited from reduced energy concerns. In Germany, bond strategists expect 10-year Bund yields to remain relatively stable around current levels, although lower energy prices could provide some relief at the short end of the curve.
The United Kingdom was a notable exception. Weak economic data showing a contraction in April GDP prompted a sharp rally in gilts, with investors reducing expectations that the Bank of England would follow the European Central Bank’s recent interest rate increase. The softer growth outlook reinforced the view that the UK economy remains vulnerable to tighter monetary conditions.
More broadly, the week’s market action highlighted how closely bond markets remain tied to developments in the Middle East. Investors are increasingly treating oil prices as the key transmission mechanism between geopolitics and monetary policy. A successful U.S.-Iran agreement would likely support lower energy prices, ease inflation pressures and provide central banks greater flexibility. Conversely, renewed disruptions to energy supplies could quickly reverse the recent rally and push yields higher once again.
For now, bond markets are signalling cautious optimism that diplomacy may prevail, but investors remain highly sensitive to any developments that could alter the inflation outlook.
#USTreasuries #FixedIncome #BondMarkets #FederalReserve #OilPrices #Geopolitics #MacroTrends #YieldCurve #Inflation #Investing