Lovely to receive a hard copy of this in the post with my first ever book chapter!
Thanks especially to Anne Eason for the opportunity and my writing partner @mfharris1
@CriminologyUWE
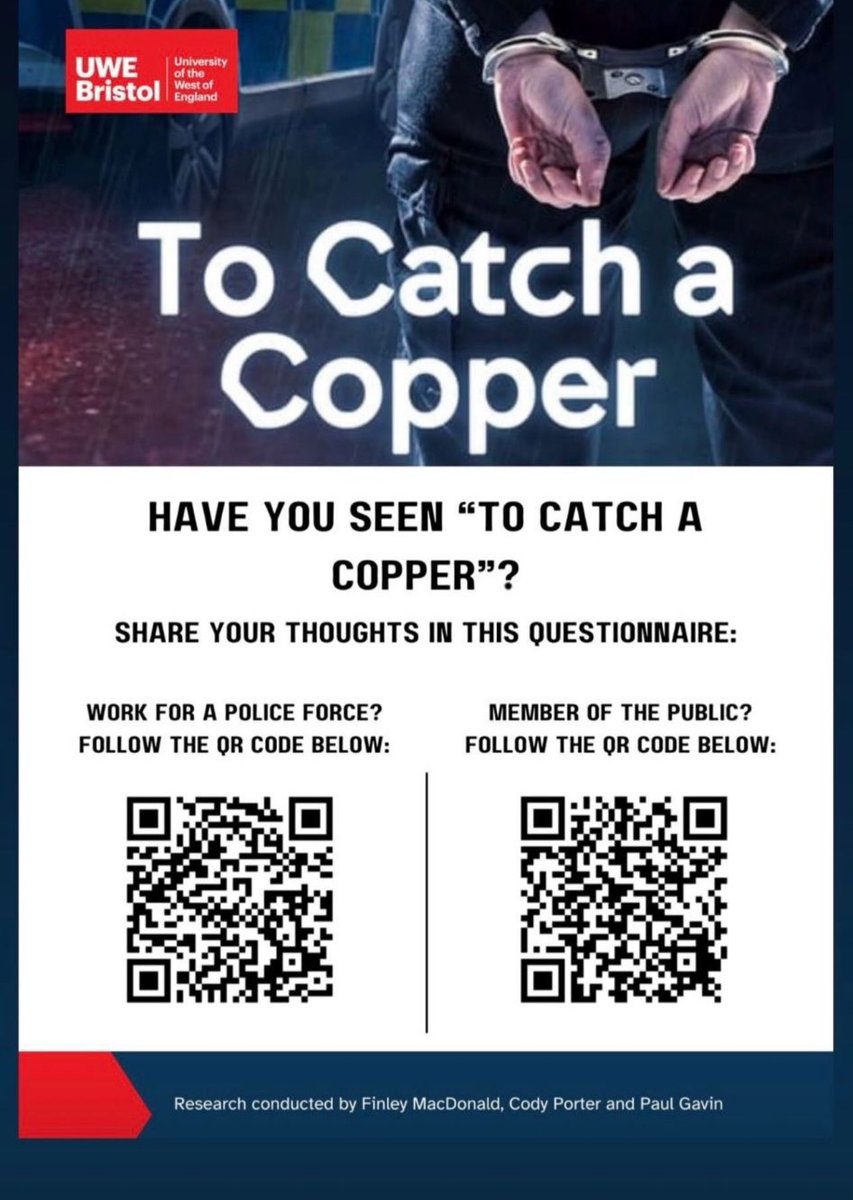
Have you seen To Catch A Copper? Please fill in our survey below!
Policing - https://t.co/wf8qwbdrlJ
Public - https://t.co/DOYwQKQzjg
@PaulGavinTweets@Cody_N_Porter
@Samfr@carlgardner Was made by a Quillette writer/editor, who is sympathetic to IQ/race science and over time became more and more active in anti-trans activism
@gmhales@dambury67 Semantic maybe, but I'd note that this is about symbolic neutrality/perceived impartiality. I've seen a number of claims that wearing specific symbols reveals that officers cannot be impartial in their duties, but that does seem to be a leap in general terms.
@gmhales@OU_Williams@WarrCriminology@StroudSAR@rylan_simpson Yes, and it would be interesting to see how that differs in other geographical/cultural contexts. Though ultimately a quantitative understanding still limited for a sensible appraoch to policy.
@OU_Williams@gmhales@WarrCriminology@StroudSAR Sounds very interesting, Chris. Looking at that Essex police policy, it does seem difficult (maybe impossible) to avoid some level of contradiction in uniform policy.
@gmhales@WarrCriminology@StroudSAR Found it very interesting that Rowley accepts the argument Jason refers to here (esp considering how powerful the symbolism is in policing in general). Shows us how far an appreciation of the semiotics of police neutrality can go, perhaps.
@gmhales@mark74brown Would be interesting to know the reason for the relabelling. In 2015 the neighbourhood function data was used by David Cameron to suggest neighbourhood policing resources had significantly increased! (I wrote about this in @PolicingInsight, but can’t access it on the site now)
@gmhales@FerhatTura19 No problem - I remembered that’s where I found it all those years ago. Not sure I’ve seen the data for before 2015ish though. May be in supplementary tables somewhere rather than the main ones
@gmhales@FerhatTura19 The yearly functions data included in each year of the service strength data, isn't it? E.g. 2020 tables F1/2. Not sure I've ever seen it compiled into multiple years, though it may have been.
Please read and consider donating to this fund to help my old friend and colleague Angus get treatment for a rare form of cancer. Maybe you don’t know him, but he is such a great person who brings joy and laughter to everyone he meets. A truly special guy
https://t.co/2s2sW60cO9
Please read and consider donating to this fund to help my old friend and colleague Angus get treatment for a rare form of cancer. Maybe you don’t know him, but he is such a great person who brings joy and laughter to everyone he meets. A truly special guy
https://t.co/2s2sW60cO9
@j_coatsworth@rosieniven@Samfr It shouldn’t really be a challenge. Social dynamics are baked in to the methodology. You should only use it when you want the data to be likely affected by group interaction
Well, it’s been a hell of a time on this site over the years, but so many reasons to leave now. I’m gradually moving operations over to Bluesky - best alternative I’ve tried so far. Link to my BS in my X profile.