@andrearslanian@tradertheory@edgeful I think the larger problem is only looking at one year of data. With that being the case 93 isn’t enough to experience different market regimes and see the robustness of the strategy.
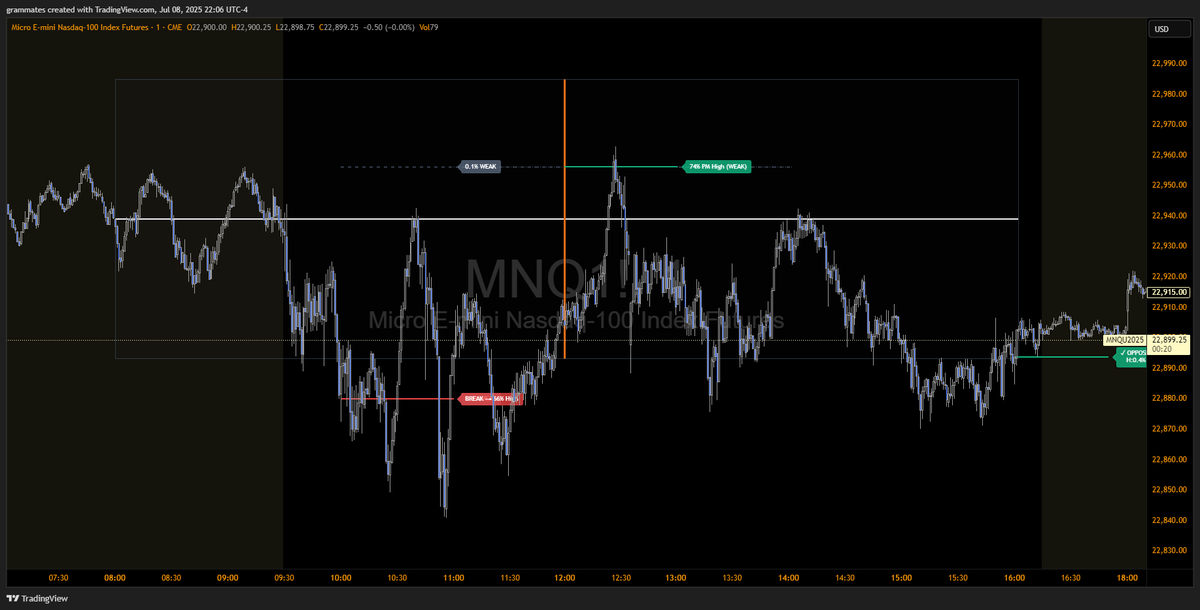
@NQStats I am nearly done with a better remake of the Noon Curve indicator created based on the stats and some insights from your Youtube video.
Not complete yet (slighly buggy at times) but we are very close
@PR1NCE_2412@ProbableChris@NQStats This one I may release a little later since it’s a lot larger and implements a lot more past the stats but i have made some for virtually ever stat he has available and some. If there is any you’re looking for I may be able to lend a hand.
@tradesbydjonko@ProbableChris@NQStats I have one on virtually all the stuff on @NQStats website as well as the one you’re viewing now.
I am trying to continue to make them better and more functional + minimal. Any you’re looking for specifically?
@ro_mogs@NQStats fall between bars throwing off the hourly calculation.
Ex:
Hour boundary at 10:00:00 AM:
- 1-minute chart: Bar starts exactly at 10:00:00 ✅
- 15-second chart: Boundary might hit at 09:59:45 or 10:00:15 ❌
I also added logic if there is no setup per NQStats.
@ro_mogs@NQStats thanks for using it for one!
Two I have updated and pushed out the new code with a few fixes and quality of life updates.
To answer your questions:
As far as a timing issue on the 15sec chart it boils down to an issue with how TV calculated the hourly candle as it can (1)
@ProbableChris question for you, I’ve loved implementing your stats into my trading. How do you define/pickup that today will be a trend day vs just a strong movement when probabilities are still high for reversions and hourly retracement etc
@BrettSimba@TradeifyTV Segment name - “Scaling Success”
-
This segment would explore strategies for traders who have successfully passed prop firm evaluations and are now managing funded accounts. The focus is on maximizing growth while respecting firm rules etc.