Recently, the 4th member of our original group became a Dr (of Philosophy)! Thanks to Krishna Nandipati (IITM) for reviewing @SanjoyPatraIISc's thesis. And we also enjoyed a visit from another alumnus, @ASHA_S_THOMAS, now in the Ogilvie group.
The photos span quite a journey!
A new IISc study shows how excitons travel efficiently in disordered systems like photosynthesis. Understanding quantum transport in such complex systems could also help us design more efficient solar cells and artificial light-harvesting systems.
Read: https://t.co/LcYOnL78Sq
(1/n) Our work in collaboration with @SatishIISc & @ArindamPhysics , now out in @JPhysChem Letters. A great team effort jointly led by Ph.D. students Karandeep Singh-Vivek Bhat, and Rittika Dey. Thanks @ANRFIndia for funding. @_SSCU_IISc
Summary below.
https://t.co/GqQ5ydD0i0
Out in @NatureComms
https://t.co/Cm8wkFqrEY
Fully intragroup, great learning curve. Synthesis of several parallel ideas. Heroic efforts by Asha, Vivek, Camelia, and Indranil, made only possible by help from Vivek Bhat & Sayan. Big thanks @ANRFIndia for funding. Summary below.
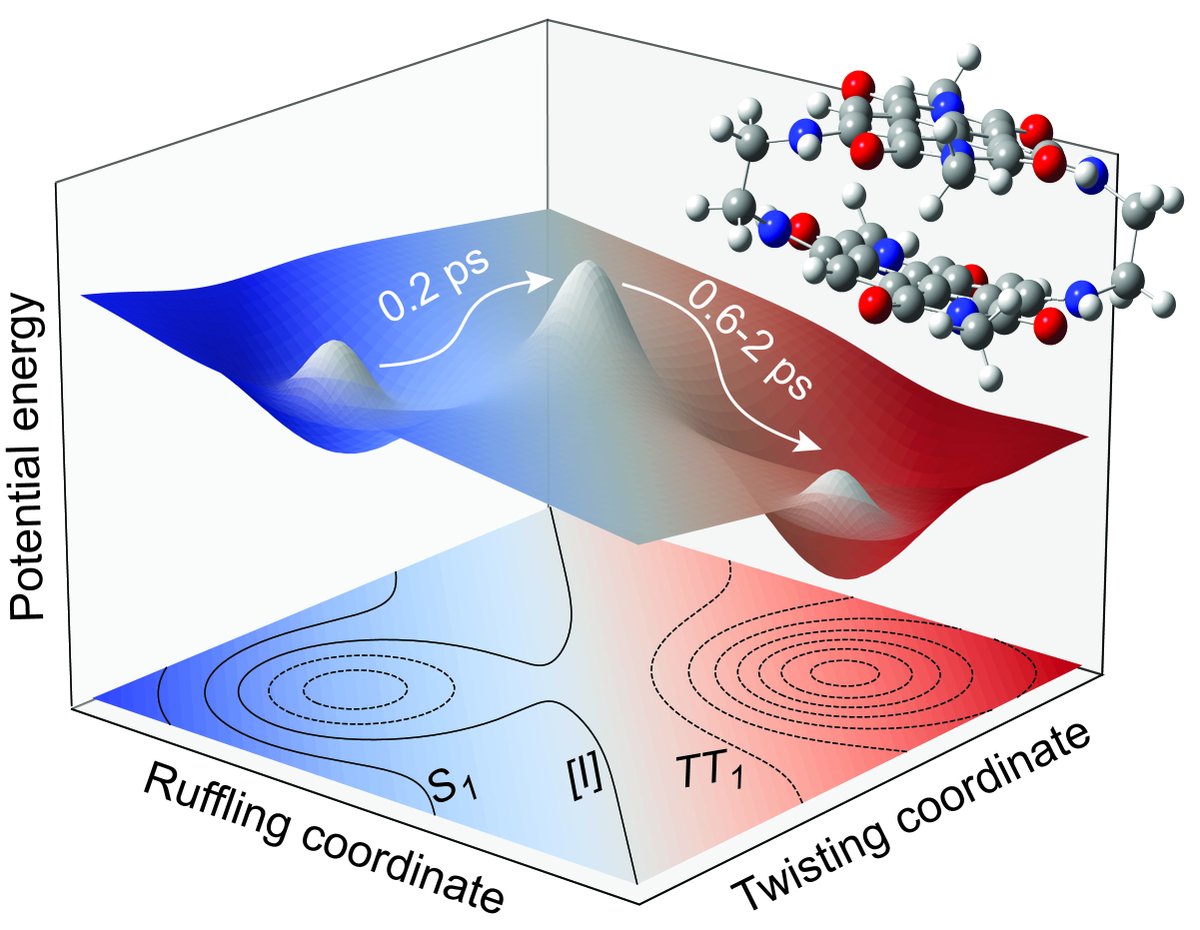
(1/n) Thrilled about @SanjoyPatraIISc 's Feature Article in @JChemPhys. We show that splitting a singlet into two triplets goes way beyond empirical considerations. Tracking reorientation(?) of electronic density provides much deeper insights, before trEPR can. @SanjoyPatraIISc
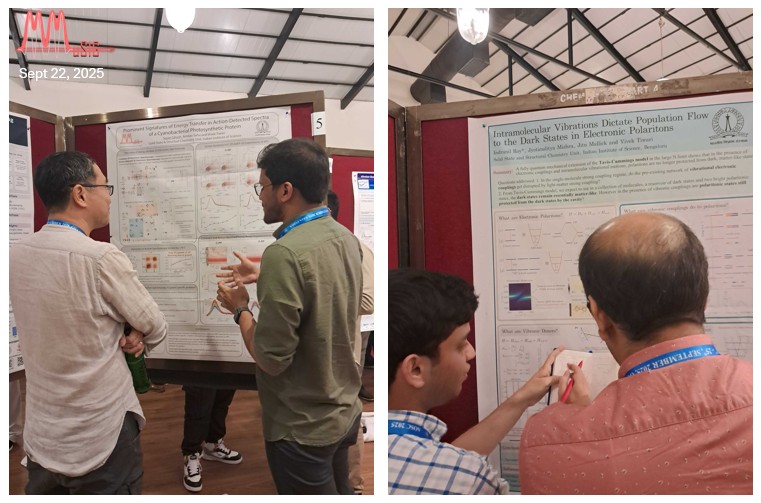
[1/2] Elated to receive the Best Poster Award at the 13th Asian and Oceanian Photochemistry Conference #APC2025. Thanks to all the organizers for bringing this inspiring event to life. It was wonderful to discuss the work with Akshay, @howesiang, and @cjx91704 .
Successfully defended my PhD!
Grateful to my PI - Dr. Vivek Tiwari @softpolaron for the constant guidance and support. Thankful to my colleagues, friends, and family who supported me on this journey. On to the next chapter!
Thrilled to have received the Best Poster Award at The 9th Asian and Oceanian Spectroscopic Conference #AOSC2025! I'm grateful for the opportunity to present my work. A huge thanks to the organizers (Naresh Patwari, @jd1278 ,@anidchemiitb) and everyone who stopped by to chat.
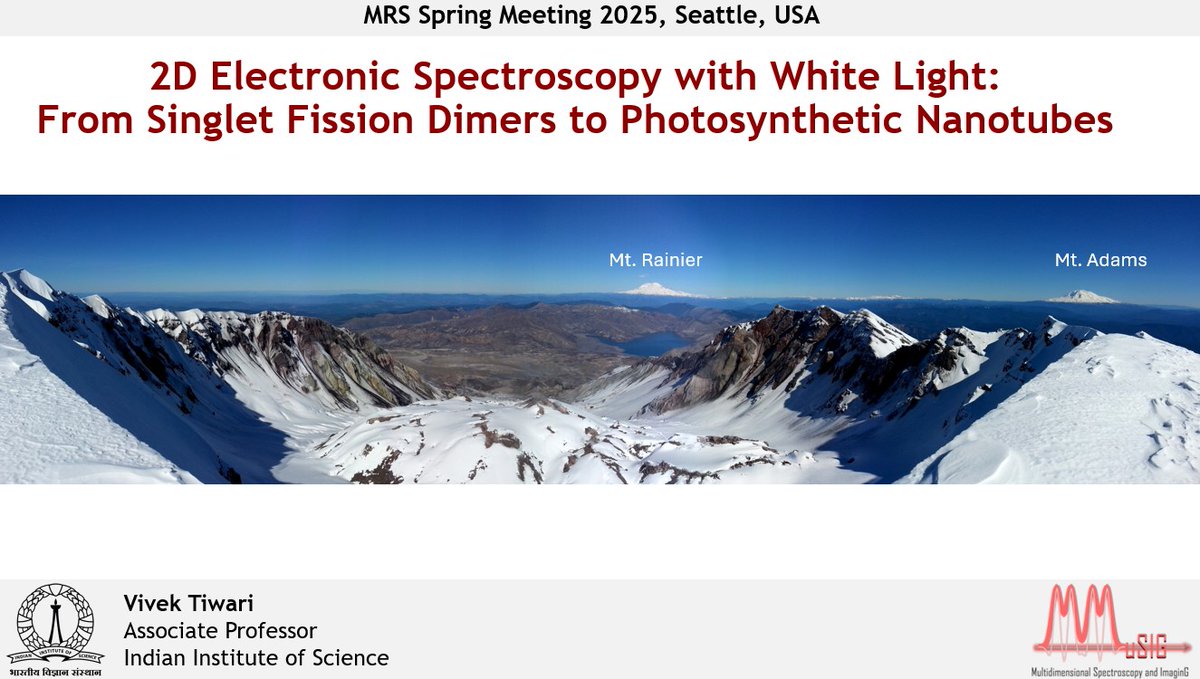
Really excited for the CH-05: Multidimensional Spectroscopy (mini-CMDS) session at #S25MRS. I will be talking tomorrow about some well resolved x-peaks from our white light 2D, & fission boys @PatraSanjoy1998 & @AtandritaB on their surprising new findings about singlet fission
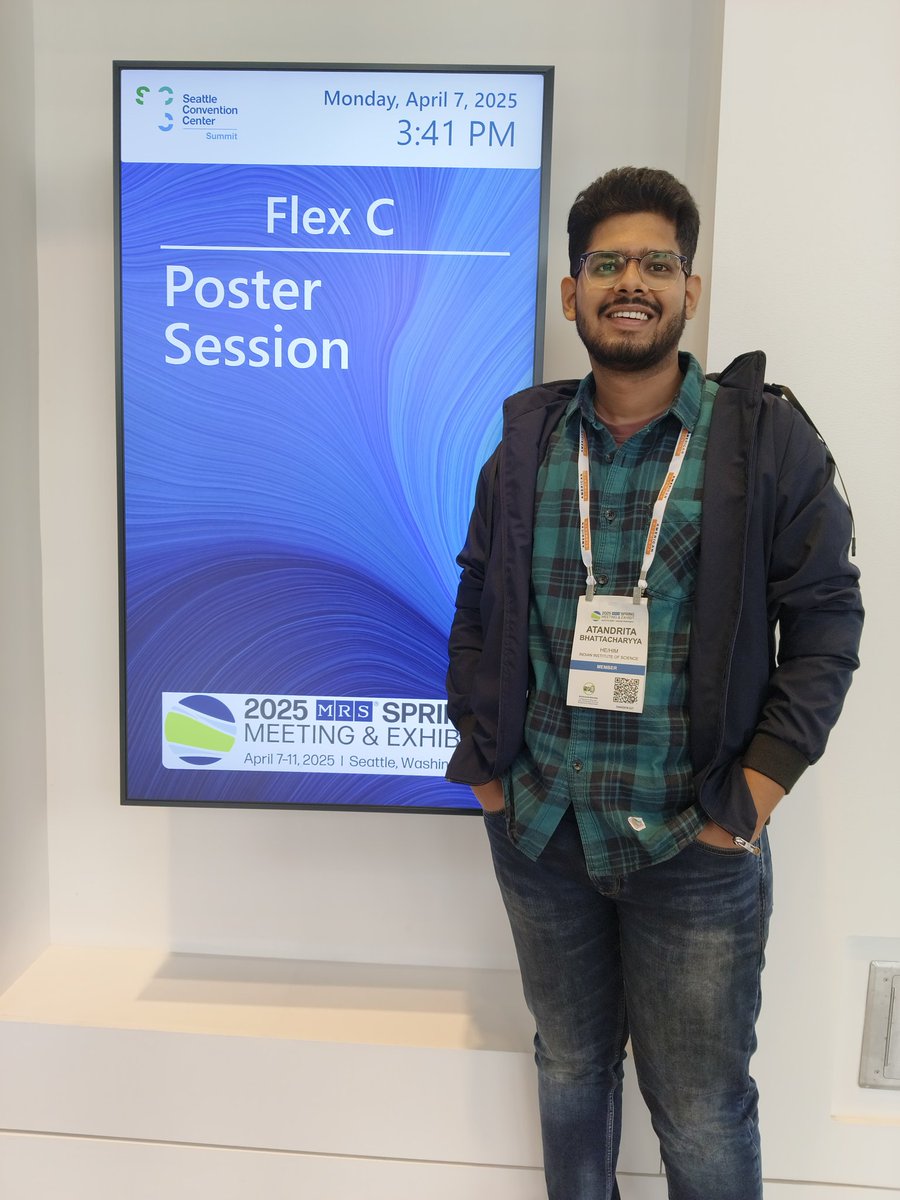
What does strong quantum beat amplitude and rotational flexibility implicate about the dynamics of intramolecular Singlet Fission? To know more check out my poster CH05-03.03 tomorrow from 5-7 PM at MRS 2025, seattle. #S25MRS@softpolaron
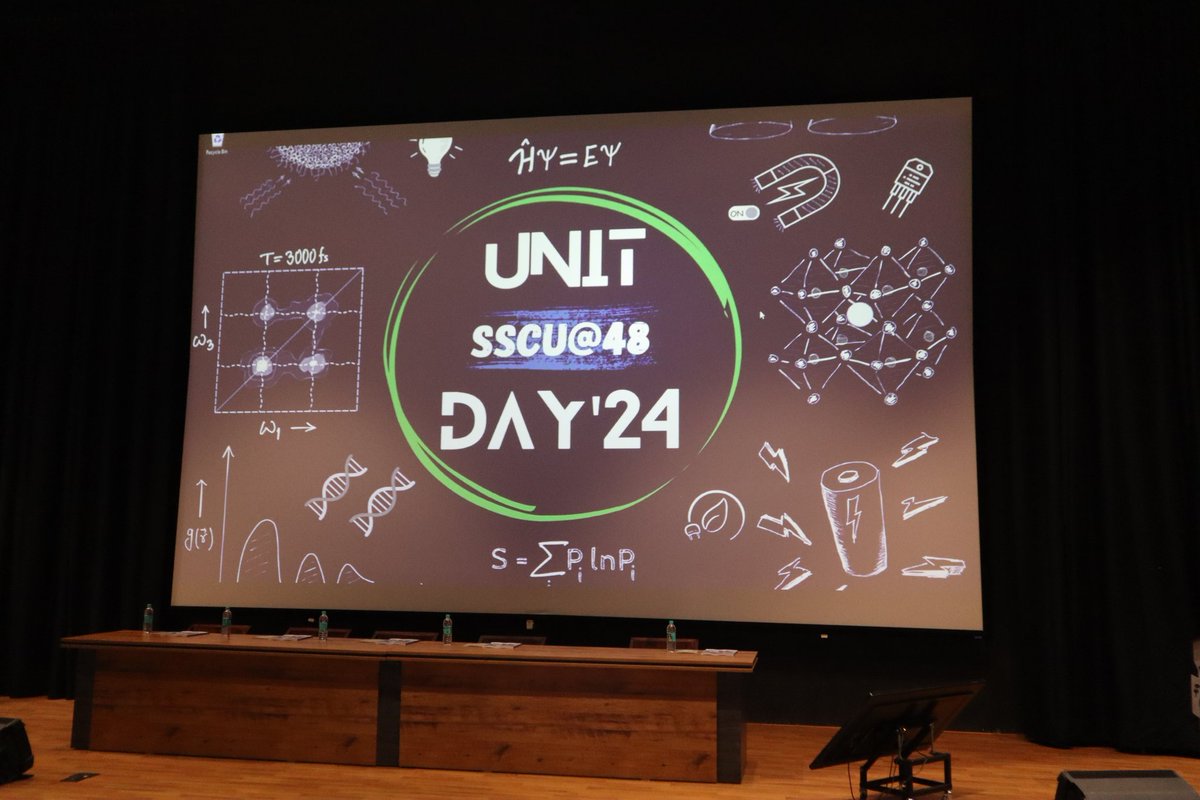
A really exciting unit day.
I thank the dept @_SSCU_IISc for giving me the opportunity to talk about our work on the role of anisotropic quantum beats in Singlet Exciton Fission. I am honoured to receive the oral presentation prize. Thanks @softpolaron for the guidance.
Really excited for Asha's Ph.D. Colloquium tomorrow! @ASHA_S_THOMAS along with @sahu_amitav dared to join a research group at T = 0 with nothing but empty space. Hear about Asha's (and @veekunb 's) heroic Ph.D. efforts and some amazing science tomorrow!
@_SSCU_IISc
Look who we found in our lab this weekend !!
It was our great pleasure to host David Jonas in @_SSCU_IISc@iiscbangalore. David talked about generalized Einstein coefficients, how to *quantitatively* derive thermodynamical quantities from 2D spectra !
Understanding the difference between Standard Deviation (SD) and Standard Error (SE) is crucial for accurate data interpretation. SD measures the variability within your data, indicating how spread out the individual data points are from the mean.
In contrast, SE measures the uncertainty around the sample mean as an estimate of the population mean. It reflects the precision of the mean, with SE decreasing as the sample size increases, making your estimate more reliable.
The relationship between SD and SE is given by the formula: SE = SD / √(sample size). While SD remains relatively constant with larger samples, SE diminishes, highlighting the reduced uncertainty in the mean estimate.
A common mistake in research is using the “±” notation without specifying whether it refers to SD or SE, leading to potential misinterpretation of the data. Clear distinction is essential for transparency and accuracy in reporting.
Key Takeaways:
• Use SD to describe data variability.
• Use SE to indicate the precision of the mean.
• Always specify which measure you are reporting.
Jitu's farewell treat(s) from April. This week @jitum_chem joins the Ph.D. program @MichiganChem to start the next chapter in his academic trajectory. Jitu helped us get started with strong light-matter coupling and such. Wish you the very best from musig_iisc !!


![AtandritaB's tweet photo. [1/2] Elated to receive the Best Poster Award at the 13th Asian and Oceanian Photochemistry Conference #APC2025. Thanks to all the organizers for bringing this inspiring event to life. It was wonderful to discuss the work with Akshay, @howesiang, and @cjx91704 . https://t.co/sZiPLVcO1i](https://pbs.twimg.com/media/G4McKnqWYAAibxg.jpg)


![AtandritaB's tweet photo. [1/2] Elated to receive the Best Poster Award at the 13th Asian and Oceanian Photochemistry Conference #APC2025. Thanks to all the organizers for bringing this inspiring event to life. It was wonderful to discuss the work with Akshay, @howesiang, and @cjx91704 . https://t.co/sZiPLVcO1i](https://pbs.twimg.com/media/G4McKnrW8AAY1HV.jpg)