

Top Tweets for #Informationvisualization

🔍 Read this #Article
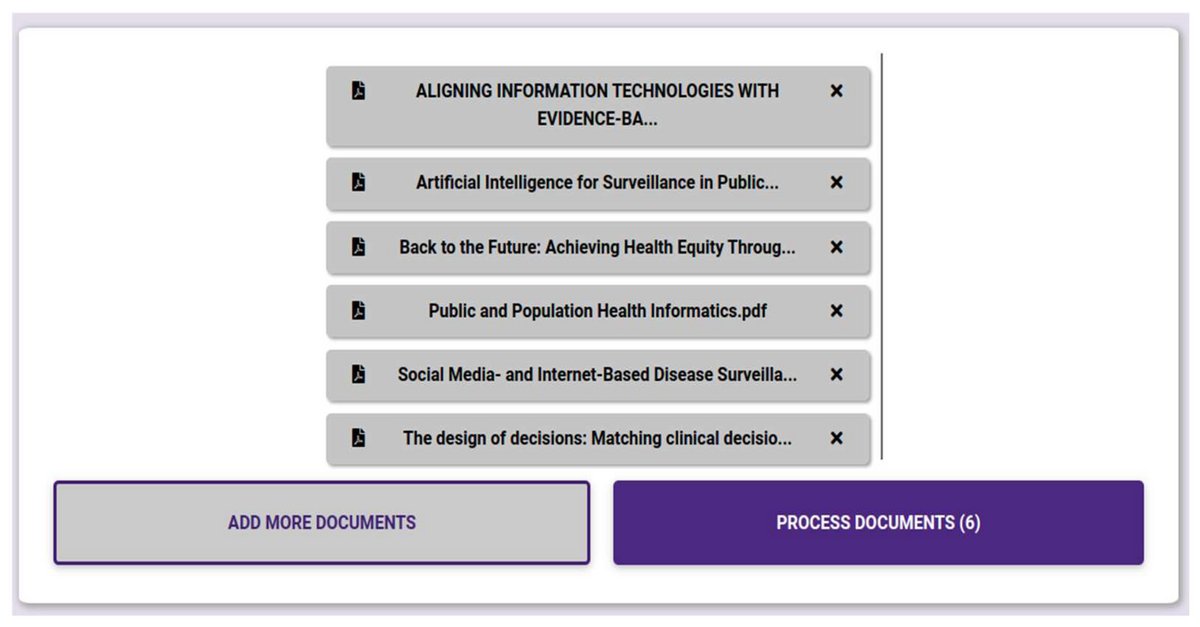
VICTORIOUS: A Visual Analytics System for Scoping Review of Document Sets
🔗 https://t.co/Z7jOBTk4Qm
#ResearchTools #VisualAnalytics #ScopingReview #OpenScience #AcademicResearch #InformationVisualization #DigitalScholarship #ResearchInnovation

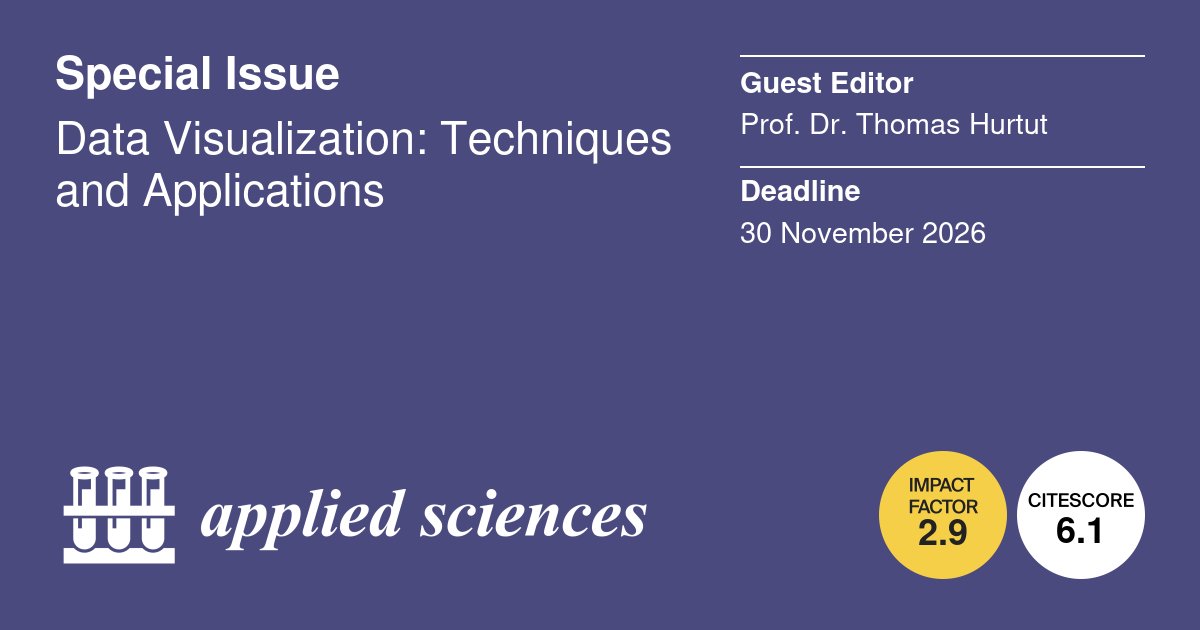
📢 #SpecialIssue
Data Visualization: Techniques and Applications
📅30 November 2026
👨🔬 Guest Editors:
Prof. Dr. Thomas Hurtut from Polytechnique Montréal, Canada
🔗https://t.co/HGj8OdQUHl
#informationvisualization #visualanalytics #scientificvisualization #data-drivendesign #high-dimensionaldata #human–computerinteraction #machinelearninginterpretability #geospatialvisualization #uncertaintyvisualization #perceptionandcognition

At #IV2025, the keynote, Prof. Dr. Jörn Kohlhammer shares how user-centred visual analytics integrates AI for impactful decision support
📍 Don’t miss this keynote at #IV2025
#InformationVisualization #VisualAnalytics #HumanCenteredAI

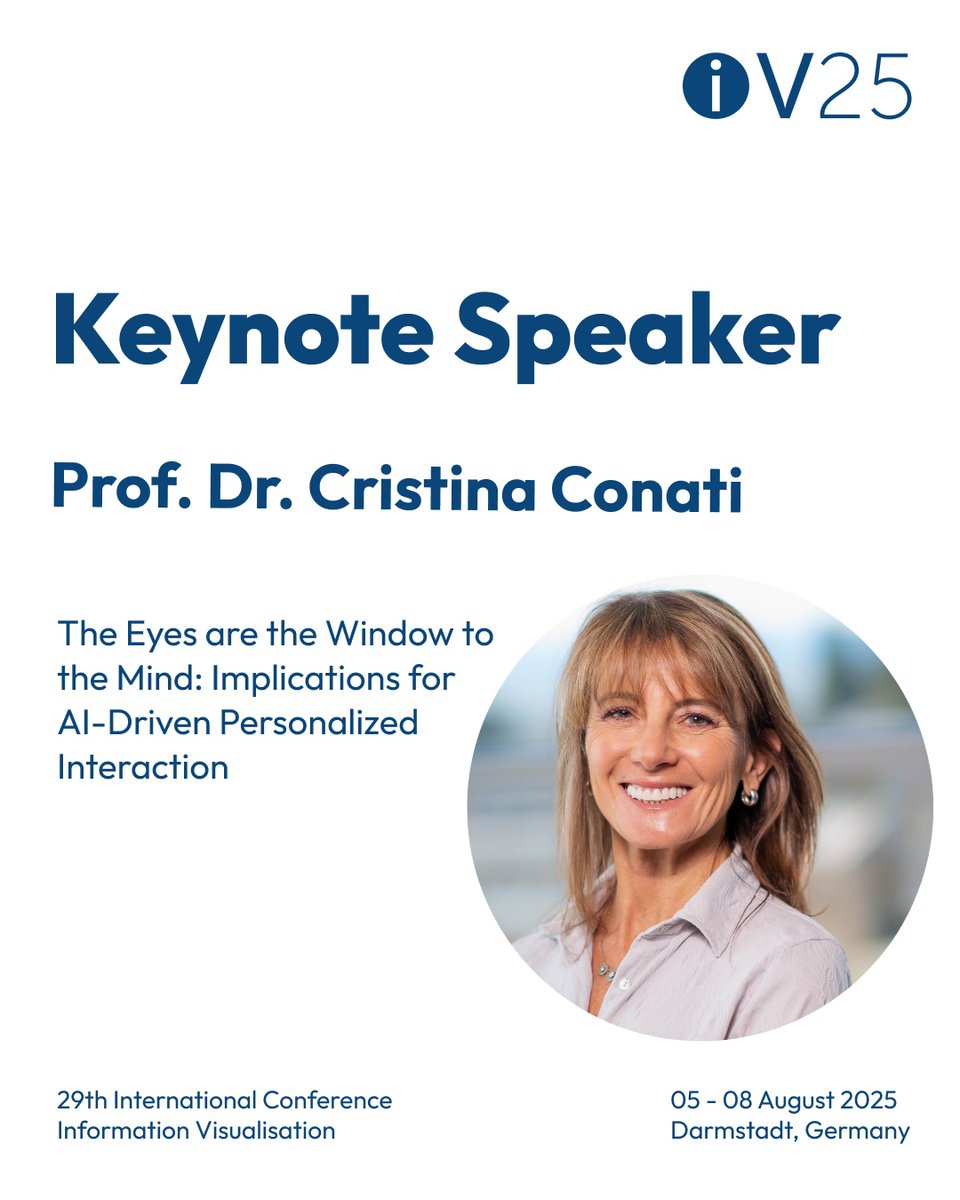
At IV2025, keynote speaker Dr. Cristina Conati (UBC) explores how eye-tracking can support human-centered AI.
Interested in attending? You can register on the conference website: https://t.co/uPUTxjcZqf
#IV2025 #InformationVisualization #HumanCenteredAI #AI

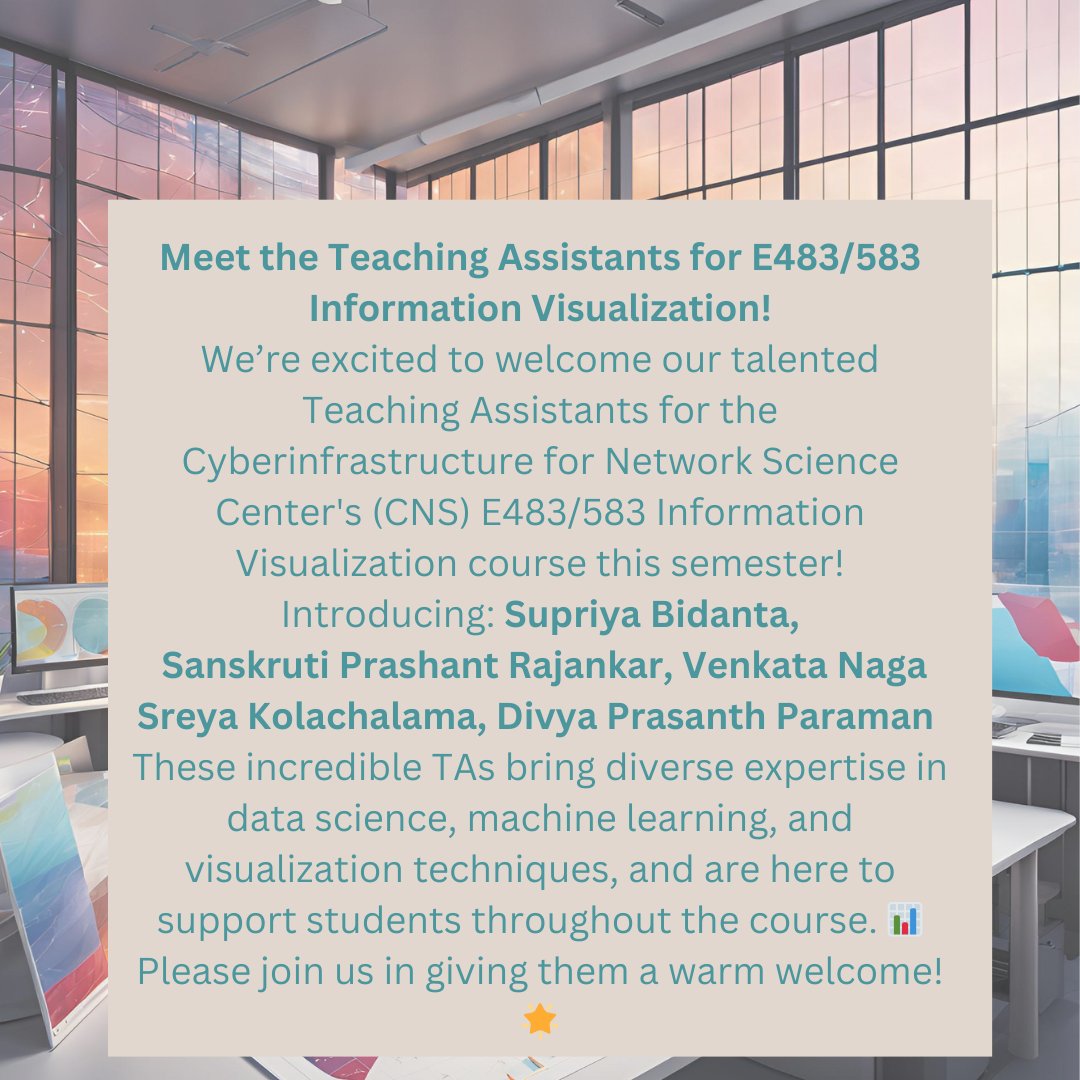
📢Meet the Teaching Assistants for E483/583: Supriya Bidanta, Sanskruti Prashant Rajankar, Venkata Naga Sreya Kolachalama, Divya Prasanth Paraman.Please join us in giving them a warm welcome! #Team #InformationVisualization #DataScience #TeachingExcellence @IULuddy @katycns

Participants needed for top-ranked study on SurveyCircle:
"Evaluation of prototype for visualized privacy information on YouTube" https://t.co/VmD2FNvJaV via @SurveyCircle #georgiatech
#ProductEvaluation #OnlinePrivacy #youtube #InformationVisualization #hci


Visualización de información y tecnología. Irrupción de la IA y avances en propuestas comerciales y de código. Un #ThinkEPI de @mperezmontoro
▶️ https://t.co/uw4hRDOtBD
#Informationvisualization #Visualcommunication #Datavisualization #Technology #Trends


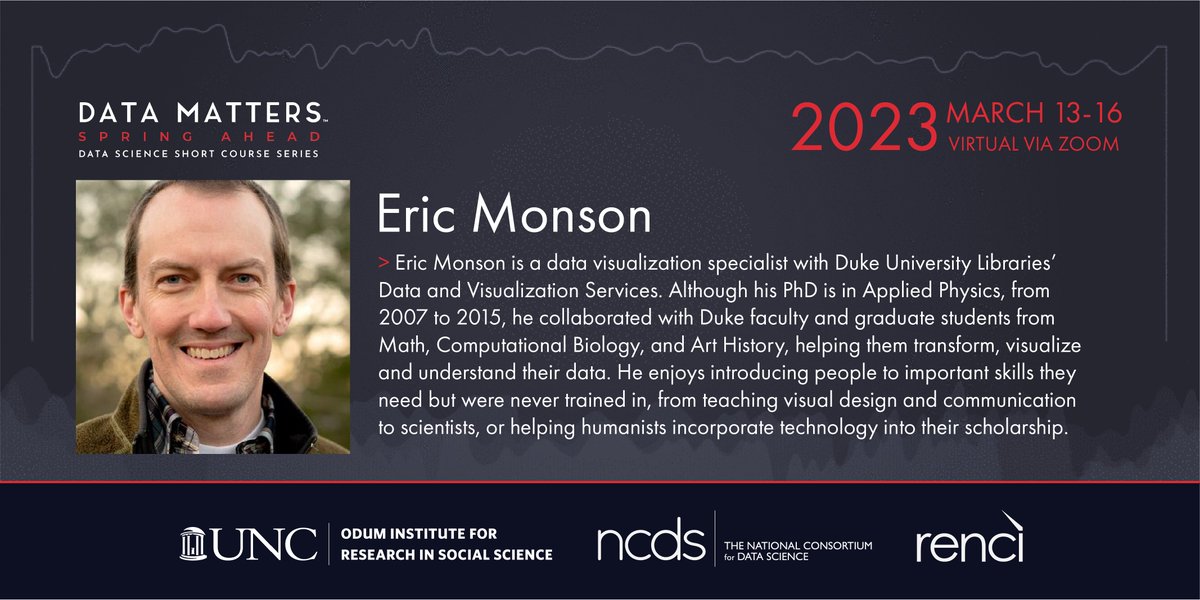
Taught by @ericemonson at @duke_data, #DataMatters course "Intro to Effective #InformationVisualization," will give students the chance to learn basic #visualization principles that allow them to create impactful figures. #infoviz #dataviz #rstats
https://t.co/eEFkcZ2VvZ
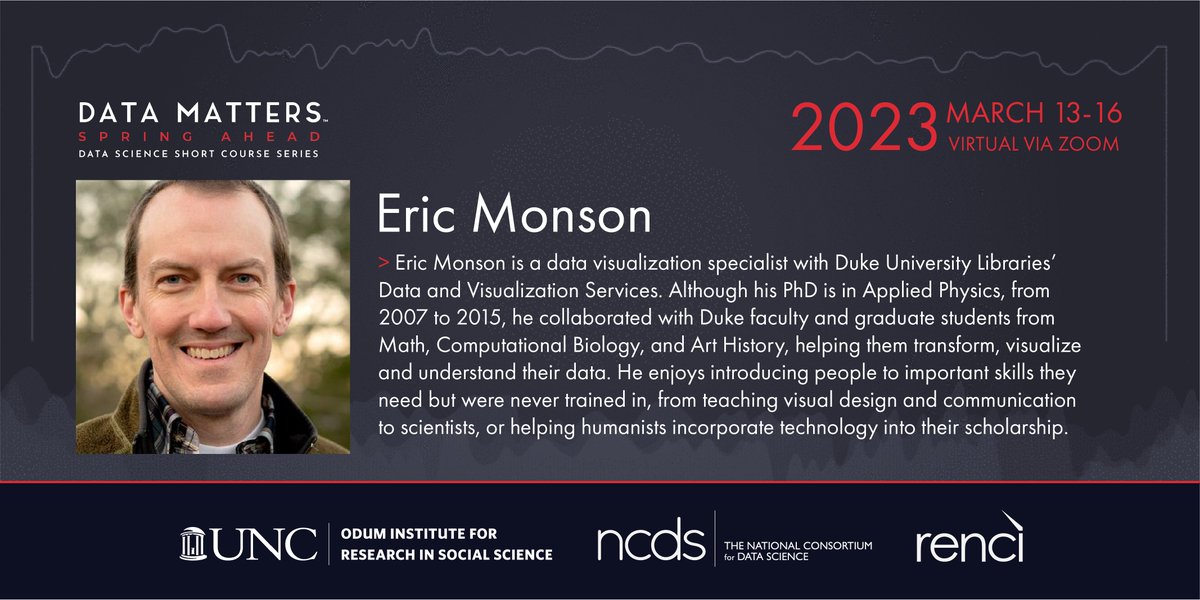

#DataMatters instructor @EricEMonson is a #dataviz specialist with @DukeLibraries' #Data + #Visualization Services. During our spring short-course series, he will teach the course “Introduction to Effective #InformationVisualization." @duke_data #infoviz
https://t.co/eEFkcZ2VvZ

How can I make information visualization accessible? Watch the video to learn from @LinkedScience from @AaltoOLE. #informationvisualization #visualization
Where can I find reliable data? Watch the video to learn from @LinkedScience from @AaltoOLE. #informationvisualization #visualization
Why do we need information visualization? Watch the video to learn from @LinkedScience from @AaltoOLE. #informationvisualization #visualization
What is information visualization? Watch the video to learn from @LinkedScience from @AaltoOLE. #informationvisualization #visualization
How does #information differ from #data and #knowledge? Watch the video to learn from @LinkedScience from @AaltoOLE. #informationvisualization #visualization

We're excited to host @LacePadilla of @ucmerced this week for our final #HCIISeminarSeries of the Fall semester. Join us!
🎙️"Making Uncertainty Cognitively Accessible"
📅Fri., Dec. 2
🕜1:30pm EST
📍NSH 1305 & livestream
🔗Details: https://t.co/0rw5I5OhzV
#InformationVisualization


I've been doing some research on the representation of sensor values on a circle, very common in speedometers and other gauges. Here are some of the ones I liked the most from my studies:
#datavisualization #informationvisualization #designer #design
#1 Vespa

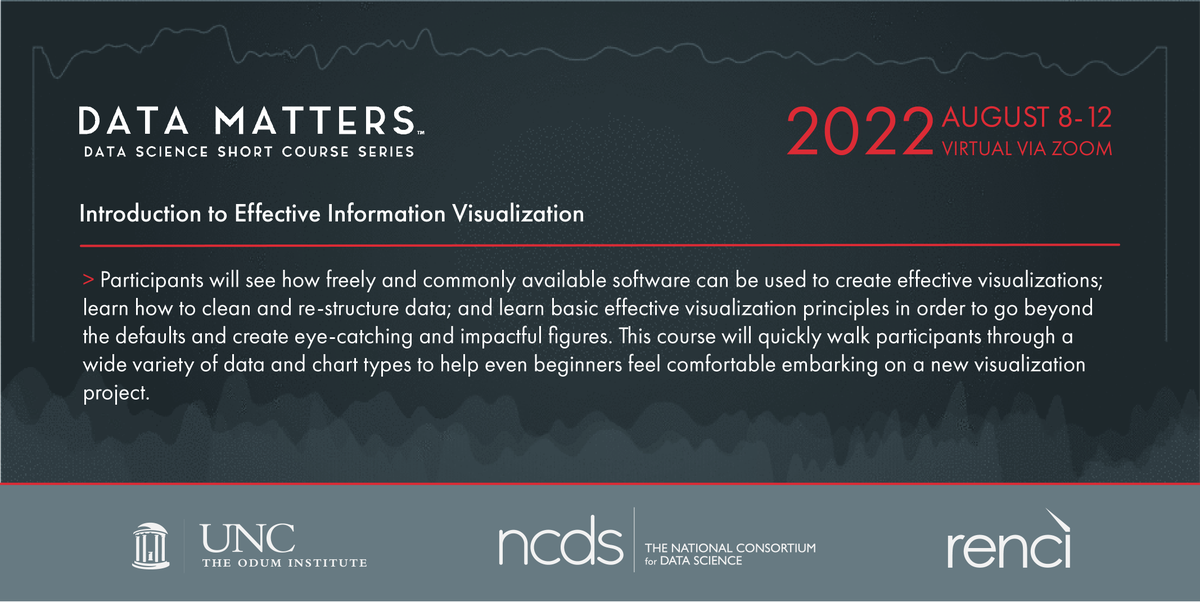
Taught by @ericemonson at @duke_data, #DataMatters course "Intro to Effective #InformationVisualization," will give students the chance to learn effective #infoviz principles that go beyond the defaults + allow them to create impactful figures. #dataviz
https://t.co/eEFkcZ2VvZ



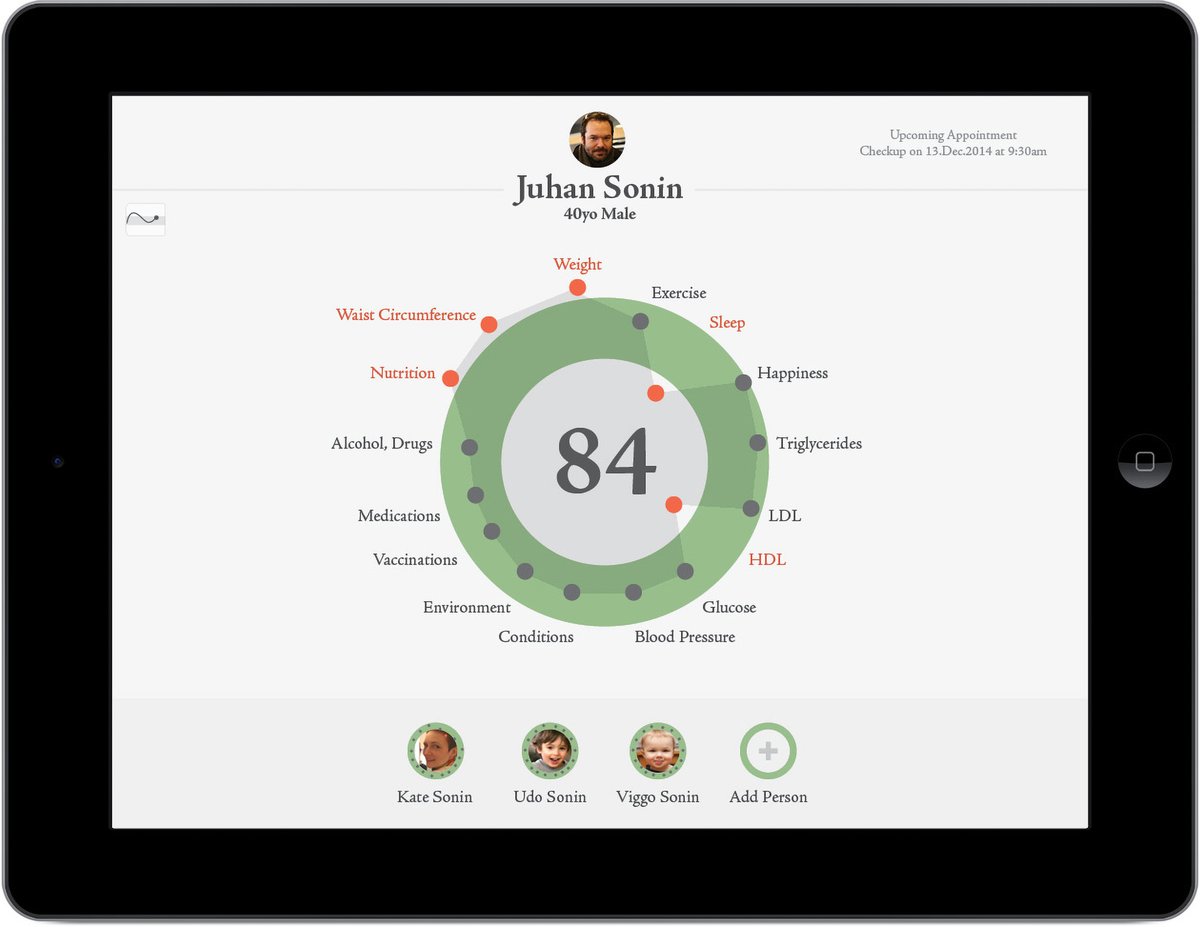
hGraph: your health in one picture
https://t.co/425GyyNKN8
#healthanalytics #digitalhealth #informationvisualization #healthcare #ux

Come & join us on 5 April at the online symposium UNFORESEEN PATHS#1 Transcending boundaries and sharing critical approaches to #ArchitecturalHeritage Info&register https://t.co/ZE0gowD1bl #InformationVisualization #MachineLearning #photogrammetry #SentimentAnalysis #SpaceSyntax


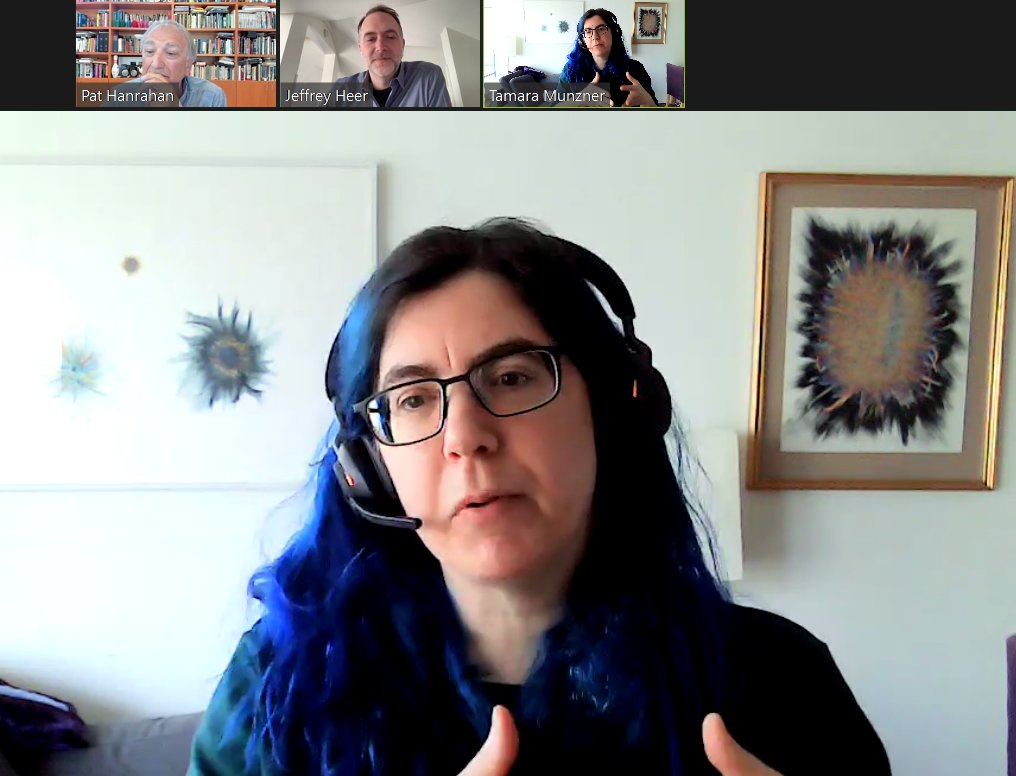
Tamara Munzner, Pat Hanrahan, and Jeff Heer in today's fireside chat-style #ACMTechTalk panel, "Visual Data Analysis: Why? When? How?"
Great tips on tools & ways of thinking about DataViz from 3 of the biggest names in the field.
#DataVisualization #InformationVisualization
Last Seen Hashtags on Sotwe
minichat filter:videos
Seen from Pakistan
個室サウナ
Seen from United States
石川澪
Seen from United States
fart #sfm
Seen from Malaysia
MommyMood
Seen from Pakistan
ควยพม่า
Seen from Thailand
Gold
Seen from United States
2d animation nsfw
Seen from Japan
bnwo migrants
Seen from United Kingdom
persian hotwife bbc
Seen from United States
Most Popular Users

Elon Musk 
@elonmusk
241.5M followers

Barack Obama
@barackobama
118.8M followers

Cristiano Ronaldo
@cristiano
114.6M followers

Donald J. Trump
@realdonaldtrump
111.8M followers

Narendra Modi
@narendramodi
107.1M followers

Rihanna
@rihanna
98.7M followers

NASA
@nasa
92.3M followers

Justin Bieber
@justinbieber
91.8M followers

KATY PERRY
@katyperry
90.1M followers

Taylor Swift
@taylorswift13
84M followers

Lady Gaga
@ladygaga
75.5M followers

Virat Kohli
@imvkohli
73.5M followers

Kim Kardashian
@kimkardashian
70.9M followers

YouTube
@youtube
68.8M followers

Neymar Jr
@neymarjr
66.5M followers

Bill Gates
@billgates
65.3M followers

Selena Gomez
@selenagomez
63.1M followers

The Ellen Show
@theellenshow
62.2M followers

CNN
@cnn
61.7M followers

X
@x
60.7M followers