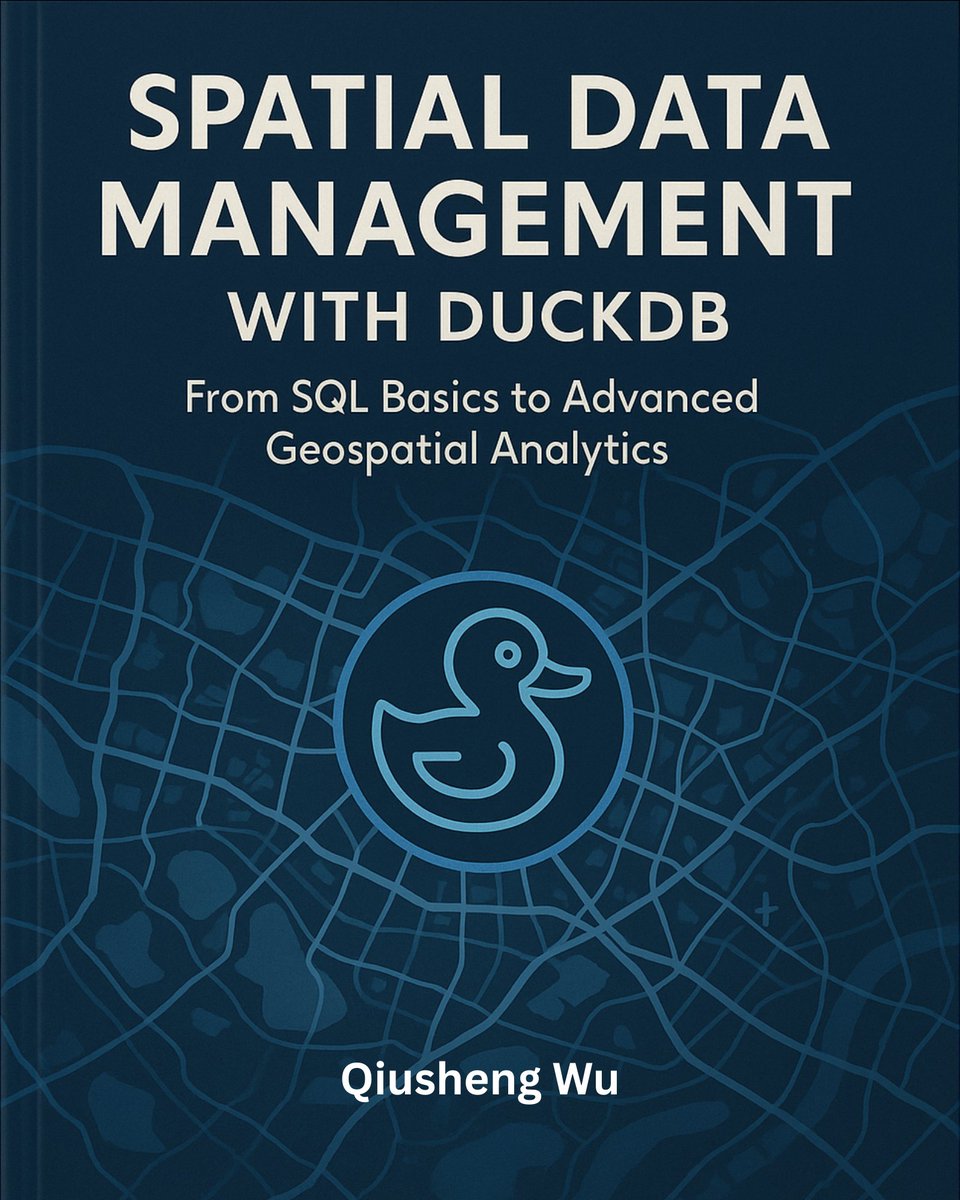
I’m thrilled to share that my new book (Spatial Data Management with DuckDB) is now published! 🎉
At 430 pages, this book provides a practical, hands-on guide to scalable geospatial analytics and visualization using DuckDB. All code examples are open-source and freely available on GitHub so you can follow along, adapt, and extend them.
Book website: https://t.co/PcrQNOdF53
GitHub repo: https://t.co/bovZybK0Yb
Table of Contents: https://t.co/ryTPGtS9Uj
The PDF edition of the book is available on @leanpub: https://t.co/2GKy9wXn4x
Full-color print edition will be available on Amazon soon. Stay tuned.
#geospatial #duckdb #python #leafmap #datascience
Working with environmental data often means searching through multiple sources and handling messy file formats.
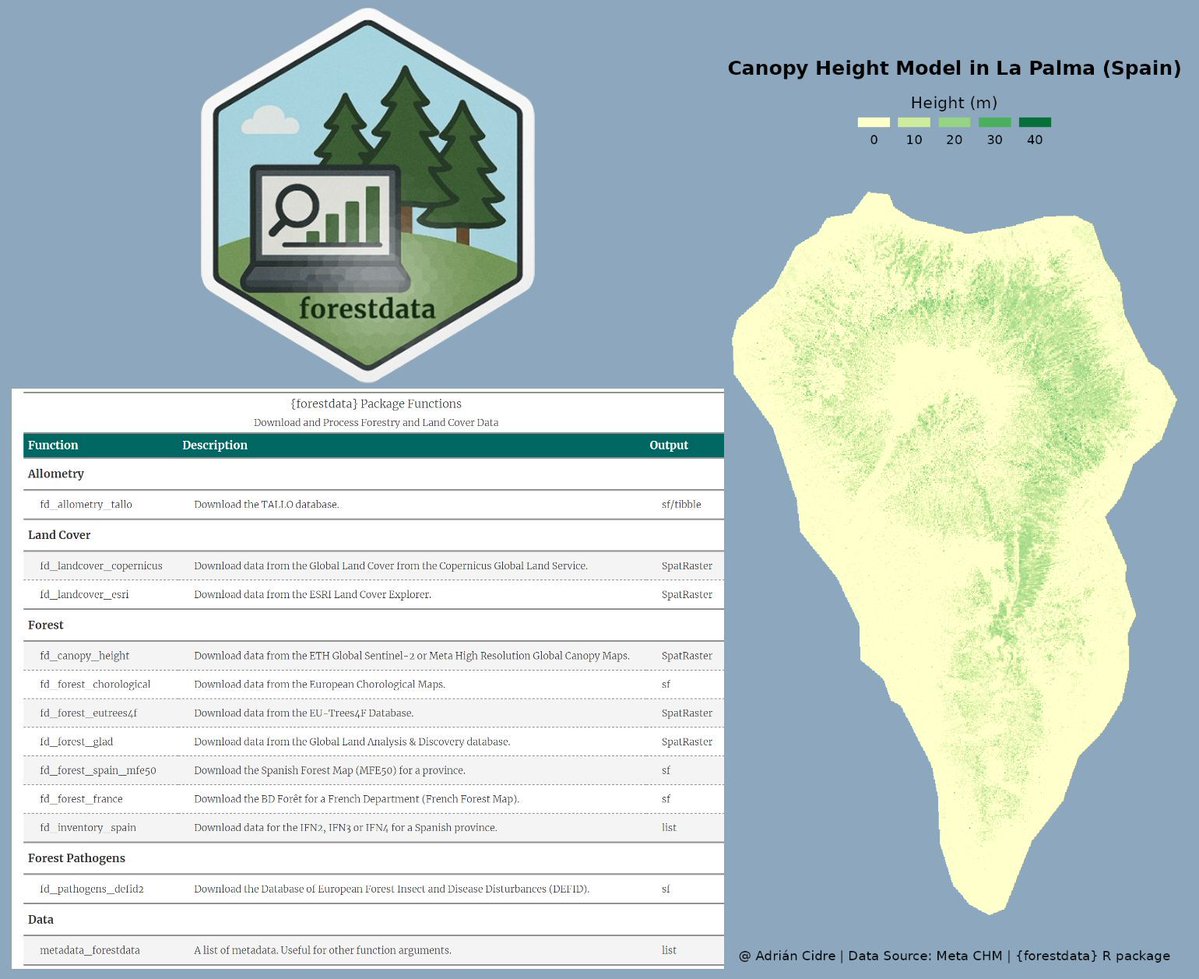
The forestdata R package solves this by bringing global forest, land-use, and canopy height datasets directly into R. It makes exploring large-scale ecological data much simpler and fully integrated into your workflow.
With forestdata you can:
🔹 Access global canopy height maps
🔹 Explore tree allometry and crown architecture databases
🔹 Work with forest inventories and land cover datasets
🔹 Load everything in tidy or spatial formats for analysis and visualization
This opens up new opportunities to study forests, land use, and environmental change, all within R. The visualization below shows an example created with the forestdata R package by Adrián Cidre González. You can find more details on the package website: https://t.co/0AwfK31QeZ
For more practical insights on R, Python, statistics, and data science, check out my newsletter. Click this link for detailed information: https://t.co/X93SeCe0rb
#RStats #programming #Rpackage #DataAnalytics #Data
Top 5 Most Used Python Packages for GIS in 2024! If you're diving into geospatial analysis, mapping, or data viz, these libraries are game-changers. Based on community usage and mentions across sources, here's my rundown. Let's boost your skills! 🧵
Using Python for #dataviz? 🐍
Here are 10 libraries you MUST know:
1️⃣ Matplotlib
The foundation. Most other libraries are built on it and share its syntax.
It can draw anything: from simple line plots to very complex & polished charts!
See https://t.co/sCU4unfXJY
🧵
QGIS Processing Toolbox tool for Variogram Modeling and Ordinary Kriging using GSTools
This tool automates variogram modeling and kriging within QGIS, providing a user-friendly interface for spatial interpolation.
#qgis#geostatistics#kriging
https://t.co/FpZgNuzZJ6
The {mapgl} #rstats package's new Story Map feature allows you to create immersive interactive experiences for viewers with the help of @Mapbox's 3D terrain.
Check out this example to get you started: a 3D tour of peaks in the Oregon Cascades!
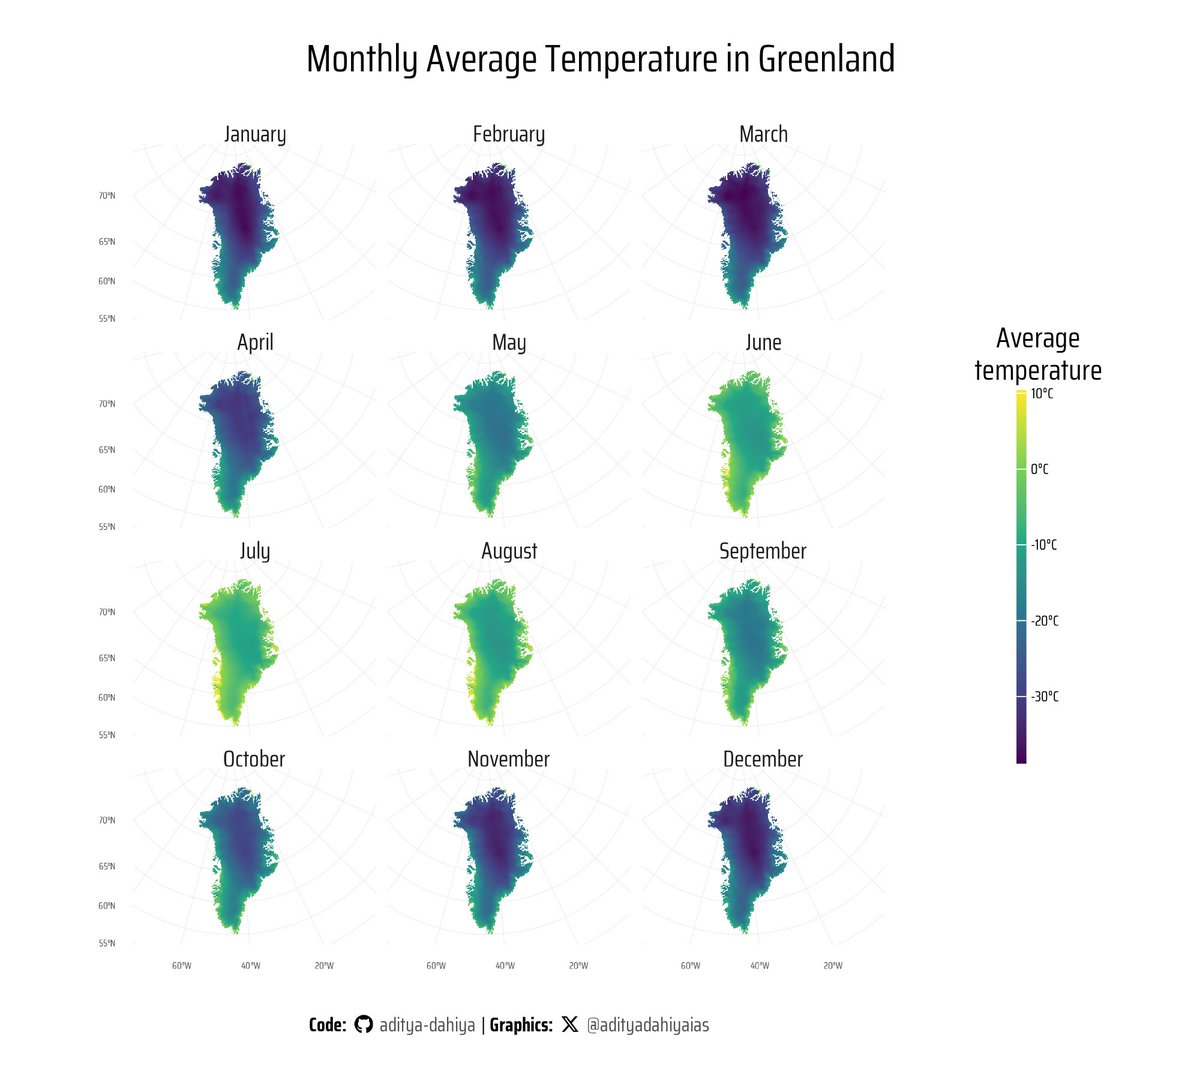
#raster#maps Code demonstration on using freely available climate data by https://t.co/sGrBJf9LZ1 with {geodata} in #rstats to fetch and plot monthly average temperatures for any region.
Full Code 🔗 https://t.co/liQjUZ1W6O
Tools #rstats#ggplot2#sf#terra with #geodata
📢 I'm teaching a Geographic Software Design course this semester at the University of Tennessee! 🎉 All course materials will be freely available online, with new video lectures dropping three times a week.
Join us to learn how to create open-source #Python packages for #geospatial 🌍 data analysis and visualization! 📊
🔗 Course Website: https://t.co/sgKUZM15sy
💻 GitHub Repository: https://t.co/kEQ3d3D8RA
🎥 YouTube Playlist: https://t.co/YDFnBoXBkW
📜 Enroll for Certification: https://t.co/knWNhoVG2T
Access all materials and videos for free, but if you want personalized feedback, graded assignments, and a certificate of completion, feel free to enroll anytime! The course is self-paced, so you can learn at your convenience. Let's dive into geospatial programming together! 🌍✨
All course materials (slides, readings, code, data)
for Introduction to Urban Science (MIT Press, also in Chinese) are now freely available on Github: https://t.co/tUzaDveRR5
Make them your own and keep in touch!
Happy 2025!
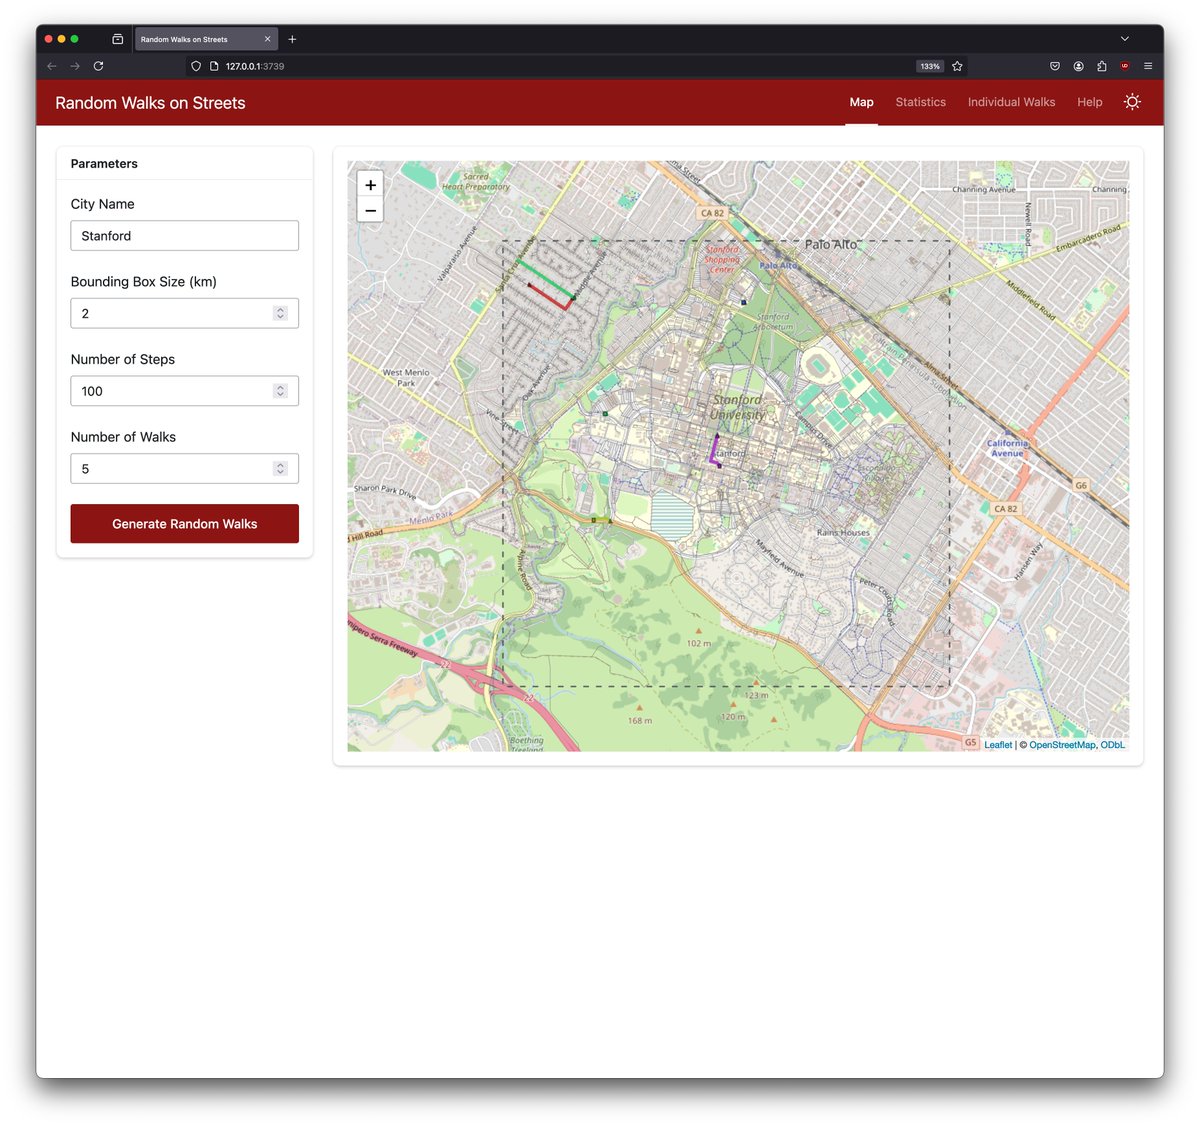
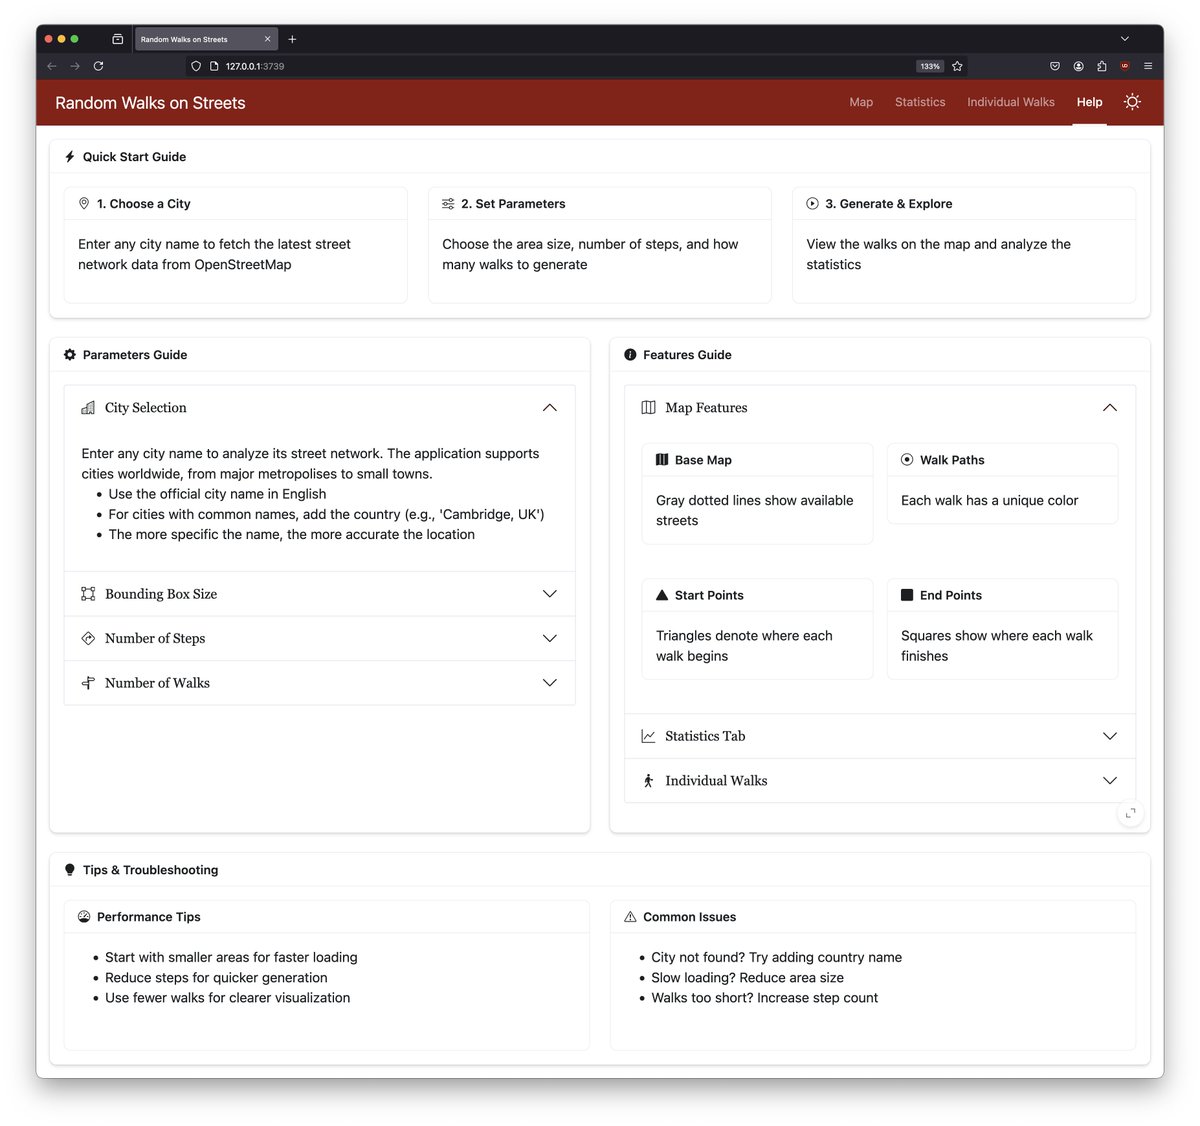
By request: Simulate random street walks 🚶♂️ in #rstats#shiny! Pick any city, set bounding box + walks to visualize paths via #OpenStreetMap 🗺️. (Note: paths may be problematic!)
💻 Code: https://t.co/F3BpsLIzf7
I've started making short videos where I walk through the Jupyter notebooks for Think Python.
Not sure yet what I'll do with them, maybe an online class.
For now, here are the first three: https://t.co/gO4rp2ZNDo
Btw I'll be teaching this year's course on reproductibility with R, Docker and Nix starting next Monday
it's up: https://t.co/cAsO8lcwB8
mostly unchanged from last year
Here is a new article by a team from
@unipotsdam@UFZ_de@idiv@UWaterloo led by @l_szangolies incl @CaraAGallagher where a standardised visual #ODD (vODD) is provided for a quick overview of #models with a link to the written model description. Check it out and use it! https://t.co/uNoygS7vja
BREAKING NEWS
The 2024 #NobelPrize in Literature is awarded to the South Korean author Han Kang “for her intense poetic prose that confronts historical traumas and exposes the fragility of human life.”
🙈 It's 11 PM. I'm trying to explain my sister in law why I'm so excited:
I managed to run a little R shiny app INSIDE a quarto report rendered _statically_ using Github:
https://t.co/okFHrCwEC9
🎉
Now she believes I'm a weirdo 🙂