Keeping up with @arxiv is impossible. 500+ preprints a day across dozens of fields.
@KurateOrg scores papers on 16 dimensions (impact, novelty, rigor, surprise, translational...) so you can spot what's worth reading at a glance. Sort, filter & sign up for the weekly newsletter.
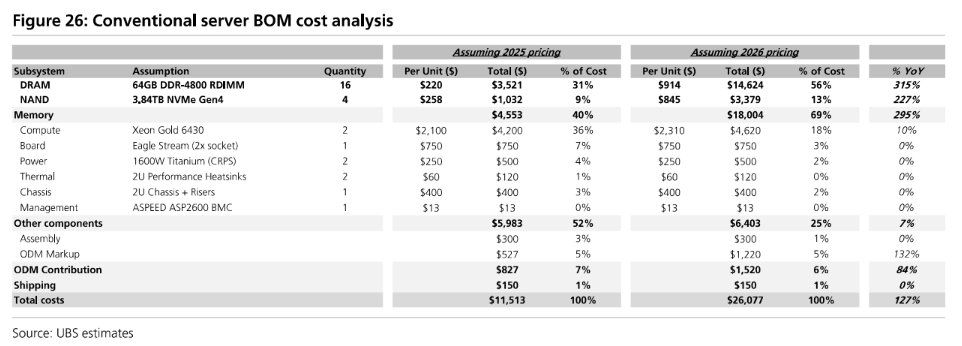
Memory is no longer a supporting cost in servers. It is becoming the dominant one.
UBS data shows the shift clearly.
In a standard data center server configured with 16 × 64 GB DRAM and 3.84 TB NAND, memory’s share of the bill of materials has risen from about 40% in 2025 to roughly 69% under 2026 pricing.
DRAM alone is up 315% year over year and now accounts for 56% of the total cost.
$NVDA
Overall server costs are projected to climb 127%, from $11.5k to $26.1k, driven almost entirely by higher DDR and NAND prices.
The change is even sharper in AI systems.
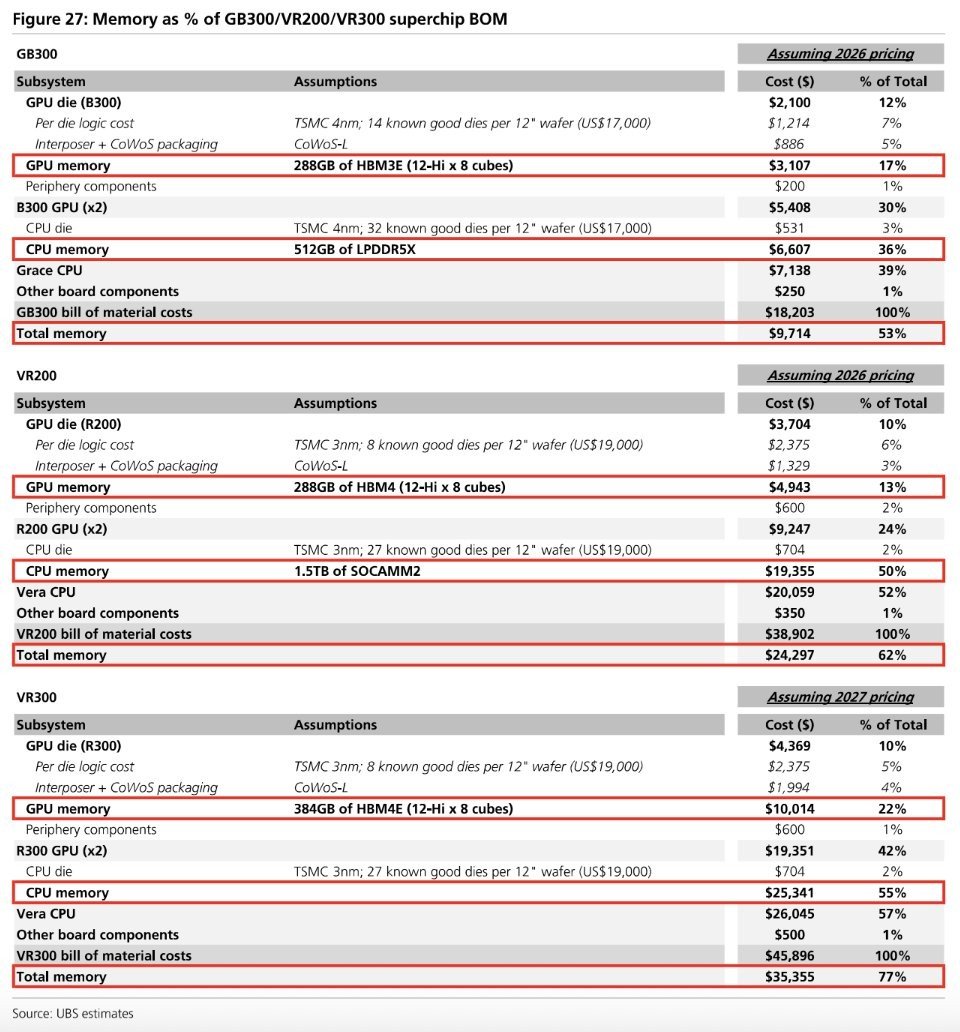
For GB300 in 2026, HBM3E plus LPDDR5X runs about $9.7k per superchip, or 53–58% of the BOM. That translates to roughly $350k of memory cost per rack.
On the VR200 (2026–27), HBM4 plus SOCAMM2 pushes the memory share to 62–70% of cost. Rack-level memory spend rises from $875k to $1.14 million.
By the VR300 in 2027, denser HBM4E could take memory to 77% of the superchip BOM and around $1.27 million per rack.
Across the lineup, total memory spend is expected to clear $1 million per Vera Rubin rack, with the memory share continuing to climb from an already high 58% toward 77%.
This is a structural change. The GPU is no longer the clear majority of the system cost.
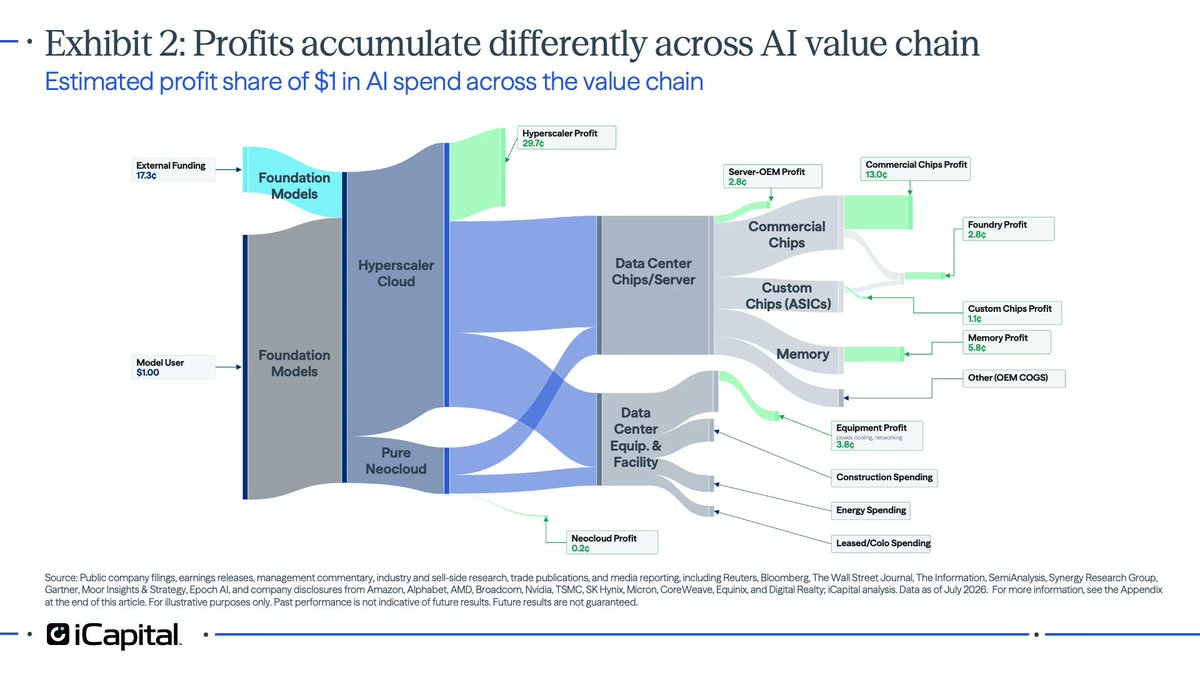
Memory suppliers are positioned to capture a larger share of the value as AI infrastructure scales.
How sustainable do you see this level of memory intensity remaining as system architectures evolve?
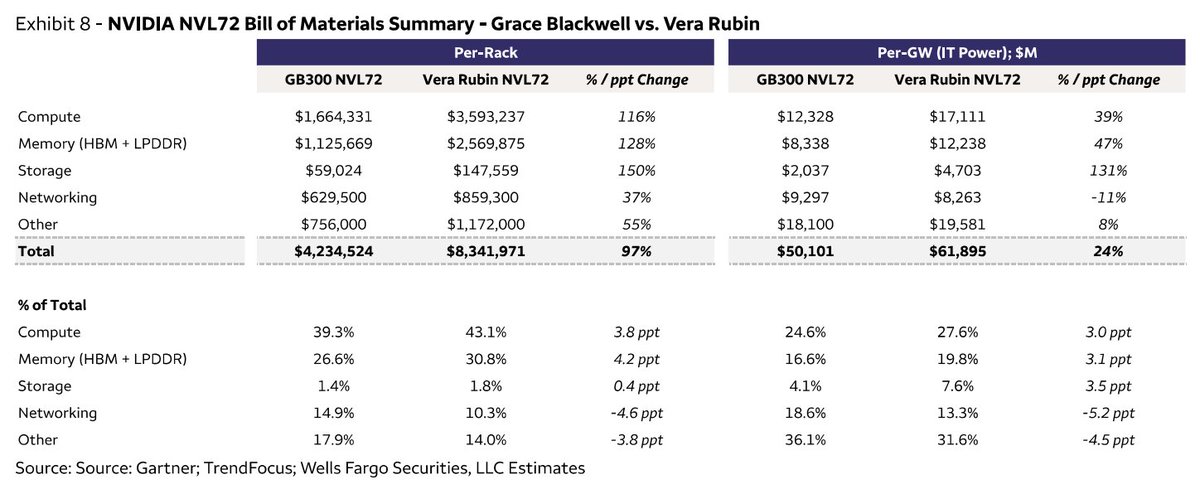
Wells Fargo: Nvidia NVL72 Bill of Materials
Overall Cost Comparison
> Per-Rack Total: The Vera Rubin NVL72 is estimated at $8,341,971, representing a 97% increase ($4,234,524 total change) compared to the GB300 NVL72 ($4,234,524).
> Per-GW (IT Power) Total: Scales to $61,895M for Vera Rubin compared to $50,101M for GB300, a 24% increase.
Cost Breakdown by Category (Per-Rack)
> Compute: Renders the largest absolute dollar growth, jumping from $1,664,331 to $3,593,237 (116% increase). It forms 39.3% of the total cost for GB300 and increases to 43.1% for Vera Rubin.
> Memory (HBM + LPDDR): Experiences a 128% surge, rising from $1,125,669 to $2,569,875, and increases its share of total cost from 26.6% to 30.8%.
> Storage: Shows the highest percentage growth at 150%, moving from $59,024 to $147,559.
> Networking: Sees a modest 37% increase per rack (from $629,500 to $859,300). However, measured on a Per-GW basis, networking costs drop by 11% (from $9,297M down to $8,263M).
$NVDA
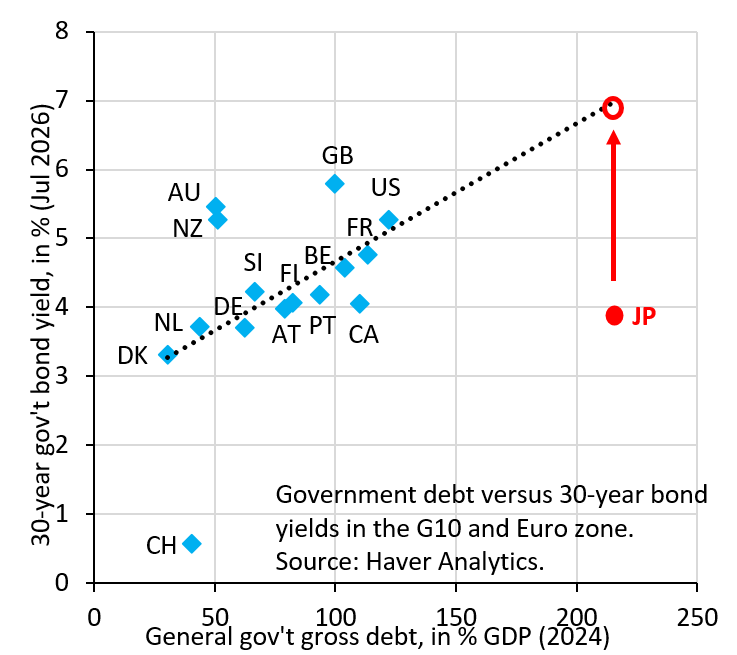
Big thanks to @KellyCNBC for having me on @CNBC to talk about Japan's latest interventions to buoy the Yen. They'll be just as unsuccessful as past attempts because the underlying issue is that JGB yields are way too low. Interventions can't fix that...
https://t.co/hJPKidM6Kx
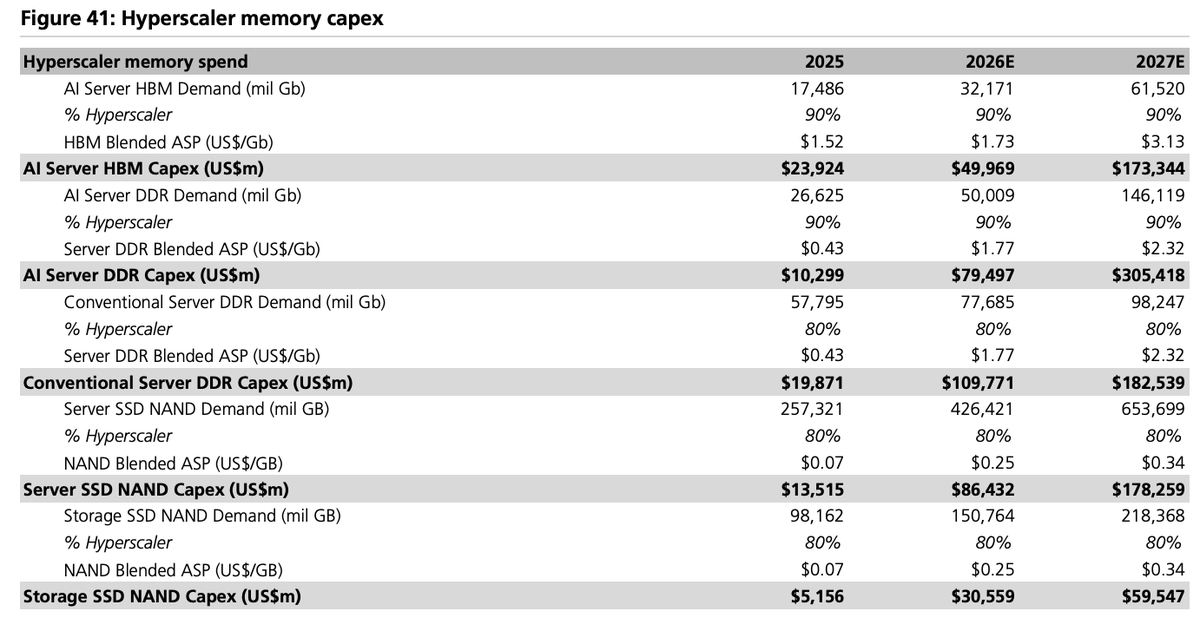
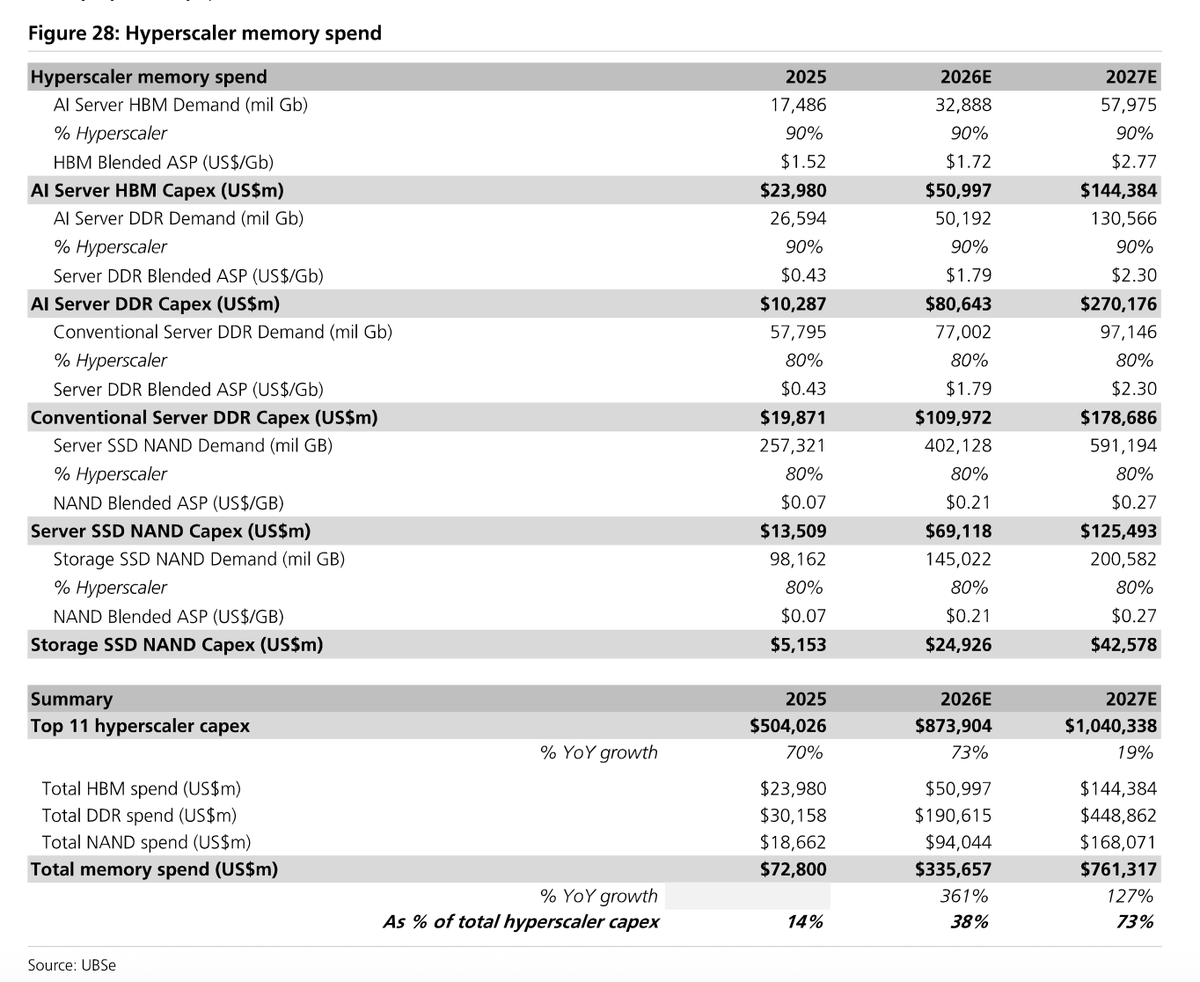
Breakdown of the memory spend for hyperscalers. UBS projects DDR spend of $190.6 billion in 2026 and then $448.9 billion in 2027, an increase of ~135%. Total memory spend to increase by 127% in 2027.
$MU $DRAM $EWY
Jensen Huang: "no HBM for you, I need HBM!"
Overall Market & Demand Growth
> Massive Expansion: Total HBM demand is projected to scale dramatically, reaching over 6 million k GB (approx. 48,618 mn Gb) by 2027.
> Rapid Multi-Year Trajectory: Historical and projected growth shows a steep upward curve from 2023 through 2027, driven heavily by increasing deployment in AI GPUs and AI ASICs.
NVIDIA's Market Dominance
> Leading Consumer: NVIDIA remains the single largest consumer of HBM supply, commanding the largest share of the demand stack in 2027.
> Key Products: High-demand products like the Rubin R200 stand out with massive total HBM demand (projected at over $1.7 million k GB), utilizing advanced HBM4 12hi configurations.
> CoWoS Allocation: NVIDIA dominates advanced packaging allocations, notably with massive wafer distributions for products like the Vera CPU and Rubin series.
Key Competitors and Ecosystem Players
> Google: Google represents a massive portion of the AI ASIC HBM demand, particularly driven by TPU lines such as the TPU v8i (Sunfish), which demands over 1.1 million k GB of HBM.
> AMD: Competes strongly with advanced offerings like the MI455 and MI350 series, utilizing HBM3e and HBM4 configurations sourced primarily through Samsung and Micron.
> Cloud Service Providers (ASICs): Other major tech giants like AWS (Trainium 3) and Microsoft (Maia 300) account for significant shares of the total specialized hardware demand footprint.
> NVIDIA holds the largest single share of projected HBM consumption at 36%.
> Google represents a massive segment of demand at 35%, nearly matching NVIDIA due to its heavy reliance on custom TPU deployments.
> AMD follows as the third-largest consumer with 16% of the market share.
> AWS accounts for 5%, GUC's customers make up 3%, while Microsoft and Meta each take 2% of the projected 2027 consumption.
$NVDA $META $MSFT $AMD $GOOGL $MU $DRAM $EWY
DRAM has overtaken SoC as the most expensive component in premium smartphone bill of materials.
Counterpoint Research shared a chart showing DRAM reaching a 25% cost share by the third quarter of 2026.
Combined memory, including DRAM and NAND, accounts for 43% of component costs, up sharply from earlier periods. SoC share drops to 24% in the projection.
This reflects the sharp rise in memory prices driven by AI demand and supply tightness. It puts increasing cost pressure on smartphone makers while benefiting memory suppliers.
The shift underscores how memory is becoming a larger part of the overall semiconductor value chain in high-end devices.
How much do you expect this DRAM cost dominance in premium phones to influence pricing strategies and margins for handset makers in the second half of 2026?
Market makers just closed a 3rd straight session
with a position < $1B of SPX gamma
the 6th time since July 2024.
Every prior time, the S&P closed 5%+ away from the trigger inside a month.
Median biggest move: 8.9% (vs a normal month of 3.6%)
(short thread)
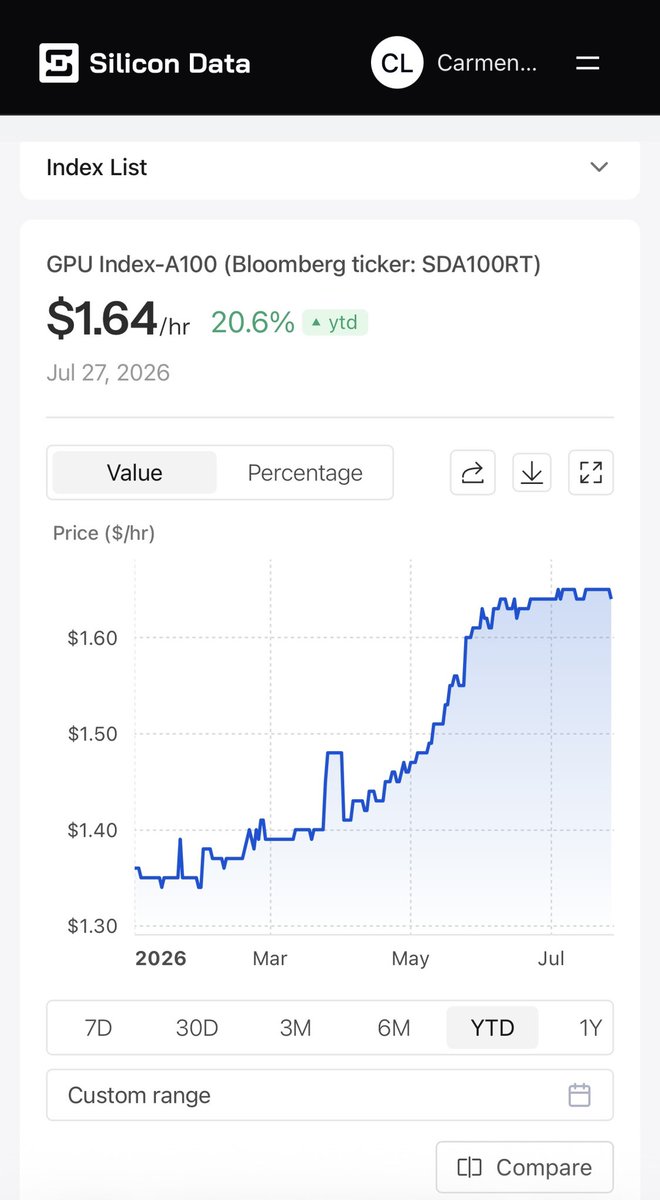
We’ve seen 15%–30% price increases year-to-date across our A100, H100, H200, and B200 neocloud on-demand indices. Every day, we ingest 170,000+ observations from hundreds of data sources worldwide to provide an independent view of the compute market.
Bernstein: Global Memory
End-Market Revenue Breakdown (DRAM & NAND)
> For DRAM, US CSPs make up 15-20% of revenue, HBM accounts for 15-20%, Smartphones represent 20-25%, Other CSP & Enterprise Servers take 10-15%, China CSPs account for 10%, PCs make up 5-10%, and Others comprise 15-20%.
> For NAND, US CSPs dominate with 25-30% of revenue, Other CSP & Enterprise Servers account for 20-25%, Smartphones and PCs each represent roughly 15%, China CSPs account for 10-15%, and Others make up about 10%.
Memory Supplier Consensus Revenue
> Total memory supplier consensus revenue is estimated at US$0.9T for CY2026, expanding to US$1.3T in CY2027 and US$1.3T in CY2028.
> The revenue is distributed across major players including Samsung Memory, SK hynix, Micron, SanDisk, KIOXIA, CXMT, and YMTC.
> Deals like the Micron-Anthropic agreement highlight how memory demand is sometimes secured via equity stakes, representing a form of vendor financing.
LTA Walk-Away Mathematical Dynamics
> Even though the protection provided by financial guarantees grows stronger as Remaining Performance Obligations (RPOs) shrink over time, falling memory market prices can still trigger customers to walk away from Long-Term Agreements (LTAs).
> A customer is mathematically incentivized to break an LTA if the remaining volume multiplied by the difference between the contract floor price (or market price remaining) and the current market price exceeds the remaining financial guarantees.
> As supply catches up and market ASP drops below the "walk-away price" threshold, market conditions can arise where customers find it beneficial to back out of their LTAs.
$MU $SNDK $DRAM $EWY