https://t.co/plBbADaZCA now has weather on courses for races, easy custom formulas on timeline charts, lots of other stuff in the news update! #cycling#running https://t.co/S8a0ooj6lr
@asynkronxyz We did try with some filters to flip the whole site, but that broke the Vuetify components in weird ways. We are now on newer Vuetify so will give it another try.
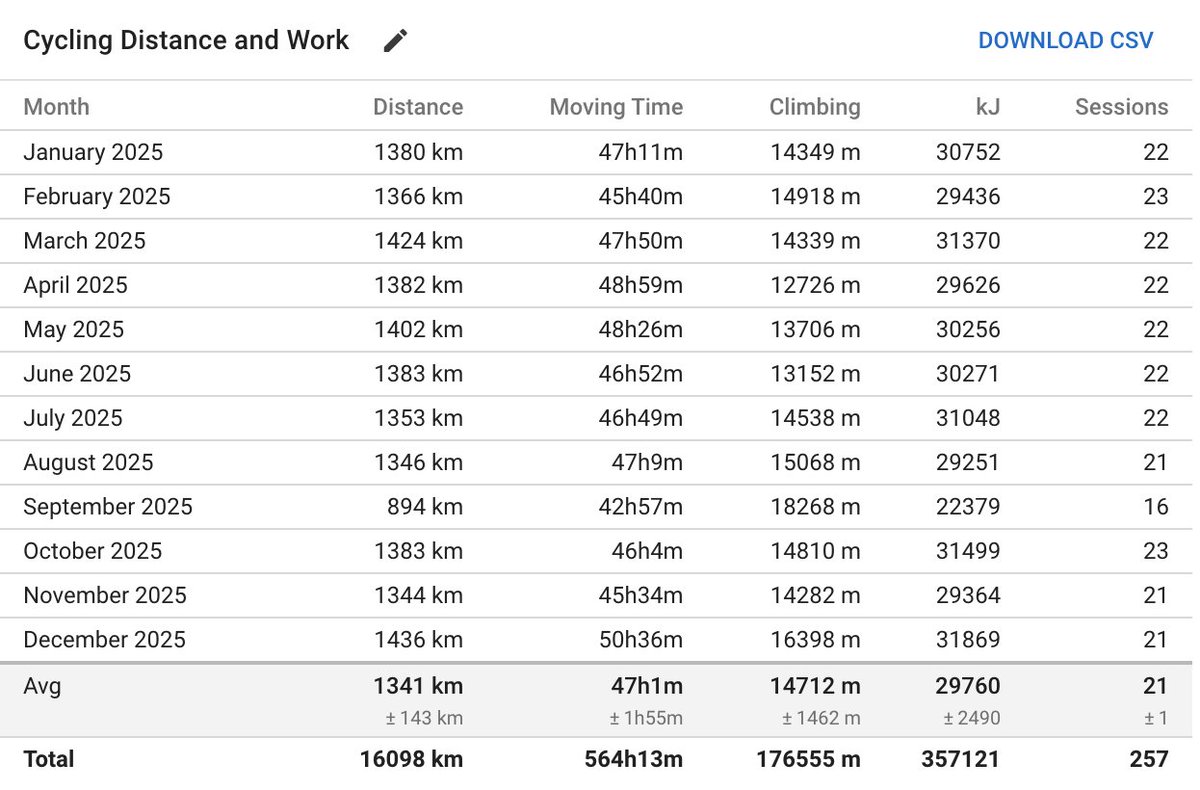
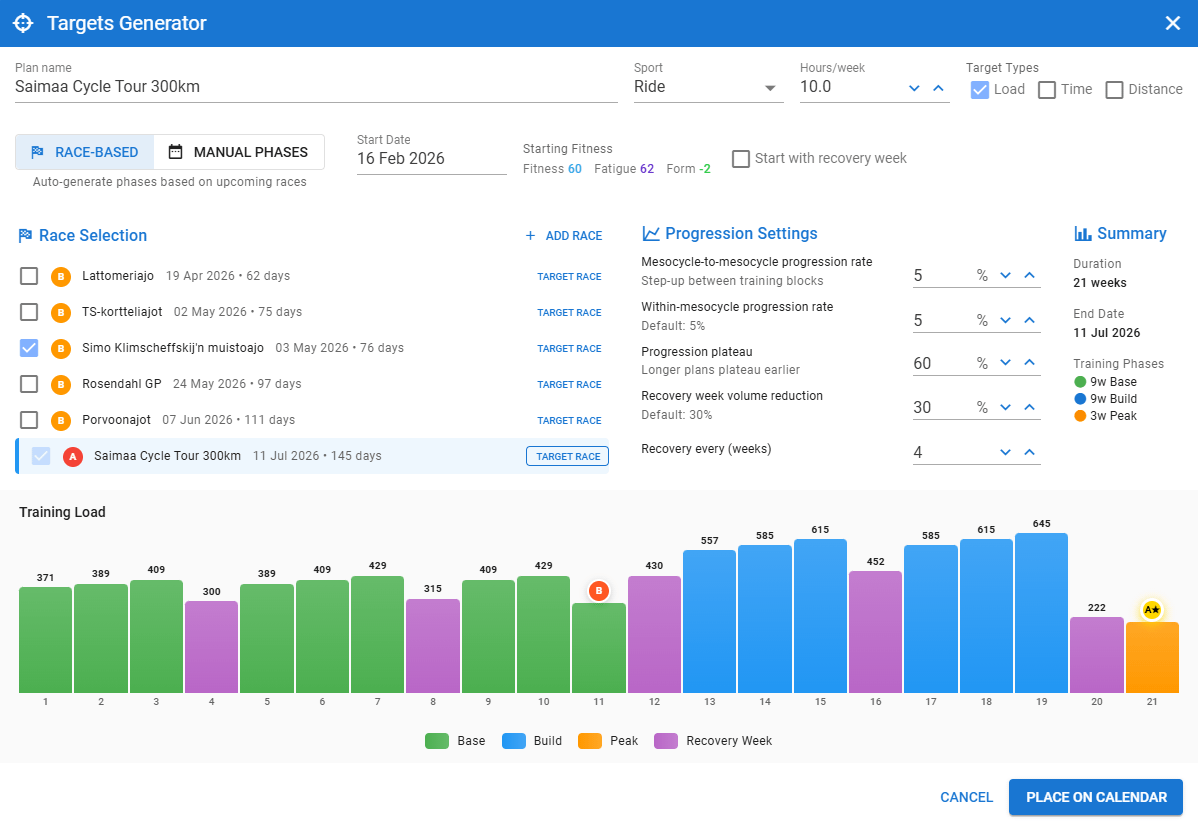
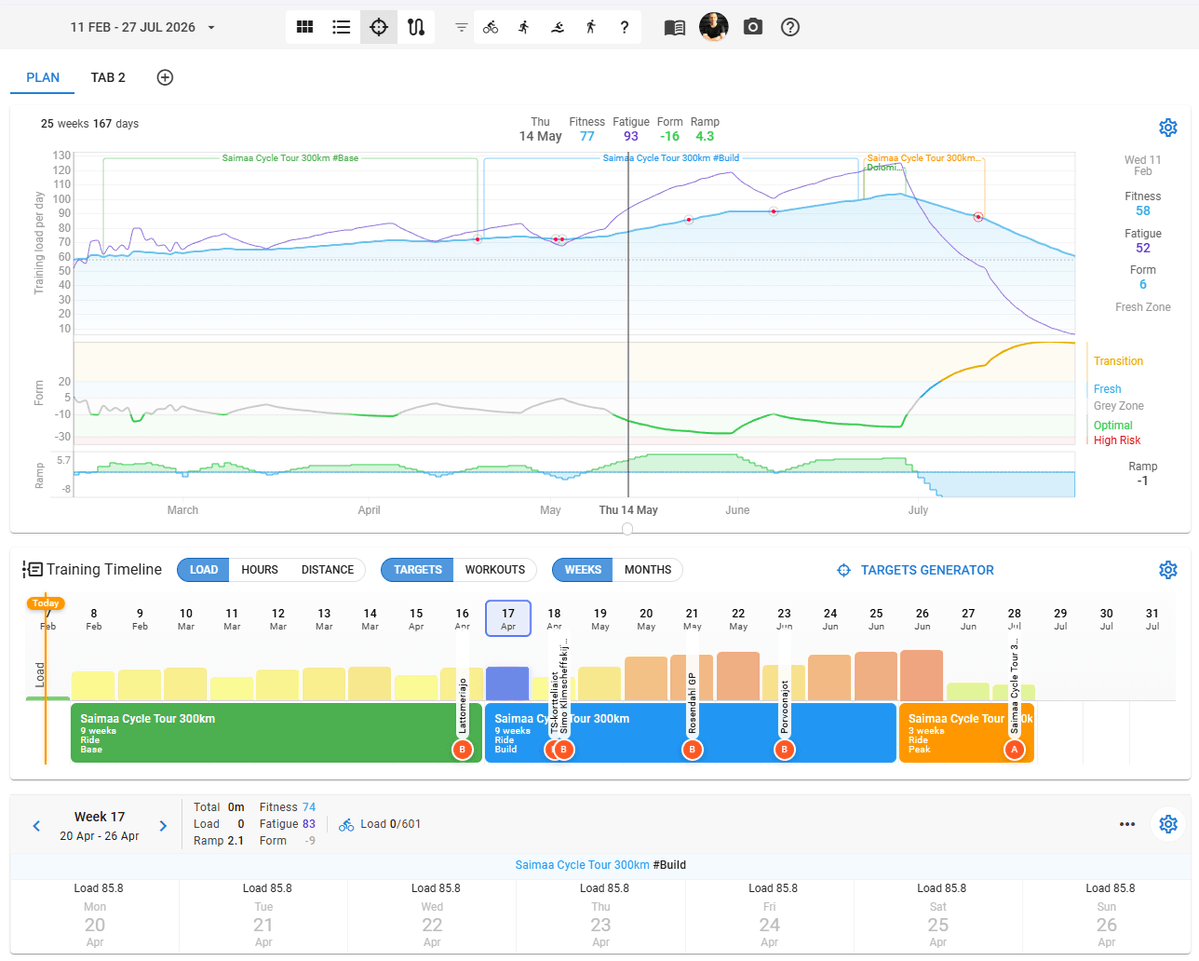
The https://t.co/EPUcHwaUdm news update is out and its packed with goodies: Annual training plan builder, totals tables, events listing, easy to use formulas and more https://t.co/awWnzpaUva #cycling#running
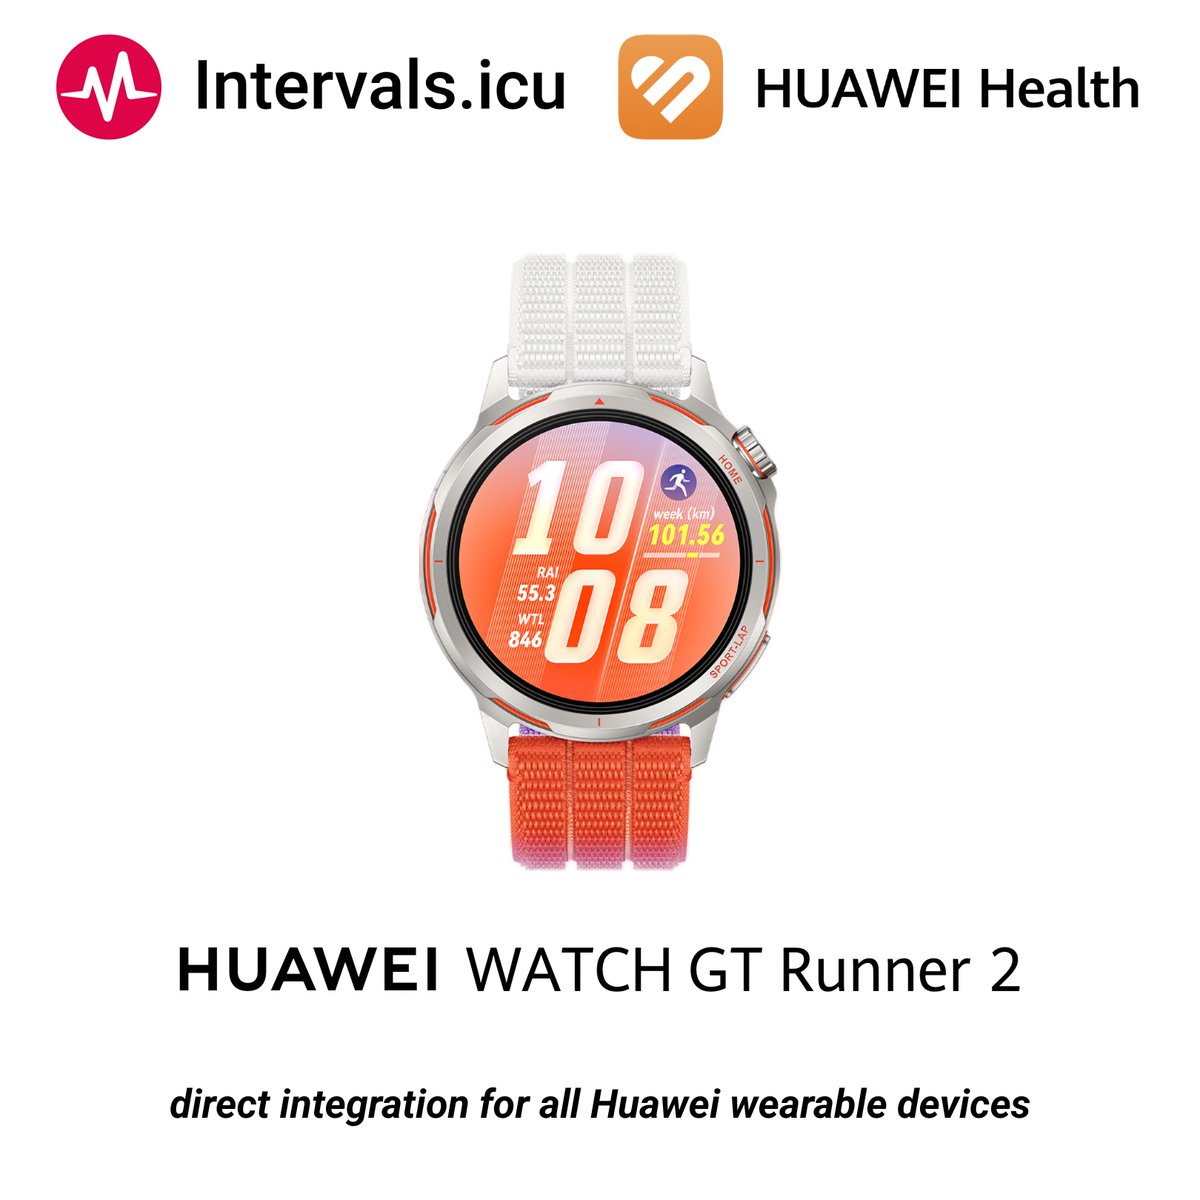
https://t.co/plBbADaZCA now has direct integration for all Huawei wearable devices including the new HUAWEI WATCH GT Runner 2! #runner https://t.co/X3vqhyU6PA
Podcast is up! with the stellar @david_tinker on his work and passion developing @intervalsicu
We talk cycling, fitness, dev-ops, and all the cool aspects of intervals https://t.co/eeyzw8VC7z
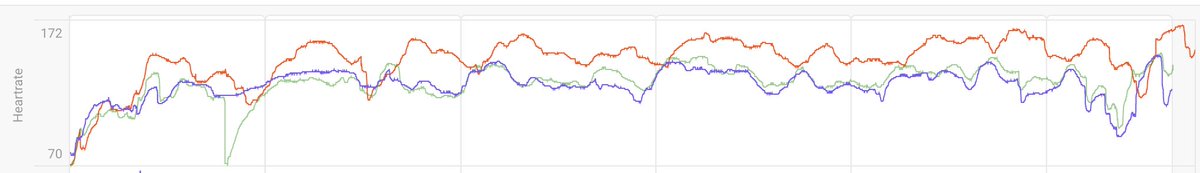
The after effects of man-flu. Usual easy 55min trail loop with the dog. Same pace and soggy conditions. HR ~15bpm higher!! Still got some recovering to do before thninking about any tempo or hard efforts :( @intervalsicu compare.
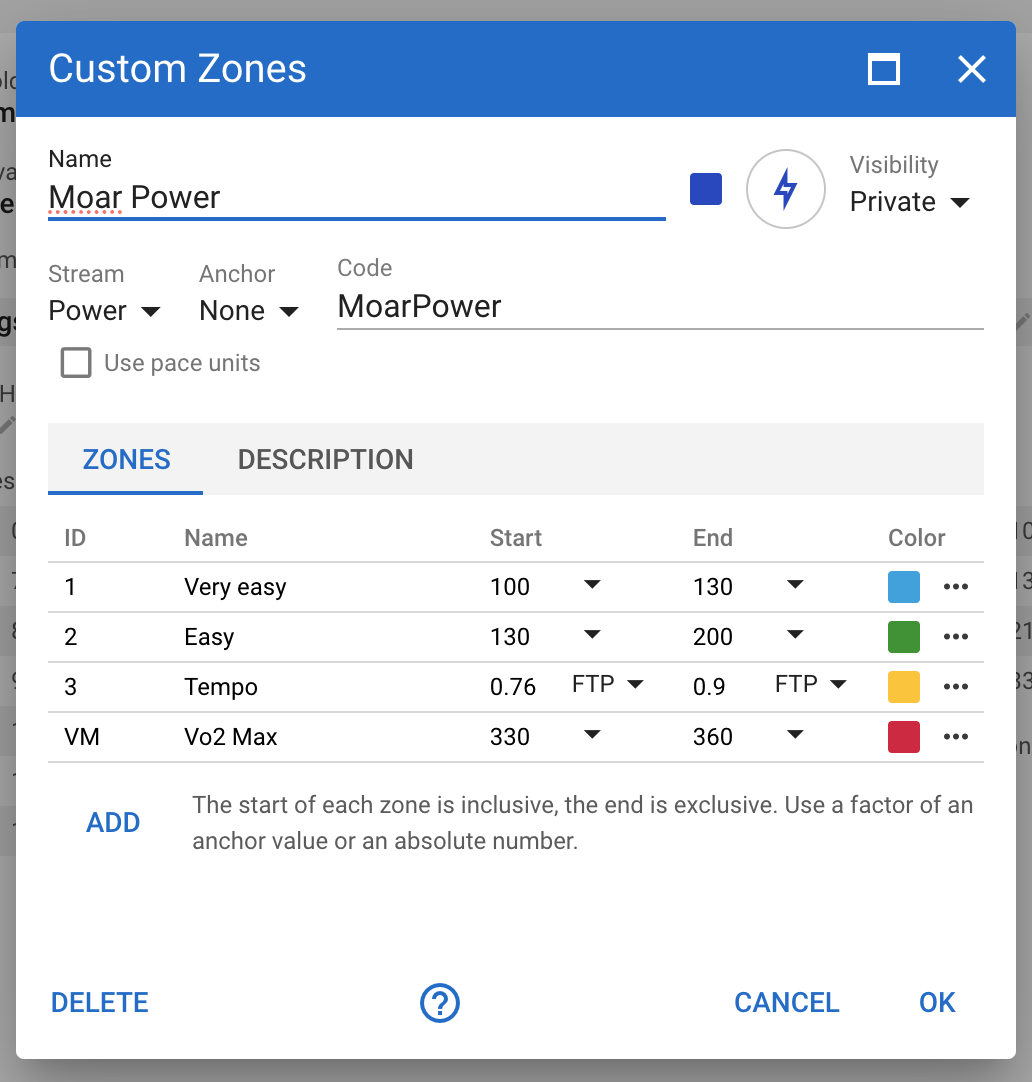
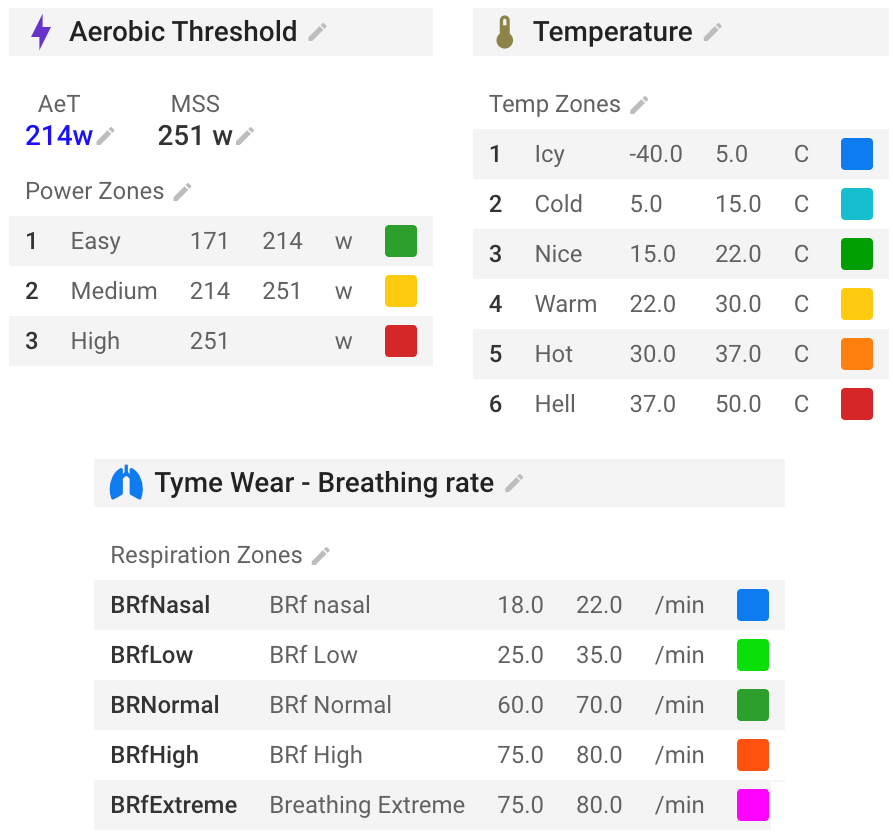
https://t.co/plBbADbxs8 now has very flexible custom training zones for time in zones and workout prescription. Use any activity stream (not just power, HR, pace), any anchors (FTP, LTHR, custom fields) and absolute values #cycling#running
@Anton_Karlssson Those charts are built from very cleaned up second-by second data, not average data for the whole ride. Bad data is tossed out, HR lag accounted for etc.
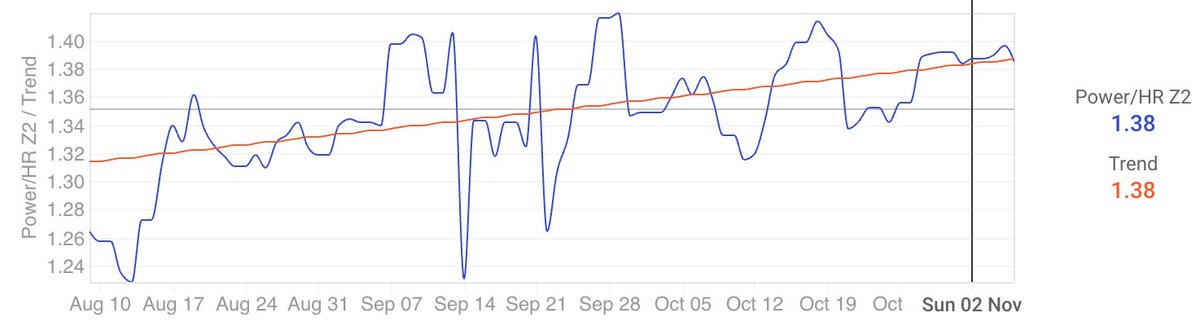
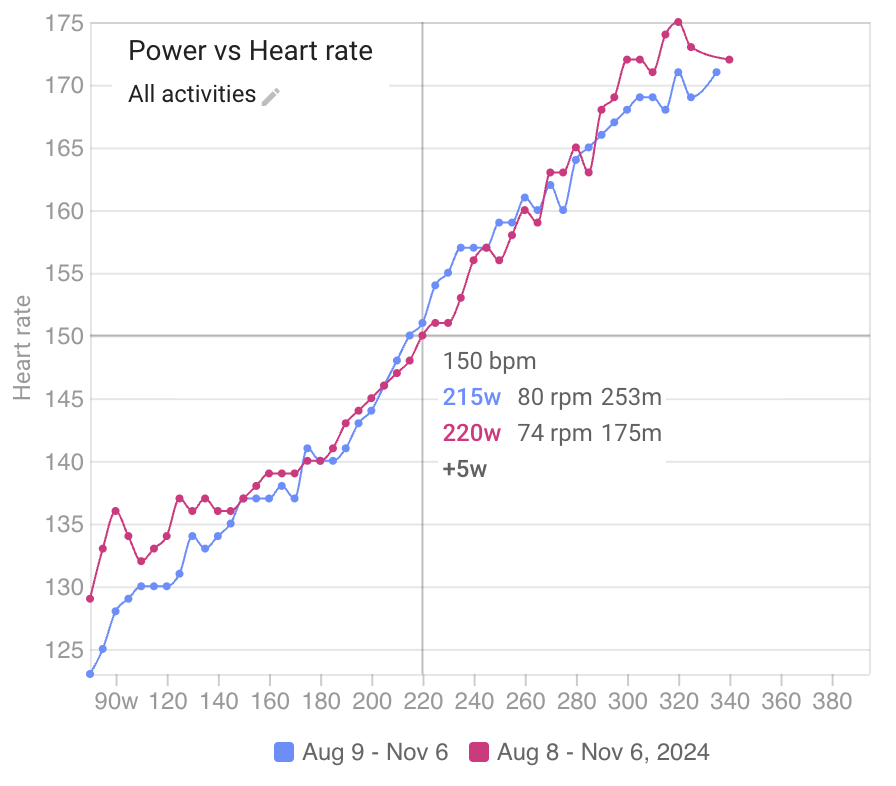
@Anton_Karlssson Yes several. The /compare page can plot your power vs HR curve for different time periods. Further right = fitter. You can also plot watts/bpm in Z2 on /fitness page. Trending higher = fitter
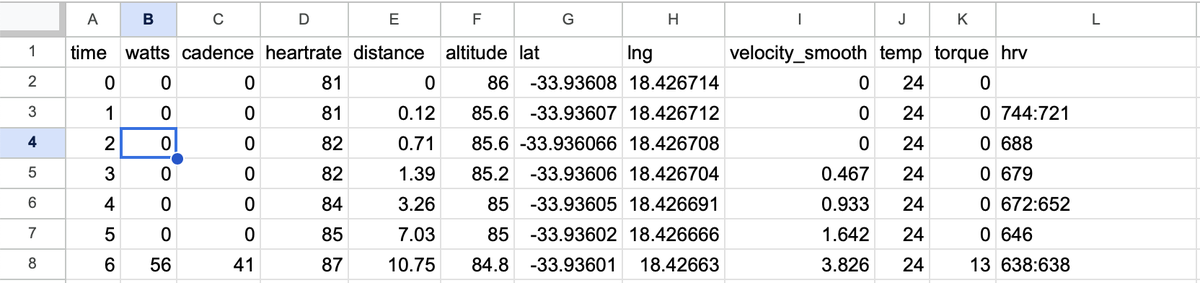
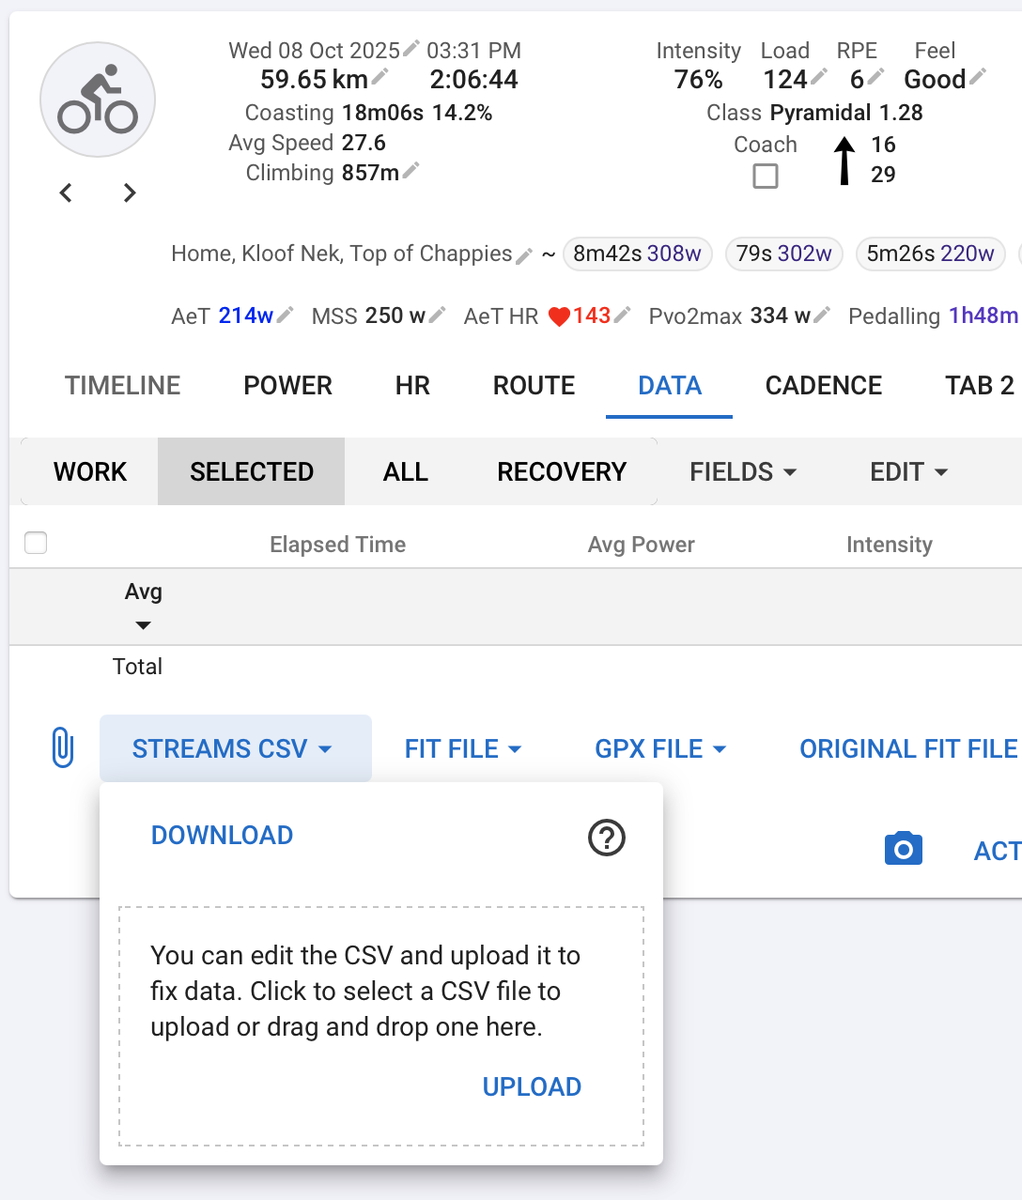
You can now download and upload activity stream data (power, heart rate, custom streams etc.) in https://t.co/plBbADaZCA to edit or analyse data, add custom data to an activity etc. #cycling#running https://t.co/bQNFIaM6Fa