Neocloud’s mounting debt and the negative free cash flow of most CSPs have led capital markets to begin to worry about endless high-level AI investments. U.S. data center construction reviews may become stricter after the election, and CSPs will bear higher electricity costs, potentially sacrificing or delaying some AI deployments. TrendForce believes that if capital expenditures continue to be unable to be quickly recovered by AI profits, financial operations that exceed income may gradually reflect the narrative of “slowing AI growth” from the funding side to physical orders.
For more: https://t.co/5OJjTmC7z0
BofA strategist who correctly recommended shorting 𝐁𝐢𝐠 𝐓𝐞𝐜𝐡 𝐃𝐞𝐛𝐭 last year, now says yields make it attractive
_/ Big tech companies have gone on a borrowing spree to fund their #AI ambitions. Now yields (6%- 8%) on tech Bonds look attractive.
https://t.co/DjkWtYbiXj
Global Market Outlook | Standard Chartered
_/ We now favor a more balanced stance between stocks and bonds.
_/ US and Asia remain our preferred regions.
_/ Higher bond yields are increasingly attractive income opportunities.
_/ We remain Overweight Gold.
https://t.co/wDEsR6HjQQ
Goldman Sachs: Japan Semiconductors / Electronic Components
→ GS describes the current cycle as one of the largest and longest in history, with 2027 expectations strengthening and visibility into 2028 improving. Yet sector valuations have compressed to ~17x FY27 and ~14x FY28 earnings as investors increasingly price in the risk of a post-2028 capex slowdown.
→ Disco (6146): Contract liabilities (primarily customer advances) surged 46% QoQ to ¥73bn, suggesting accelerating order momentum that isn't captured in reported bookings. GS expects advanced packaging, EMIB-T, hybrid bonding and CPO to drive further shipment growth.
→ Capacity rather than demand is increasingly the constraint. Tokyo Seimitsu (7729) has orders running at ~1.5x production capacity, with meaningful expansion constrained until 2028. GS argues that the key differentiator is increasingly suppliers' ability to convert strong orders into revenue and margin expansion, beyond demand exposure alone.
중국 CXMT의 기술 흐름에 대해서 정리해보았습니다.
1. EUV는 기술의 벽이라기보다 원가를 낮춰 주는 장비에 가깝습니다.
2. DUV로도 같은 층을 두세 번 나눠 찍으면 미세한 회로를 만들 수 있습니다.
3. 대신 공정 단계가 늘어나 수율이 떨어지고 원가가 올라갑니다.
4. 중국 CXMT가 바로 이 방식으로 DUV만 써서 D램을 만듭니다.
5. CXMT의 비트당 원가는 삼성, SK하이닉스, 마이크론보다 30% 이상 비싼 것으로 추정됩니다.
6. 평소라면 이 원가 차이 때문에 팔수록 손해가 나는 구조입니다.
7. 그런데 올해 1분기 범용 D램 고정거래가격이 한 분기 만에 거의 두 배가 됐습니다.
8. 가격이 이만큼 오르면 원가가 30% 비싸도 충분히 이익이 남습니다.
9. CXMT는 2023년 약 190억 위안 적자에서 올해 1분기에만 약 248억 위안 순이익으로 돌아섰습니다.
10. 7월에는 상장으로 약 580억 위안을 더 끌어모았습니다.
11. 그 돈이 들어간 결과가 지난주 상하이 컨퍼런스에서 나왔습니다.
12. CXMT는 4F² 구조로 만든 서버용 DDR5 모듈을 연말까지 내놓겠다고 밝혔습니다.
13. 4F²는 셀 하나가 차지하는 면적을 지금 주류인 6F²보다 약 3분의 1 줄이는 구조입니다.
14. 회로 선폭을 더 좁히지 않고도 같은 면적에 더 많은 데이터를 담을 수 있습니다.
15. EUV로 선을 더 가늘게 못 그리니 셀 구조를 바꿔서 밀도를 올리는 길을 택한 셈입니다.
16. 삼성은 4F² 양산 목표를 2028년으로 잡고 있습니다.
17. 발표 일정만 보면 CXMT가 삼성보다 약 2년 빠릅니다.
18. 다만 한국 업계는 첫 제품에 일부만 적용하는 수준이고 대량 양산은 별개라고 봅니다.
19. EUV 수출 통제는 중국을 막는 벽이 아니라 원가를 올리는 장치였고, 지금의 메모리 가격은 그 원가 부담까지 덮어주고 있습니다.
Everyone is focused on how much money is being spent on AI but I think WHERE that money is going matters a lot more.
This chart breaks down how every $100 of AI infrastructure spending could flow across the supply chain, and I think it does a great job explaining why there are so many opportunities outside of the obvious AI names. Roughly $50 goes toward semiconductors, including GPUs, memory, CPUs, and other chips. $NVDA and $AMD are obvious beneficiaries, but look at how much money is going toward memory. Companies like $MU, Samsung, and SK Hynix are extremely important because AI accelerators require enormous amounts of high bandwidth memory (HBM), while the servers supporting them also need conventional DRAM. And this is exactly why I've been so bullish on memory companies. You can build the most powerful GPUs in the world, but without enough memory capacity and bandwidth, you won't be able to fully utilize that computing power. As AI models continue getting larger and inference demand accelerates, I expect memory requirements to grow significantly.
Now, another $20 goes toward power and electrical infrastructure, which I think is one of the most underrated parts of this entire investment cycle. Companies like $ETN, $VRT, $GEV, and $PWR benefit because building AI data centers requires much more than simply purchasing GPUs. You need grid connections, transformers, power distribution equipment, and enough electricity to operate these facilities. Another $15 goes toward networking and optical connectivity, which is another area I've been following closely. Companies like $AVGO, $MRVL, $COHR, and $LITE play important roles in moving enormous amounts of data between GPUs and servers. As AI clusters continue scaling, networking becomes increasingly important because having more GPUs doesn't accomplish much if those GPUs cannot communicate efficiently. This is also why the transition toward 800G and 1.6T optical technologies matters so much. More computing power means more data needs to move around, and that creates additional demand for faster networking equipment and optical components. The remaining $15 goes toward cooling and physical data center infrastructure. As AI racks become increasingly power dense, cooling systems need to become more sophisticated, while the construction of new data centers creates opportunities for companies supplying the facilities themselves.
I think the biggest takeaway here is that AI infrastructure spending isn't going to benefit every company equally. What I'm personally looking for are companies operating in markets where demand is growing faster than supply, customers have limited alternatives, and that demand is translating into actual revenue and earnings growth. That's why I've been particularly focused on memory, optical networking, and power infrastructure. If you want to see how I’m investing across memory, optical networking, power, and the rest of the buildout, check out my portfolio below.
https://t.co/Hkywss4Ugh
Citi: 3Q26 AI Connectivity & Storage Preview
→ Connectivity remains Citi's preferred AI infrastructure exposure. Growth is increasingly driven by higher content per system rather than unit volumes, as faster data rates, rising power requirements and more complex architectures increase demand for copper, optical and power connectivity.
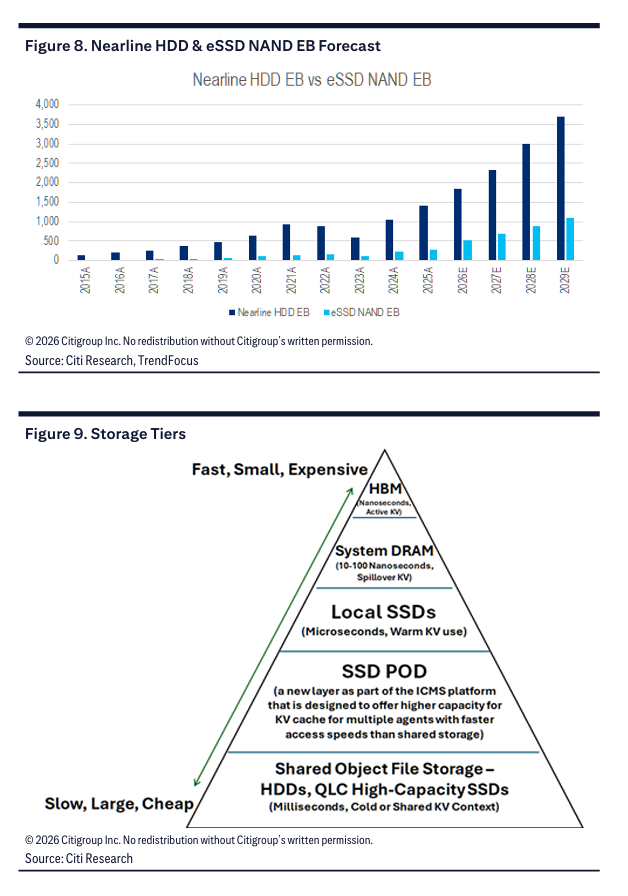
→ HDD pricing power could persist through 2030. WDC reports HDD $/TB pricing increases of ~18–19% YoY, while TrendFocus expects some OEM contract renewals to see increases of 20–40%+. Citi's checks suggest the industry may not return to its historical pattern of declining HDD prices.
→ Toshiba's expansion may not resolve HDD shortages. Despite reports of plans to double exabyte production capacity in FY27, Toshiba relies on external media and head suppliers. Citi's industry checks indicate a potential cumulative shortfall of ~400 exabytes over the coming years, even as additional capacity comes online.
→ Seagate appears better positioned for near-term supply growth. Its second-generation HAMR Mozaic 4+ ramp should support higher shipments, while WDC navigates ePMR and first-generation HAMR transitions. Citi prefers HDD over NAND given lower competitive intensity, disciplined capex and margin expansion potential.
→ AI inference is accelerating enterprise NAND demand. Citi forecasts ~29% NAND demand growth in 2027, supported by KV-cache offloading, longer context windows and enterprise SSD deployments. Sandisk's long-term supply agreements could also reduce historical earnings volatility.
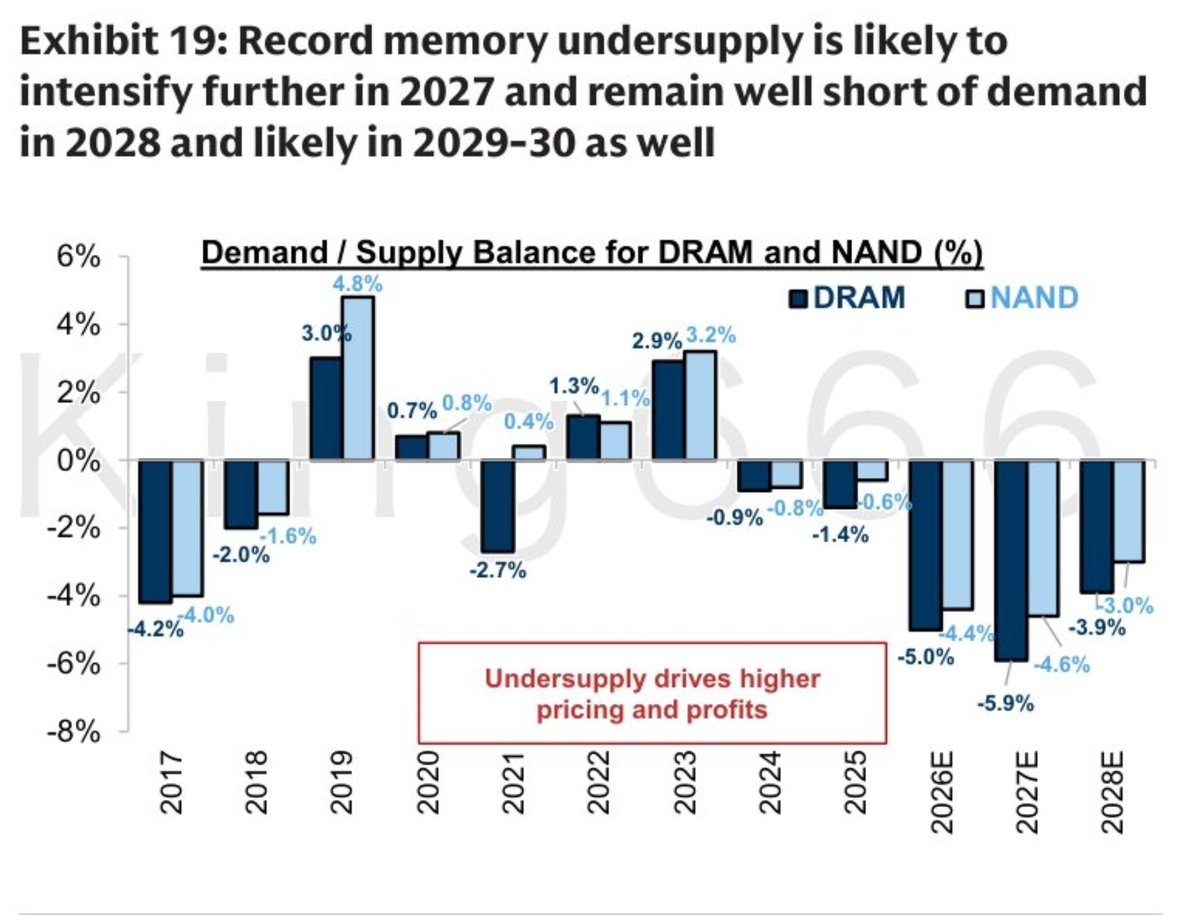
Goldman is now stretching the memory shortage out to 2030.
It sees global AI token use up more than 24 times by 2030, to about 120 quadrillion tokens a month.
Enterprise agents do most of the work. Consumer agents and non-agent loads fill the rest.
Token economics turn positive in the first half of 2026. Demand then accelerates off a low 2026 base.
That hits a wafer limit. Exhibit 19 has the DRAM and NAND balance more negative in 2027. Deficits of about 5.9% for DRAM and 4.6% for NAND, the tightest prints in the series.
Undersupply eases only a little in 2028 and stays short of demand into 2029 and 2030. HBM keeps crowding out conventional DRAM. New fabs take years.
That is pricing power, not a one-year spike. Long-term supply deals are already being written to lock output. The downside is slower consumer AI. Enterprise agents are still the main driver.
Scale in DRAM, NAND and HBM is the seat. A quick return to oversupply is not the base case.
If the deficit peaks in 2027 and still has not closed by 2030, is the miss cleanroom space, or agent token growth that the fabs were never sized for?
$MU $DRAM $EWY
You should be buying as much of the hyperscalers as possible right now and this chart from Evercore ISI is exactly why (Save this).
Evercore estimates that combined backlog across Amazon, Microsoft, Meta and Google hit over $2.4 trillion in Q2 2026, up nearly triple year over year and up 15% just from the prior quarter.
That backlog has gone from around $730 billion in March 2025 to over $2.4 trillion in June 2026, meaning it has more than tripled in just five quarters.
And the pace of growth is actually accelerating rather than slowing down, with year over year growth still climbing toward nearly 190%.
This confirms the exact thesis I have been tracking, these companies aren't spending capex on hope, they're building against contracts that customers have already signed and are contractually obligated to pay for.
A backlog this size, growing this fast, means there are trillions of dollars of already committed future revenue sitting on these companies books waiting to convert into actual sales as capacity comes online.
The 15% sequential jump in a single quarter is the number that matters most here since backlog typically grows in a lumpy, step function way tied to big enterprise deals and a jump like that in one quarter signals demand is still outrunning what these companies can currently deliver.
Now let's address the capex fear everyone keeps raising, because it's the wrong worry.
Combined 2026 capex guidance across the big four is running around $740-770 billion, nearly double what they spent the year before and that number alone has spooked a lot of investors into thinking these companies are overbuilding .
But that fear only makes sense if the spending were speculative, and the backlog data proves it isn't, since every dollar of that capex is chasing demand that's already contracted and locked in, not hoping demand shows up later.
Here's the part that makes this even more compelling because this spending is being funded by hyperscalers that already generating massive amount of cash flow.
Amazon's AWS alone generated $45.6 billion in operating income in FY2025 even after absorbing $96.5B in AWS capital expenditures, meaning the segment is still wildly profitable while building out capacity .
Microsoft's operating income grew 21% to more than $155 billion for the fiscal year, actually outpacing revenue growth, which shows the capex is being layered on top of a business that's expanding its margins.
Google's Cloud operating margin nearly doubled from 20.7% to 35.6% in a single year, even while the company raised its full year capex guidance to $195-205 billion, proof that heavier spending and better profitability are happening at the same time, not one at the expense of the other .
So the capex number that scares people is really just the flip side of the backlog number that should excite them, since you can't have $2.4 trillion in contracted future revenue without spending heavily today to build the capacity to deliver it.
This is why the pullback in hyperscaler and AI infrastructure stocks tied to Capex fears looks like a gift rather than a warning sign.
Bullish on hyperscalers, make sure to follow @MelvinInvests for more AI infrastructure insights, and if you want to see exactly what I'm buying as an analyst at Milk Road Pro, you can check out the link below for more.
Here are the 5 largest Oil ETFs and how they've performed so far in 2026:
🥇 $USO United States Oil Fund +53%🟢
🥈 $UCO ProShares Ultra Bloomberg Crude Oil +77.3% 🟢
🥉 $SCO ProShares UltraShort Bloomberg Crude Oil -48.2% 🔴
4. $OILK ProShares K-1 Free Crude Oil ETF +35.1% 🟢
5. $USOY Defiance Oil Enhanced Options Income ETF +28.4% 🟢
Investors are pouring money into US funds at a record pace:
US-listed ETFs have pulled in +$380 billion so far in 2026, on track for the best year on record.
This marks a +80% increase compared to the first two months of 2025.
As a result, average daily ETF inflows are up +52% YoY, to a record +$9 billion per session.
This is also up +310% since 2023 and marks the 3rd consecutive annual increase.
Since 2019, average daily ETF inflows have surged +700%.
The US ETF industry is experiencing a historic acceleration in investor demand.
Taiwan Semiconductor $TSM, the world's largest manufacturer of AI chips, reported record Q4 net profit of $16 billion, soaring 35% year-over-year.
It also raised its full-year sales growth forecast, citing the "AI mega trend".
Taiwan Semi's main customers include AMD $AMD, Nvidia $NVDA, Qualcomm $QCOM, Intel $INTC, Apple $AAPL, and Broadcom $AVGO.
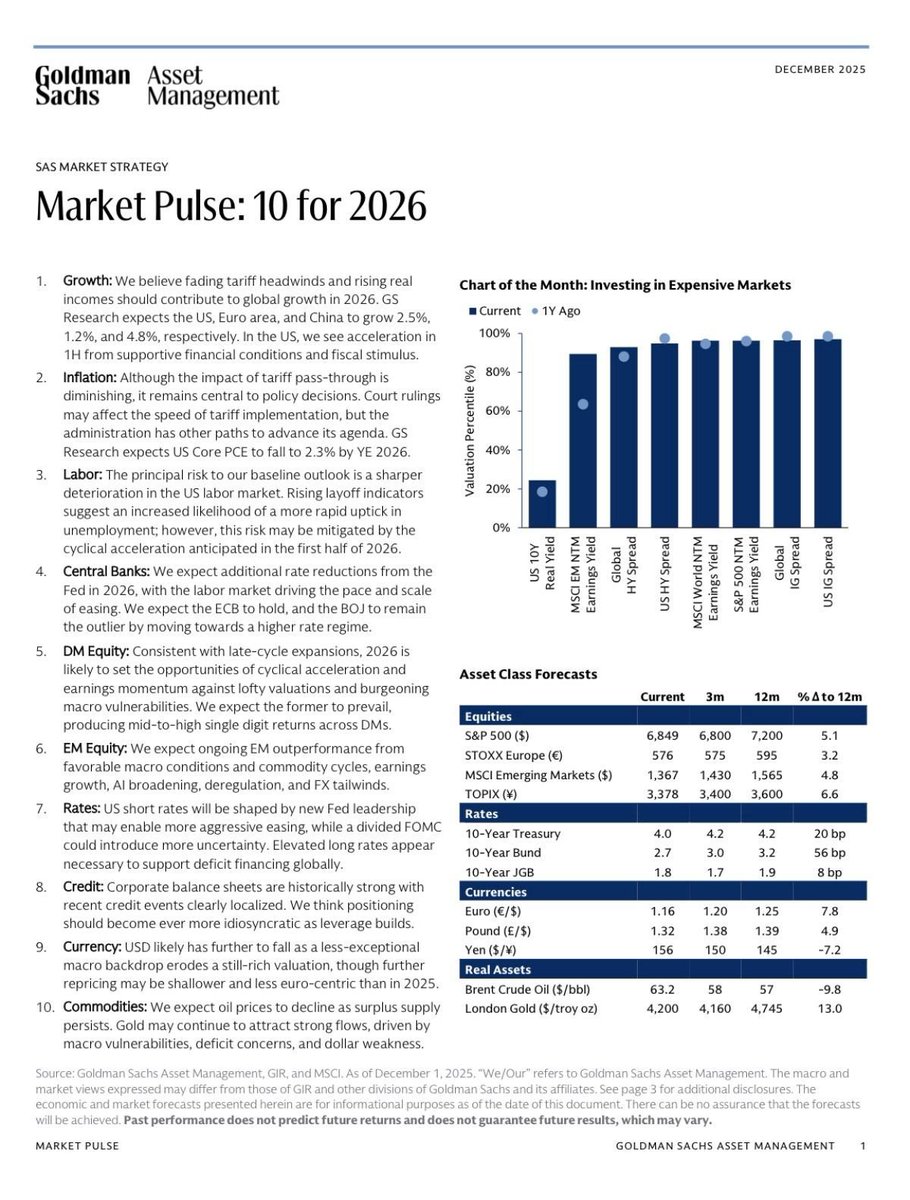
Goldman Sachs Asset Management just laid out its “10 for 2026” market roadmap
1. Growth – fading tariff drag and real income gains support global growth in 2026; GS sees US 2.5%, euro area 1.2%, China 4.8%.
2. Inflation – tariff pass-through is fading but still shapes policy; GS sees US core PCE easing to about 2.3% by end-2026.
3. Labor – main risk is a sharper weakening in the US labor market as layoff signals pick up.
4. Central banks – Fed seen cutting more in 2026, ECB on hold, BOJ shifting toward a higher-rate regime.
5. DM equities – late-cycle setup, with cyclical re-acceleration and earnings growth expected to outweigh high valuations.
6. EM equities – GS expects EM to keep outperforming on better macro, commodities, earnings growth, AI adoption, deregulation and FX tailwinds.
7. Rates – new Fed leadership could allow more aggressive easing while higher long-term yields help fund large deficits.
8. Credit – corporate balance sheets remain strong; returns likely more idiosyncratic as leverage builds.
9. Currency – dollar seen drifting lower as the US looks less exceptional, though the move may be smaller and less euro-focused than in 2025.
10. Commodities – oil prices expected to soften on surplus supply, while gold may keep drawing flows on macro risks, deficits and a weaker dollar.
The Dollar Index is getting crushed, and Trump thinks it is a good thing, and probably wants to go lower.
---
This chart shows all moves in the Dollar Index (DXY) from January 1st to July 31st, dating back to 1973 (multiple gray lines). The best (green), worst (red), and 2025 (blue) are highlighted.
Year-to-Date, the DXY is down 10.24% (blue).
Only 1973 (red line) and 1986 (lowest gray line) were worse than 2025.
In other words, the dollar is having a historically bad year.
What does Trump think about this?
tl:dr, it's a good thing, and probably wants it to go lower.
---
Trump spoke to the press before he departed for Scotland. He was asked about the lower dollar.
From the transcript:
when we have a strong dollar, one thing happens -- it sounds good, but you don't do any tourism, you can't sell tractors, you can't sell trucks, you can't sell anything. It is good for inflation, that's about it, and we have no inflation. We've -- we've wiped out inflation.
But it's an interesting question. So I will never say I like a low currency, but you remember the battles I had with the won, with China and with Japan, Japan being the yen. They always wanted a weak currency. They're trying to get a weak currency now. Now, it doesn't sound good, but you make a hell of a lot more money with a weaker dollar -- not a weak dollar but a weaker dollar than you do with a strong dollar.
when we have a strong dollar, one thing happens -- it sounds good, but you don't do any tourism, you can't sell tractors, you can't sell trucks, you can't sell anything. It is good for inflation, that's about it, and we have no inflation. We've -- we've wiped out inflation.
But it's an interesting question. So I will never say I like a low currency, but you remember the battles I had with the won, with China and with Japan, Japan being the yen. They always wanted a weak currency. They're trying to get a weak currency now. Now, it doesn't sound good, but you make a hell of a lot more money with a weaker dollar -- not a weak dollar but a weaker dollar than you do with a strong dollar.
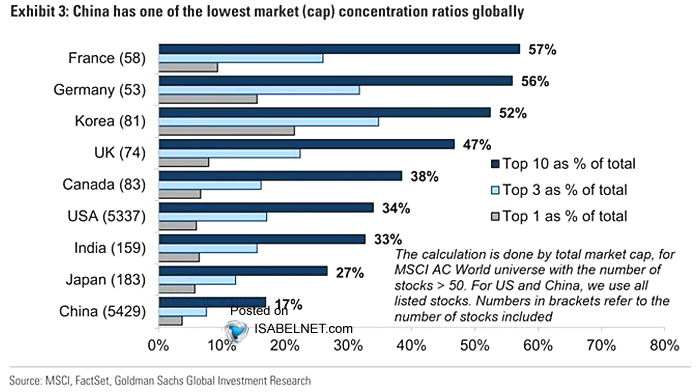
🇺🇸🇨🇳 Concentration
China has one of the lowest market capitalization concentrations worldwide, with its top ten companies comprising only 17% of total market cap—much less than the US's 34%—indicating greater growth potential in China
👉 https://t.co/Lec7q10LT3
ht @GoldmanSachs
🚨The $7.5 TRILLION Problem No One Is Talking About
Asian countries are quietly reversing 30 years of investment in U.S. assets.
What happens when the world’s biggest buyers of U.S. debt and stocks start pulling out?
( a thread)