🚨🚨DISPERSION UPDATE
Friday's selloff pushed cross-sectional dispersion to the 98th percentile. SPY dropped 2.58% but the average S&P 500 stock was only down 0.94%. The selloff was concentrated in the largest names. The rest of the market scattered.
Here's the forward return data across 5,598 trading days going back to 2003:
EXTREME dispersion (95th+ pct) · 342 days:
→ SPY avg 20d: +1.08% · avg 60d: +3.87%
→ IWM avg 20d: +1.25% · avg 60d: +5.31%
HIGH dispersion (75th–95th pct) · 691 days:
→ SPY avg 20d: +0.63% · avg 60d: +1.77%
→ IWM avg 20d: +0.64% · avg 60d: +2.18%
NORMAL & LOW (<75th pct) · 4,565 days:
→ SPY avg 20d: +0.76% · avg 60d: +2.30%
→ IWM avg 20d: +0.49% · avg 60d: +1.33%
HIGH is the worst forward return bucket at every horizon. Not EXTREME.
Extreme dispersion days are washout events, forced selling, margin calls, capitulation. That level of dislocation historically creates the conditions for mean reversion. The moderately elevated zone (75th–95th) is where nothing resolves. The slow grind.
We are currently at the 98th percentile. Across 342 prior instances at this level, SPY averaged +1.08% over 20 days and +3.87% over 60 days. IWM averaged +1.25% and +5.31%.
The regime still matters. The market is still fragmenting internally. But extreme dispersion spikes have historically resolved forward, not down.
$SPY $QQQ $IWM
🚨🚨ALERT | SPY WEEKLY OPEX | Friday Jun 5
$737.55 close. The engine reversed.
For five weeks we tracked the gamma blanket thinning while SPY rallied from $720 to $755. Every Friday, same message: the cushion is disappearing on schedule, the question is whether a catalyst arrives before it's gone.
The catalyst arrived. SPX down 3%. SPY down 2.6%. And the delta regime just flipped for the first time in six weeks of tracking.
Net delta: -56.31M. Last Friday it was +114.08M. That's a 170 million share swing in one week. Dealers went from short 114M shares (forced buying on every dip) to long 56M shares (forced selling on every dip). The mechanical bid that powered the rally isn't just weaker. It reversed.
Put delta is now -137.42M vs call delta of +81.11M. Puts are dominating the chain for the first time since we started this series. The hedging flow that was creating systematic buying through put decay is now creating systematic selling pressure.
Tonight's OPEX drains another 23% of gamma. 1.38M gamma shares and 22.93M of short delta expire. That short delta expiring means a one-time buying pulse Monday morning as dealers unwind hedges they no longer need. But once that clears, surviving delta is -33.39M. The structural flow through the rest of the week remains negative. Monday morning gets a mechanical bid. The rest of the week doesn't.
June 18 quarterly OPEX is 13 days away. 26.7% of remaining gamma on a single expiration. 3.89M contracts. After that, 69% of today's gamma blanket is gone.
Six weeks of data. The structure said wider ranges were coming. The ranges arrived. The delta flip says the direction of the mechanical flow has changed. What was buying pressure is now selling pressure until the positioning resets.
$SPY $SPX $QQQ $VIX
Robotics likely won’t have a “chatGPT moment” until we’re well into the industrial ramp for the next gen of automation, meaning you’re getting a nice opportunity to be long improving fundamentals right now and the catalyst of widespread attention is still waiting in the wings.
The data doesn't support this. IV at 17.1%, not 25%+. Our Correlation composite score at 2.0/10 green. SPY-TLT correlation actually improved today as well. The deep structural floor at $683 (7.7% below) is intact. Put skew is neutral, not panicking. Today's selloff was mechanically amplified by -$1.8B of negative gamma and the largest single-strike accelerator ever recorded, both of which expired at 4 PM. The leverage data, margin debt, and institutional positioning don't show the conditions that preceded 2008 or 2020. This was an OpEx Friday with depleted gamma and a hot payroll print. Not a liquidation event.
$SPY $QQQ
If your portfolio wasn’t down a good chunk today it just means you weren’t in the leading stocks and likely haven’t participated in the monster move off the lows over the past two months.
From John Plender's FT column:
"At the same time, Treasury funding is increasingly reliant on shorter-term securities, which means constant rollover risk. With US public debt approaching its highest ever level, this combination sounds like the very definition of a non-geopolitical financial chokepoint, with vulnerability to shocks. It also suggests there are now systemic risks in the Treasury market."
#economy #markets #bonds
For anyone confused, the lead driver of this correction is simple:
Big Tech sees so much opportunity ahead that it’s willing to take on unprecedented leverage to capture it.
You either believe their conviction or you don’t.
The S&P 500 gained 10.7% through the first five months of 2026, putting it on pace for a 15%+ gain for a fourth year in a row. The only other time the benchmark achieved the feat was the five-year streak from 1995-99.
The longer the rally continues, the more it resembles the late-1990s bull. Both were fueled by a revolutionary technology that triggered capex spending and productivity gains.
There are key differences, including demographics, consumer sentiment, and geopolitics, just to name a few.
While the debate over how well the current market fits the 1990s analog is fascinating, the relevant question here is whether the current rally will come to an end.
Two triggers of the 2000 bear market – rising inflation and technical divergences – are in play but not at bull-breaking levels currently.
The S&P 500 roughly followed its midterm year average pattern through February before diverging during the March selloff and April-May rebound (chart). Events in the Middle East likely brought some of the typical midterm year weakness forward.
History suggests additional weakness is possible, especially late in Q3 amid election angst. As the outcome has becomes less uncertain, the market has tended to enter a year-end rally. Point-to-point, the S&P 500 has risen 4.7% in the second half of midterm years, on average, which is the final input into our S&P target.
Given the historically overbought condition of the Technology sector, a Tech-led mean-reversion pullback could align with the midterm pattern however, midterm years often end on a high note.
https://t.co/JXzFFTmMtn
https://t.co/FfBnR93ojq
https://t.co/TFyCpPHZis
One of the sharpest technology investors alive just said something that cuts through all the noise in the AI market right now and 8 of his 10 largest positions are AI stocks (Save this).
That is Gavin Baker, CIO of Atreides Management, which now oversees $7 billion across public and private markets.
And he just handed the market a framework that most investors are completely ignoring.
"If you look at the valuations for all these AI names, they just can't all be accurate."
Right now, the market is discounting wildly different futures for different parts of the AI stack and those futures are mathematically incompatible with each other.
Memory makers like Micron are trading at 3–5x PE, NVIDIA is trading at a relatively low PE given its absolute dominance in the GPU market, and then there is everything else, power, cooling, and some optical names pricing in a completely different and far more aggressive AI spending scenario.
"If the multiples on power, cooling, and optical names are correct, NVIDIA and memory are going up a lot."
"If the multiples on NVIDIA and memory are correct, everything else is probably going to underperform."
One cohort is right and the other is wrong, and they cannot both be pricing in reality at the same time.
"The AI market is cross-sectionally inefficient right now."
Baker's own bet is not subtle but rather has structured his entire portfolio around the answer he believes.
His latest 13F shows NVIDIA as his most aggressive position, including leveraged call options on top of an underlying 3.5 million NVIDIA shares a direct bet that the low multiple on the most important semiconductor company in the world is the mispricing, not the high multiples everywhere else.
He also owns Micron adding substantially to the position as AI memory demand accelerates, with Micron's Q1 FY2026 revenue hitting $13.64 billion, up 57% year over year, and he added Astera Labs (ALAB) in a nearly 2,500% stake increase.
His Atreides portfolio held approximately $2.5 billion in SpaceX stock as of April, the fund was up 19% on the year, and of his 10 largest positions, 8 are AI stocks.
The Milk Road thesis lines up exactly with Baker's framework, and we were positioned before this clip went viral.
We are in NVIDIA and AVGO at the core of the AI stack, and we have been adding to names across the infrastructure buildout including AAOI for InP laser dominance, Bloom Energy (BE) for the AI power demand supercycle, and MU for the AI memory explosion that no hyperscaler can avoid.
Come join Milk Road Pro and get the full picture on which side of this mispricing and what else are positioned in, link in bio/below!
Nvidia 800 VDC Architecture official partners:
$NVTS — Navitas Semiconductor
GaNFast & GeneSiC platforms — 20x speed, 3x efficiency vs legacy silicon. First mover in GaN for AI DC power delivery.
Rev ~$77M TTM | GM ~43% | Cash $160M+ | Net loss narrowing
$STM — STMicroelectronics
Vertically integrated SiC from substrate to module. One of only 3 global players with full SiC supply chain.
Rev ~$13.3B | GM ~36% | Net income ~$2B | SiC >$1B segment, +40% CAGR
$AOSL — Alpha & Omega Semiconductor
Alpha-MOS process delivers ultra-low RDS(on) for high-frequency DC-DC conversion inside AI racks.
Rev ~$650M | GM ~28% | Profitable | Market cap ~$600M
$FLEX — Flex Ltd
2nd largest EMS globally. Designs and delivers full rack power systems for hyperscalers, not just assembly.
Rev ~$26B | GM ~9% | Net income ~$900M | ~9x PE
$POWI — Power Integrations
InnoSwitch platform dominates efficient off-line power conversion. Fewer parts, smaller form factor, higher reliability.
Rev ~$420M | GM ~54% | Net income ~$70M | $200M+ cash | Zero debt
$ON — onsemi
EliteSiC platform + captive SiC fab. Multi-year supply agreements lock in 3-5yr revenue visibility.
Rev ~$5.7B | GM ~45% | Net income ~$1B | SiC ~30% of revenue
$IFX — Infineon Technologies
Broadest power semi portfolio on Earth: SiC, GaN, IGBT, MOSFET. CoolSiC platform 800V-ready.
Rev ~€15B | GM ~38% | Net income ~€1.8B
$VRT �� Vertiv
End-to-end DC power infra: UPS, switchgear, cooling, PDU. Mission-critical with near-zero churn.
Rev ~$7.5B | GM ~35% | Net income ~$600M | Backlog >$6B
$TXN — Texas Instruments
300mm analog fabs = lowest cost at scale. 100k+ products. Once designed in, never replaced.
Rev ~$15.6B | GM ~57% | Net income ~$4.8B | 21yr dividend growth
$MPWR — Monolithic Power Systems
BCD process + proprietary packaging. VRM chips already inside NVIDIA GPUs. Deepest design-in relationship on the list.
Rev ~$2.2B | GM ~55% | Net income ~$500M
$GEV — GE Vernova
Utility-scale transformers and switchgear connecting AI data centers to the grid. No chips, but no DC without them.
Rev ~$34B | GM ~16% | Backlog >$100B
$ADI — Analog Devices
Signal chain + power management in the most demanding environments. Enormous switching costs once designed in.
Rev ~$9.4B | GM ~58% | Net income ~$1.7B | 21yr dividend growth
$ABBN — ABB
Building-level 800VDC power distribution and switchgear. Swiss precision, global hyperscaler reach.
Rev ~$32B | GM ~35% | Net income ~$3.5B
$ETN — Eaton
Busway and switchgear carry 800VDC from substation to rack. Once installed: effectively permanent infrastructure.
Rev ~$25B | GM ~36% | Net income ~$3B | Dividend aristocrat
$SU — Schneider Electric
EcoStruxure manages power + cooling + IT — the operating system for AI data centers. Full lifecycle lock-in.
Rev ~€36B | GM ~40% | Net income ~€4B
$SIE — Siemens AG
Grid automation + industrial digital twins across factory, DC, and grid. Full electrification stack.
Rev ~€75B | Net income ~€8B | Automation margins expanding
Choose your power semi and get ready to rumble.
This whole sector is a chock-point for the AI buildout.
I’m long $NVTS
This bull market won't last forever.
You need to take advantage of it while it's here.
Trillion-dollar industries are unfolding before our eyes:
AI, semis, photonics, space, data centers, energy, robotics, nuclear, drones, quantum.
The scale of change is massive, and the potential is enormous.
This bull markets is creating life-changing opportunities.
So, focus on the leading sectors and stocks. Be aggressive in the right areas, but don't get reckless. Always manage risk.
Moments like these are rare.
This is where fortunes are made.
Don't waste it.
OpenAI and Anthropic are effectively telling the market they can't solve every problem with a generic AI coworker.
You don't pour billions into massive forward-deployed joint ventures if you think the next model release is going to take care of it.
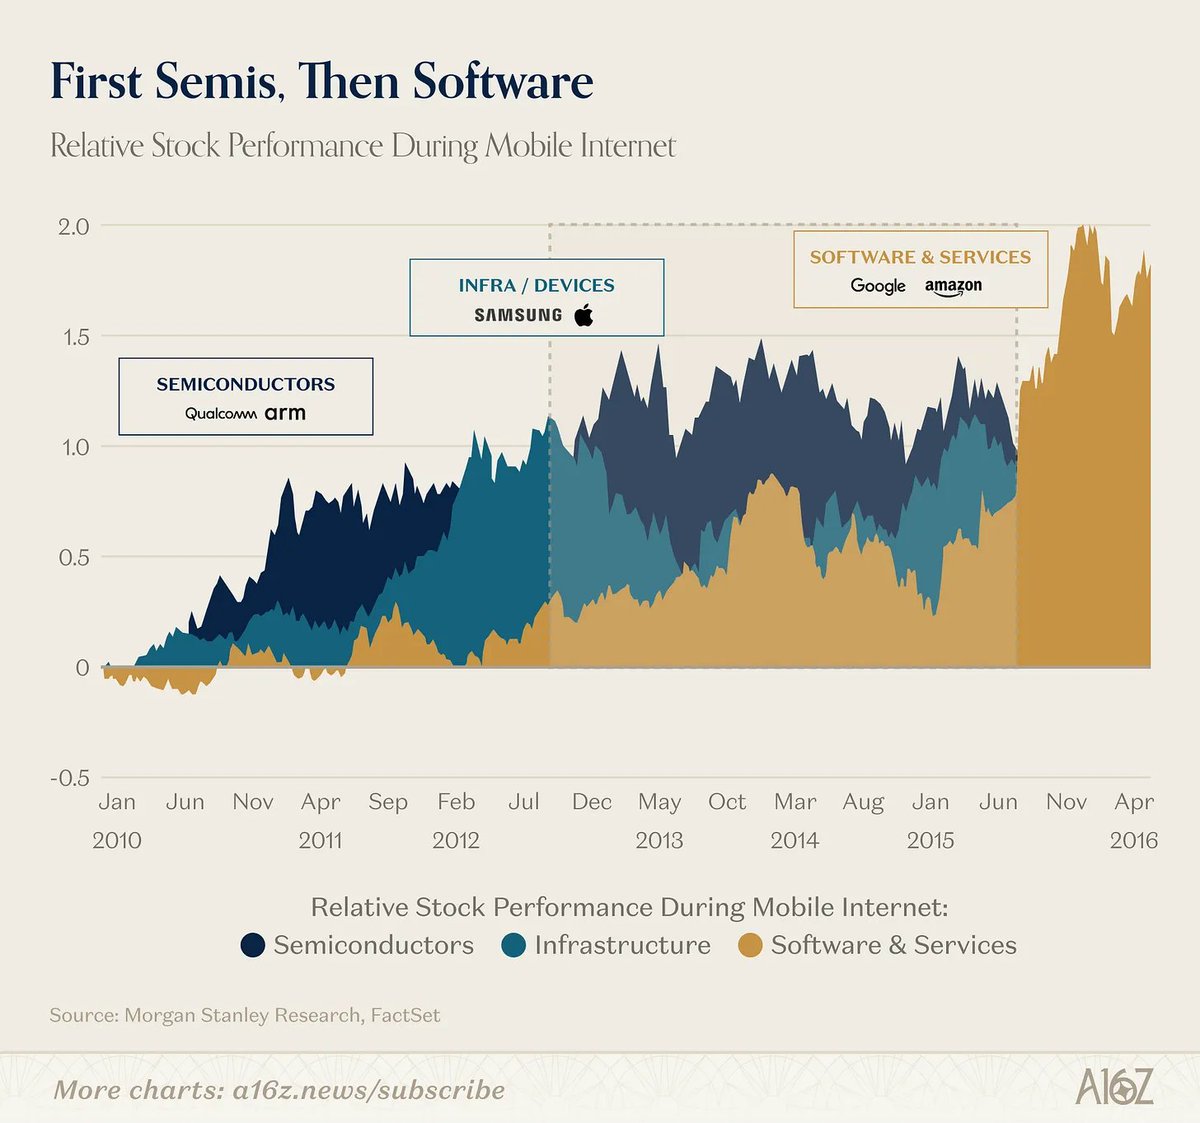
In the cloud supercycle, semis led and software followed (and you didn't need Qualcomm or ARM to tell you the value was migrating up the stack).
In AI, the infra layer itself is telling us the application layer is a separate, massive opportunity they can't fully capture.
a16z's @joeschmidtiv on why the app layer isn't dead: https://t.co/84QN5Mj9T3
he market continues pushing to new all-time highs, yet sentiment is actually becoming LESS bullish — a classic hallmark of a powerful “lockout rally” that climbs the proverbial Wall of Worry.
Despite the strength in stocks, investor optimism has not reached extreme levels, and the economy remains in a sweet spot: not overheating into runaway inflation, yet not slipping toward recession either. That combination continues to support the secular bull market backdrop. https://t.co/JXzFFTmMtn
I’m excited to announce that Figure has signed a commercial agreement with Catalyst Brands, the operator of JCPenney, Aéropostale, and Brooks Brothers
We’ll work to deploy humanoid robots at scale, starting with initial deployment in Reno, NV
8 trading days ago we published the Inflation Matrix.
CPI hot. PPI confirmed hot the next morning. Both Hot quadrant.
Historical average at 20 days:
$SPY: +1.44%, 69% win rate
$QQQ: +2.67%, 81% win rate
Through May 22 close (8 of 20 trading days):
$SPY: +1.19%
$QQQ: +1.32%
Tracking. 12 trading days left in the window.
The framework: it's not about hot or cold. It's about whether CPI and PPI agree. When they agree, forward returns are positive regardless of direction. When they disagree, returns go flat to negative.
Both reports agreed. The data is doing exactly what our research said it would do.
$SPY $QQQ $IWM $SPXL
$NVTS is now +70% in just 14 days since I mentioned the 9/21EMA crossback setup!
You cannot make this stuff up...it's the same process over and over again.
The longer I trade, the more convinced I become that if traders simply focused on 9/21EMA crossbacks in TRUE leadership names, they would drastically simplify their process and probably make significantly more money over time.
Because this is usually the exact area where:
- weak hands get shaken out
- momentum cools off (digestion)
- institutions slowly step back in + add to positions
- the next expansion leg begins building on the right side
$NVTS was positioned perfectly with the AI + electrification narrative, Stage 2 trend, relative strength, and then the exact 9/21EMA crossback reclaim I constantly preach about.
This is why I obsess over buying the right side of the V instead of chasing extension candles.
Strong stocks move → reset → reclaim → expand again.
Same process over and over again.
Chart: $NVTS.
MORNING INTERNALS | 10:56 AM ET
New Fed Chair. New era. Warsh sworn in. Indexes green. Breadth negative. Volume positive.
Kevin Warsh was sworn in as the 17th Federal Reserve Chair at the White House this morning. The first White House swearing-in of a Fed chair in roughly 40 years. Jerome Powell stays on as a governor. A new monetary regime begins.
S&P +0.47%. Nasdaq +0.48%. Dow +0.56%. All three indexes green.
A/D ratio: 0.91x. 2,425 declining vs 2,217 advancing.
Volume ratio: 1.56x. Up volume $2.25B vs down $1.45B.
38.2% above session VWAP.
Cum TICK: -2,023.
NYSE: 0.75x | Nasdaq: 1.04x | AMEX: 0.71x
The indexes are green. The internals diverge.
More stocks are declining than advancing. But the money is behind the advancers. VWAP at 38.2% means most stocks are trading below their daily average price. The rally is narrow. A handful of names pulling the indexes green while the majority of the market sells.
Yesterday the divergence ran the opposite direction: breadth positive, volume negative, indexes red. Today: breadth negative, volume positive, indexes green. The divergence flipped form but the pattern persists. The index and the internals keep disagreeing. Ten weeks running.
NYSE at 0.75x while Nasdaq at 1.04x. Old economy selling while tech holds. The Warsh premium is concentrated in the mega-caps and the Nasdaq, not the broad market. The Dow leads at +0.56% because of a few heavyweight components, not broad participation.
Warsh called for "regime change" at the Fed during his confirmation. He was confirmed 54-45, the closest vote for a Fed chair in the modern era. Trump wants rate cuts. But the energy shock from the Iran conflict has pushed inflation further from the Fed's 2% target. The question of whether the Fed will need to raise rates has moved to the center of internal deliberations.
Powell staying on as a governor is a signal. He said he will remain at least until an investigation into Fed headquarters renovations is complete. A former chair sitting on the board as a governor while a new chair runs the institution hasn't happened in nearly 80 years.
The market is pricing in the new chair. The internals say the pricing is concentrated at the top. The pattern from ten weeks of data: when the index says one thing and the internals say another, the internals have been the better signal.
Watching the tape. $SPY $SPX $QQQ
The 10-Year yield is 32 basis points from the only level that has produced statistically significant negative equity returns in the last 25 years. The 30-Year already broke through at 5.20%, its highest since 2007.
We tested every 25bp threshold from 1% to 6%. Only one broke equities: 5.00%.
When the 10Y crosses 5%:
20-day SPY return: -0.88%
Win rate: 46%
p-value: < 0.001
Bootstrap CI entirely negative [-1.46%, -0.31%]
But the pain is front-loaded. Every episode recovered.
1 month: -0.88%, 46% win
6 weeks: -1.09%, 41% win (the trough)
3 months: +2.24%, 68% win
6 months: +5.80%, 72% win
1 year: +8.59%, 70% win
Here is what most people get wrong about tech and rates.
QQQ does not have a breaking point at 5%. There are not enough observations above 5% in QQQ's history to even test it. But what we can test is the velocity.
When rates rise sharply (>25bp in 20 days):
QQQ 20-day return: +1.09%, 63% win
QQQ 30-day return: +1.80%, 69% win
When rates drop sharply:
QQQ 20-day return: +2.14%, 71% win
QQQ 30-day return: +3.51%, 76% win
QQQ 6-month return: +17.33%, 89% win
The gap at 6 months is 9.83 percentage points (p < 0.0001).
Tech does not break when rates rise. Tech underperforms. The spread between sharp drops and sharp rises in QQQ widens the further out you go. At 20 days the gap is 1.05%. At 6 months it is 9.83%.
XLK tells the same story. During sharp rate rises, XLK averages +0.60% over 20 days. During sharp drops: +1.58%. Tech survives rate spikes but leaves nearly 1% on the table every month rates are climbing.
QQQ's best regime right now would be NORMAL curve + SHARP DROP: +5.54% avg 20d return, 92% win rate. The worst for QQQ: FLAT + SHARP RISE at -1.08%. We are currently in NORMAL + RISING, which sits in the middle of the distribution.
The sector that actually breaks in rate spikes: XLF. Financials average -0.37% during sharp rises. The "banks benefit from higher rates" narrative does not survive contact with the data.
Current positioning:
10Y: 4.68% (32bp from 5%)
30Y: 5.20% (already through, 18-year high)
10y-2y spread: +0.54% (NORMAL)
20d rate change: +15bp (RISING)
5.00% is the threshold. 32bp is the cushion. The speed of the move is the variable that matters. The next inflation print is the catalyst.
$SPY $TLT $SPX $QQQ
ROTATION SCANNER | May 19, 2026 | $NVDA Eve
All tech red. Semis, software, solar. Healthcare and oil only green. $NVDA tomorrow.
Leader: $USO (Oil) +1.9%
Laggard: $SLV (Silver) -3.9%
Spread: 5.8%
The software holdout is over.
For three straight sessions $IGV was green while $SOXX sold. The hardware/software decoupling was the most persistent split in the scanner. Today $IGV is -1.0%. Software joined the sell-off. Every thematic name is red.
The market is not differentiating within tech anymore. It's selling all of it the day before $NVDA earnings.
SECTORS
$XLV (Healthcare) +1.0%. Session leader among sectors.
$XLE (Energy) +0.5%
$XLF (Financials) -0.5%
$XLK (Technology) -1.1%. Second straight day as sector laggard.
Healthcare and energy only sectors green. Financials flipped from yesterday's +0.1% to -0.5%. The market is narrowing to the most defensive corners.
FACTORS
$USMV (Min Vol) +0.4%. Only green factor.
$VLUE (Value) -0.1%
$QUAL (Quality) -0.6%
$MTUM (Momentum) -1.0%
Defensives are the only factor working. Momentum selling for the third straight day. Value barely negative. The factor picture is pure risk-off.
THEMATIC. All Red.
$SOXX (Semis) -0.5%
$XBI (Biotech) -0.6%
$ITA (Defense) -0.7%
$IGV (Software) -1.0%
Every thematic name in the red. Software at -1.0% is now the thematic laggard, not semis. That's a notable flip. The market was hiding in software while selling hardware. Today it's selling both. The pre-earnings de-risking is now total.
MACRO
$USO (Oil) +1.9%. Session leader.
$TLT (Bonds) -0.8%
$GLD (Gold) -1.3%
$SLV (Silver) -3.9%. Third straight session of heavy selling.
Oil holds on supply risk despite Trump calling off the Iran attack. Silver has now lost over 18% from its Monday high last week. Gold and bonds both selling. The only macro asset working is oil.
The positioning heading into $NVDA: healthcare, oil, and min vol. That's it. Everything else has been reduced. The scanner has never shown this level of pre-earnings consensus. The market made its bet. De-risk everything. Let the number decide.
Tomorrow.


![alphaticaio's tweet photo. The 10-Year yield is 32 basis points from the only level that has produced statistically significant negative equity returns in the last 25 years. The 30-Year already broke through at 5.20%, its highest since 2007.
We tested every 25bp threshold from 1% to 6%. Only one broke equities: 5.00%.
When the 10Y crosses 5%:
20-day SPY return: -0.88%
Win rate: 46%
p-value: < 0.001
Bootstrap CI entirely negative [-1.46%, -0.31%]
But the pain is front-loaded. Every episode recovered.
1 month: -0.88%, 46% win
6 weeks: -1.09%, 41% win (the trough)
3 months: +2.24%, 68% win
6 months: +5.80%, 72% win
1 year: +8.59%, 70% win
Here is what most people get wrong about tech and rates.
QQQ does not have a breaking point at 5%. There are not enough observations above 5% in QQQ's history to even test it. But what we can test is the velocity.
When rates rise sharply (>25bp in 20 days):
QQQ 20-day return: +1.09%, 63% win
QQQ 30-day return: +1.80%, 69% win
When rates drop sharply:
QQQ 20-day return: +2.14%, 71% win
QQQ 30-day return: +3.51%, 76% win
QQQ 6-month return: +17.33%, 89% win
The gap at 6 months is 9.83 percentage points (p < 0.0001).
Tech does not break when rates rise. Tech underperforms. The spread between sharp drops and sharp rises in QQQ widens the further out you go. At 20 days the gap is 1.05%. At 6 months it is 9.83%.
XLK tells the same story. During sharp rate rises, XLK averages +0.60% over 20 days. During sharp drops: +1.58%. Tech survives rate spikes but leaves nearly 1% on the table every month rates are climbing.
QQQ's best regime right now would be NORMAL curve + SHARP DROP: +5.54% avg 20d return, 92% win rate. The worst for QQQ: FLAT + SHARP RISE at -1.08%. We are currently in NORMAL + RISING, which sits in the middle of the distribution.
The sector that actually breaks in rate spikes: XLF. Financials average -0.37% during sharp rises. The "banks benefit from higher rates" narrative does not survive contact with the data.
Current positioning:
10Y: 4.68% (32bp from 5%)
30Y: 5.20% (already through, 18-year high)
10y-2y spread: +0.54% (NORMAL)
20d rate change: +15bp (RISING)
5.00% is the threshold. 32bp is the cushion. The speed of the move is the variable that matters. The next inflation print is the catalyst.
$SPY $TLT $SPX $QQQ](https://pbs.twimg.com/media/HIuoKSDXQAA09LU.jpg)


