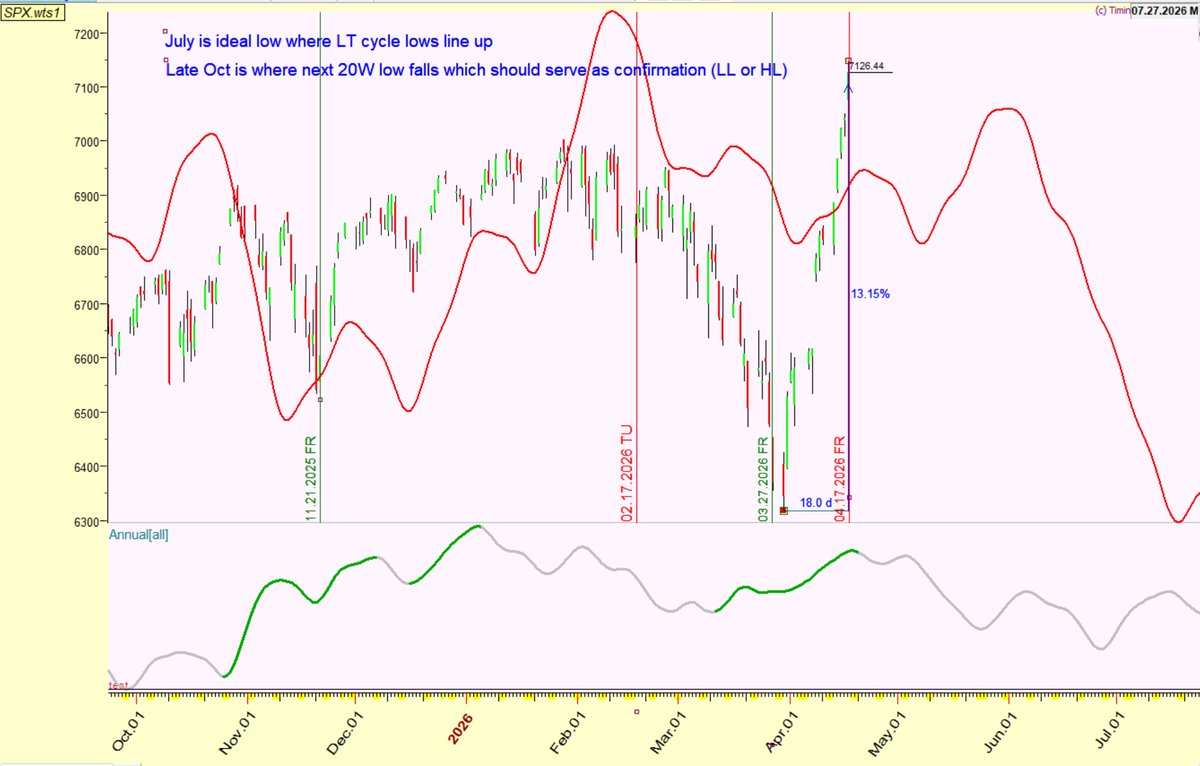
$SPX upd:
-Big picture remains unchanged: I am expecting a bear market with a buyable 3.5Y cycle low around Q3
-See below Dec 2024 projection with updated price
-20W cycle low came on time (1 day after ideal date of Mar 27 in pinned post)
-I didn’t expect new ATH: I thought we’d reject around golden pocket retracement. Between CTA mechanical bid and Trump playing the market like violin we have the blow off top I was expecting in Feb, market always finds a way to laugh at you
-The new 40d cycle is 1/2 way through and next week should tell us whether this rally has more upside or terminates here
-For my base bear case I had Apr 17 as turn date, but so far no signs of a slowdown in buying yet. Opex often provides a pivot in the cycle - or a few days after it.
-Based on Hurst method we still have potential several % more upside in $SPX which I’m not chasing as just like in Feb when I exited the market RR for a trader like me who likes holding positions for several months is not great and we have weekend headline risk.
-Timing wise next 40d low is due ~May 7 which should give us more info on the structure (depth of a pullback and strength of a bounce into late May) which then sets up bigger decline into a higher degree summer low.
-Leading indicators showing bigger decline is still ahead in a few weeks so staying cash heavy.
-If you want more updates - like and retweet
I dropped 2 videos calling bearish signals on $NVDA and $QQQ and some people hated it.
I don’t trade vibes, I trade data.
When Monthly BX turns red, 67% of the time we see a 20%+ selloff and the average outcome is negative.
Protect capital, not feelings
One of my biggest bear signals just fired on $QQQ 🚨
When this hits, $QQQ drops 10–15% or chops for ~90 days about 80% of the time.
Monthly BX just closed dark red and I’m exiting my bullish thesis.
Full breakdown in the video ⬇️
I’ve said it before, & I’ll say it one final time…
All indicators have officially aligned for $SPY to see a -12% crash heading into April/May.
This doesn’t mean to sell; rather reposition into more stable assets and stocks.
This will be your ONLY dip buying opportunity for 2026.
Save this for later…
It is very clear the AI is going to disrupt many industries and run some companies out of business
But there will also be beneficiaries:
Datacenter infrastructure:
$NBIS
$CRWV
$IREN
$WULF
$CIFR
Drones:
$ONDS
$RCAT
$KTOS
$UMAC
Aerospace:
$LUNR
$RKLB
$LMT
$RKLB
$FTAI
Uranium:
$UUUU
$CCJ
$DNN
$UEC
Lithium:
$LIT
$RIO
$ALB
$LAR
Energy:
$GEV
$XOM
$ICLN
$BE
Metal miners:
$KGC
$B
$AEM
$AU
The markets continue to put these relative strength winners in front of our faces
These are the sectors/stocks I'm focused on for the coming months.
If I was starting from zero today, this is exactly what I’d look for:
$IREN under $45 — AI power infrastructure
$NBIS under $100 — AI-cloud/infrastructure
$ONDS under $10 — autonomous defense systems
$RKLB under $72 — the SpaceX alternative
$EOSE under $12 — grid-scale energy storage
$TE under $8 — utility-scale solar
$OSS under $9 — rugged compute for defense
$PNG.V under $8 — subsea defense
8 picks. 4 sectors.
One thesis: the infrastructure buildout is just getting started.
Save this and check back in 2028.
Note: This is NOT financial advice.
These 7 stocks will create millionaires by 2027:
1. $IREN - AI power infrastructure
2. $ONDS - Autonomous defense systems
3. $RKLB - Reusable rockets and space launch
4. $IBRX - FDA-approved cancer immunotherapy
5. $EOSE - Long-duration energy storage
6. $TE - Utility-scale solar manufacturing
7. $OSS - Rugged edge computing for AI
Save this post and check back next year.
A sharp re-correlation event is likely ahead:
In a healthy market, stocks tend to move together, either expanding breadth on the upside or compressing together on the downside. When large numbers of stocks simultaneously register extreme strength and extreme weakness, the market is signaling internal contradiction. This is investors disagreeing sharply about direction. This type of fractured structure has historically preceded turbulence, because markets rarely sustain contradictory internals for long. Eventually the tension resolves into a more uniform trend, and that shift often arrives with elevated volatility.
Fosback’s High–Low Logic Index quantifies this contradiction by measuring the share of stocks making new 52wk highs and new 52wk lows at the same time. Elevated HLLI readings indicate that the internal structure of the market is inconsistent with a stable trend. Too many stocks are behaving as if conditions are exceptional, but in opposite directions. Spikes in the indicator have repeatedly aligned with subsequent periods of negative returns and rising volatility, reflecting the market’s need to reconcile these mixed signals.
Return dispersion captures the same fragility from a return-based perspective. When individual stocks experience exceptionally large moves while the index barely changes, it indicates correlations have broken down and the cross‑section of returns has become disorderly. Extreme dispersion shows that capital is being pulled in opposing directions, precisely the dynamic highlighted by a high HLLI. The index becomes a misleading anchor, appearing calm while hidden instability builds underneath. Historically, such periods have been transitional, giving way to broad, correlated moves once a dominant macro driver emerges.
The LPPL framework fits naturally into this environment, as it mathematically identifies bubble-type price dynamics marked by accelerating, oscillatory behavior that cannot persist. The model detects “bubble exhaustion,” where prices have risen in a self-reinforcing pattern that becomes unstable, and “crash exhaustion,” where downside spirals have similarly run too far. Current LPPL readings show a market split between sectors exhibiting bubble-like upside exhaustion and others showing crash-like downside exhaustion. This mix reflects nonlinear dynamics characteristic of late-cycle instability and suggests that several sectors sit at mathematically unsustainable endpoints.
What ties LPPL signals to HLLI and dispersion is that all three frameworks diagnose instability rather than predict direction. LPPL captures instability in price patterns, HLLI in breadth, and dispersion in cross‑sectional returns. When all three light up simultaneously, they collectively describe a market stretched across conflicting pressures. This is the hallmark of late-cycle fragmentation, when internal relationships break down and sector behavior becomes desynchronized.
Taken together, the data materially increases the likelihood that correlations will snap back toward 1. A fractured state cannot sustain itself, and once the market resolves these contradictions, stocks tend to move together sharply. LPPL indicates that several sectors have reached unstable extremes, HLLI shows abnormal simultaneous highs and lows, and dispersion confirms extreme disagreement across stocks. Together, they portray a market approaching a phase transition.
Historically, when these conditions align, the resulting correlation spike is often asymmetric to the downside, as bubble exhaustion in defensives and cyclicals collides with crash exhaustion in growth and rate‑sensitive sectors. But regardless of the direction, the key takeaway is that diversification tends to evaporate at precisely the moment investors rely on it most. Correlations rise abruptly, idiosyncratic dispersion collapses, and the market resolves its internal conflict through a broad, unified move.
ht:
@TheMarketStats (High-Low Logic Index)
@VrntPerception (LPPL Chart)
Nomura (Dispersion)
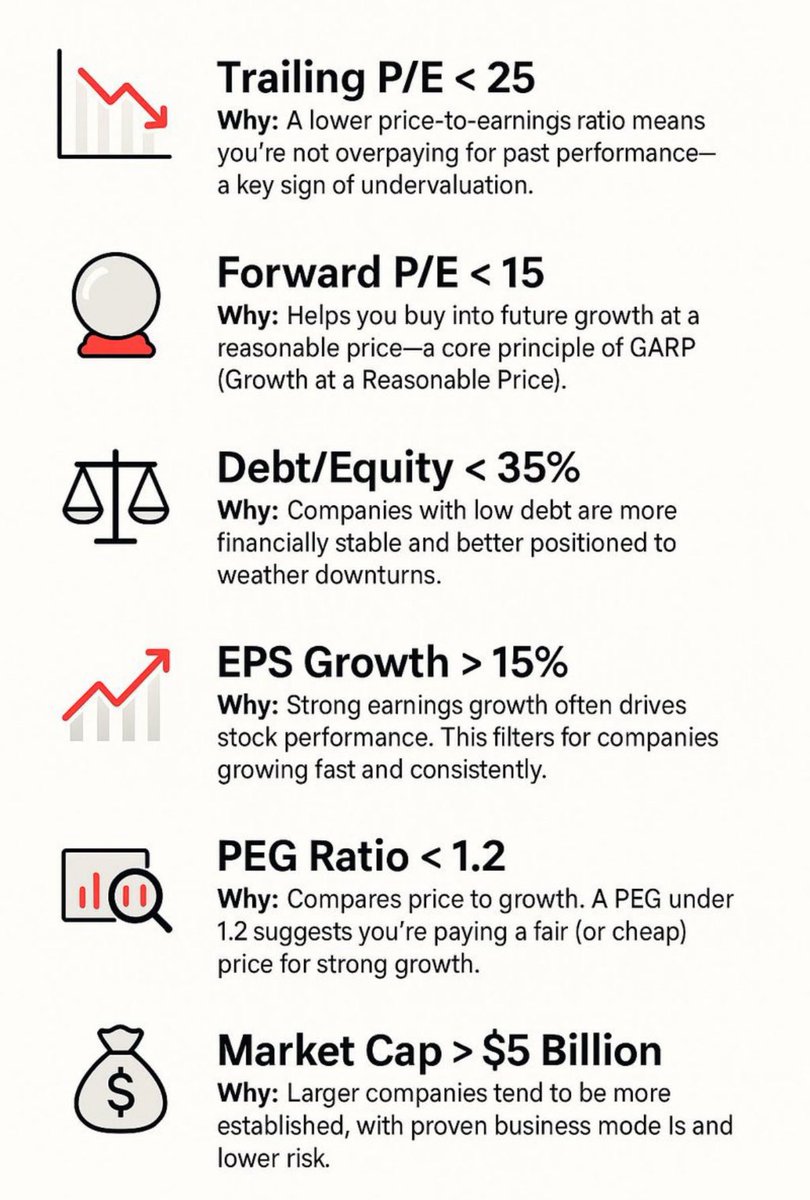
Peter Lynch’s 6 Rules for Finding 10x Stocks (Still Work Today)
Peter Lynch turned $18M into $14B running Fidelity’s Magellan Fund.
He didn’t chase hype.
He bought growth - at the right price.
Here’s the exact checklist he used 👇
⸻
1️⃣ Trailing P/E < 25
Don’t overpay for what already happened.
Lynch wanted companies trading at reasonable multiples - where expectations were low and upside was asymmetric.
⸻
2️⃣ Forward P/E < 15
Growth is great.
Overpaying for growth isn’t.
He looked for earnings expansion that wasn’t fully priced in.
⸻
3️⃣ Debt-to-Equity < 35%
High debt kills compounding.
Strong balance sheets survive recessions - and come out stronger.
⸻
4️⃣ EPS Growth > 15%
Earnings drive long-term stock prices.
If profits grow consistently, price usually follows.
⸻
5️⃣ PEG Ratio < 1.2
One of Lynch’s favorite tools.
PEG under ~1 = growth at a reasonable price.
Pay for expansion - not for hype.
⸻
6️⃣ Market Cap > $5B
Established enough to be durable.
Still small enough to compound.
This is where multi-baggers often start.
⸻
Lynch said:
“The person that turns over the most rocks wins the game.”
The edge isn’t prediction.
It’s discipline.
Downside will ruin an entire generation of Traders.
They will be too scarred to touch any Stock again.
Precisely where they want you to be.
#roadto5000