전설적인 트레이더 린다 라슈케(Linda Bradford Raschke)의 매매 전략 9가지를 정리했다.
1981년부터 트레이딩을 시작해 옵션 시장조성자, 선물 트레이더, 헤지펀드 운용자로 활동한 인물이다.
잭 슈웨거의 《The New Market Wizards》에 소개됐으며, 래리 코너스와 함께 집필한 《Street Smarts》는 지금도 ���기 트레이딩의 고전으로 꼽힌다.
라슈케의 매매에는 공통적인 특징이 있다.
추세, 모멘텀, 변동성, 가격 돌파를 이용한다. 진입 조건을 정하고 손절 위치를 미리 계산하며, 예상했던 움직임이 나타나지 않으면 빠르게 청산한다.
실제 매매에 적용할 수 있도록 대표 전략 9가지를 살펴봤다.
1. Anti Setup — 추세 속 모멘텀 재가속
가장 관심이 가는 전략이다.
상승 추세에서 단기 조정이 발생한 뒤 모멘텀이 다시 강해지는 시점을 포착한다.
사용하는 지표는 스토캐스틱이다.
- 빠른 선: %K 7기간, 평활화 4
- 느린 선: %D 10기간
매수 과정은 다음과 같다.
1) 느린 %D가 상승한다.
2) 가격이 조정받으며 빠른 %K가 하락한다.
3) 느린 %D의 상승 흐름이 유지된다.
4) 빠른 %K가 다시 상승 방향으로 꺾인다.
5) 직전 봉 고점 돌파를 진입 기준으로 삼는다.
손절은 최근 저점 아래에 설정한다. 보유기간은 일반적으로 3–4봉 정도다.
핵심은 모멘텀의 속도 차이다.
중기 상승 흐름이 유지되는 동안 단기 매도 압력이 약해지는 구간을 찾는다.
주가가 다시 상승하기 시작하는 시점에 진입하는 방식이다.
실전에서는 상승 추세가 분명한 종목을 대상으로 연구할 만하다. 횡보장에서는 스토캐스틱의 방향 전환이 자주 발생해 손절이 반복될 수 있다.
2. Holy Grail — 강한 추세의 눌림목 매수
라슈케의 대표적인 추세추종 전략이다.
사용하는 지표는 ADX(14)와 EMA20이다.
ADX는 추세의 강도를 나타낸다. EMA20은 최근 20개 봉의 가격에 가중치를 둔 이동평균선이다.
매수 규칙은 다음과 같다.
1) ADX가 30을 초과하고 상승한다.
2) 주가가 강한 상승 추세를 형성한다.
3) 가격이 EMA20 부근까지 조정받는다.
4) 조정 이후 직전 봉 고점을 돌파하면 매수한다.
5) 최근 저점 아래에 손절을 둔다.
첫 번째 목표는 직전 고점이다. 추세가 이어지면 추적손절로 수익을 관리한다.
예를 들어 주가가 100달러에서 120달러까지 상승한 뒤 112달러까지 조정받았다고 가정하자.
EMA20 부근에서 매수세가 회복되고 직전 봉 고점을 돌파하면 진입한다.
강한 추세에서 발생하는 일시적인 조정을 이용하는 방식이다.
첫 번째 눌림목과 세 번째, 네 번째 눌림목은 구분해서 볼 필요가 있다. 추세가 오래 진행될수록 가격 구조와 ADX의 변화가 중요해진다.
3. Turtle Soup — 실패한 돌파를 역으로 이용
상당히 흥미로운 전략이다.
원래 터틀 트레이더들은 20일 신고가와 신저가 돌파를 활용했다.
라슈케는 돌파가 실패한 뒤 가격이 기존 범위로 복귀하는 움직임을 매매했다.
매수 규칙은 다음과 같다.
1) 새로운 20거래일 최저가가 ��생한다.
2) 이전 20일 최저가는 최소 4거래일 전에 형성돼 있어야 한다.
3) 가격이 기존 최저가를 회복한다.
4) 기존 최저가보다 5–10틱 위에 매수 주문을 둔다.
5) 당일 저점 아래에서 손절한다.
매도는 반대다.
20일 최고가를 돌파한 가격이 다시 기존 최고가 아래로 떨어지면 매도 기회를 찾는다.
여기에는 시장의 주문 구조가 작용한다.
신고가 돌파 구간에는 추세추종 매수와 기존 공매도 포지션의 손절 주문이 모이기 쉽다.
돌파가 실패하면 새로 매수한 투자자들의 청산이 추가 매도 압력으로 작용한다.
이 과정에서 짧고 강한 반전이 발생할 수 있다.
중요한 것은 시장의 추세 강도다.
강한 상승장에서 신고가를 역으로 매도하면 연속 손절이 발생하기 쉽다. 박스권의 극값과 추세 가속 구간을 구분하는 것이 핵심이다.
4. Turtle Soup Plus One — 다음 날 확인하는 돌파 실패
Turtle Soup의 변형이다.
신저가 발생 다음 날을 매매 대상으로 삼는다.
매수 규칙은 다음과 같다.
1) 새로운 20일 최저가가 발생한다.
2) 이전 최저가는 최소 3거래일 전에 형성돼 있어야 한다.
3) 당일 종가가 기존 최저가 이하에서 마감한다.
4) 다음 날 기존 최저가에 매수 스톱 주문을 배치한다.
5) 그날 체결되지 않으면 주문을 취소한다.
손절은 첫날과 둘째 날에 형성된 저점 중 낮은 가격 아래에 둔다.
예를 들어 기존 20일 최저가가 100달러였다고 가정하자.
주가가 98.50달러까지 하락한 뒤 99달러에 마감한다.
다음 날 주가가 100달러를 회복하면 매수 신호가 발생한다.
매수세가 기존 저점을 회복할 만큼 강해지는 순간을 포착하는 방식이다.
일반적인 Turtle Soup보다 신호를 확인할 시간이 하루 더 주어진다.
5. 80-20 Setup — 하루 급락 이후 반전
전날 강하게 하락한 시장에서 다음 날 발생하는 반등을 노린다.
매수 규칙은 다음과 같다.
1) 전날 시가가 하루 가격 범위의 상위 20%에 위치한다.
2) 전날 종가가 하위 20%에서 마감한다.
3) 다음 날 전일 저가를 추가로 이탈한다.
4) 가격이 다시 전일 저가 위로 올라오면 매수한다.
5) 당일 형성된 저점 아래에 손절을 둔다.
원전에서는 전일 저가보다 5–15틱 추가 하락하는 조건을 사용한다.
당일 청산을 기본으로 한다.
급락한 시장에서는 추가 매도가 발생한 직후 매도세가 소진되면서 반등하는 구간이 나타난다.
이러한 단기 가격 복귀 현상을 이용한다.
현재 시장에 적용하려면 상품별 최소 호가 단위와 변동성을 반영해야 한다.
6. NR7 + Opening Range Breakout — 변동성 수축 이후 돌파
NR7은 Narrow Range 7의 약자다.
최근 7거래일 가운데 하루의 고가와 저가 차이가 가장 작은 날을 의미한다.
매매 과정은 다음과 같다.
1) 전날 NR7이 발생했는지 확인한다.
2) 다음 날 개장 후 최초 45–60분의 가격 범위를 관찰한다.
3) 해당 범위 위쪽에는 매수 주문을 설정한다.
4) ���래쪽에는 매도 주문을 설정한다.
5) 한쪽이 체결되면 반대쪽 주문을 취소한다.
변동성이 수축한 뒤 가격이 방향성을 확보하는 구간을 이용한다.
주가가 며칠 동안 좁은 범위에서 움직이다가 거래량이 증가하면서 강하게 돌파하는 모습과 연결된다.
개인적으로 매우 관심이 가는 전략이다.
실전에서는 첫 60분의 거래량, 시장 전체 상승·하락 종목 수, 변동성 확장 여부를 함께 분석해 볼 만하다.
특히 나스닥 선물처럼 유동성이 풍부한 시장에서 분봉 데이터를 이용해 검증할 가치가 있다.
7. Momentum Pinball — 단기 과매도 이후 반등
1일 가격 변화율에 RSI(3)를 적용한 LBR/RSI를 사용한다.
매수 규칙은 다음과 같다.
1) 전날 LBR/RSI가 30 미만으로 내려간다.
2) 다음 날 첫 1시간의 고점과 저점을 확인한다.
3) 첫 1시간 고점을 돌파하면 매수한다.
4) 첫 1시간 저�� 아래에 손절을 둔다.
5) 이익 상태로 마감하면 다음 날까지 보유해 청산한다.
RSI가 70을 초과하면 반대 방향으로 적용한다.
단기적으로 과도하게 움직인 가격이 되돌아오는 현상을 이용한다.
단기 반등을 노리는 전략이므로 첫 1시간의 가격 범위와 실제 체결가격이 중요하다.
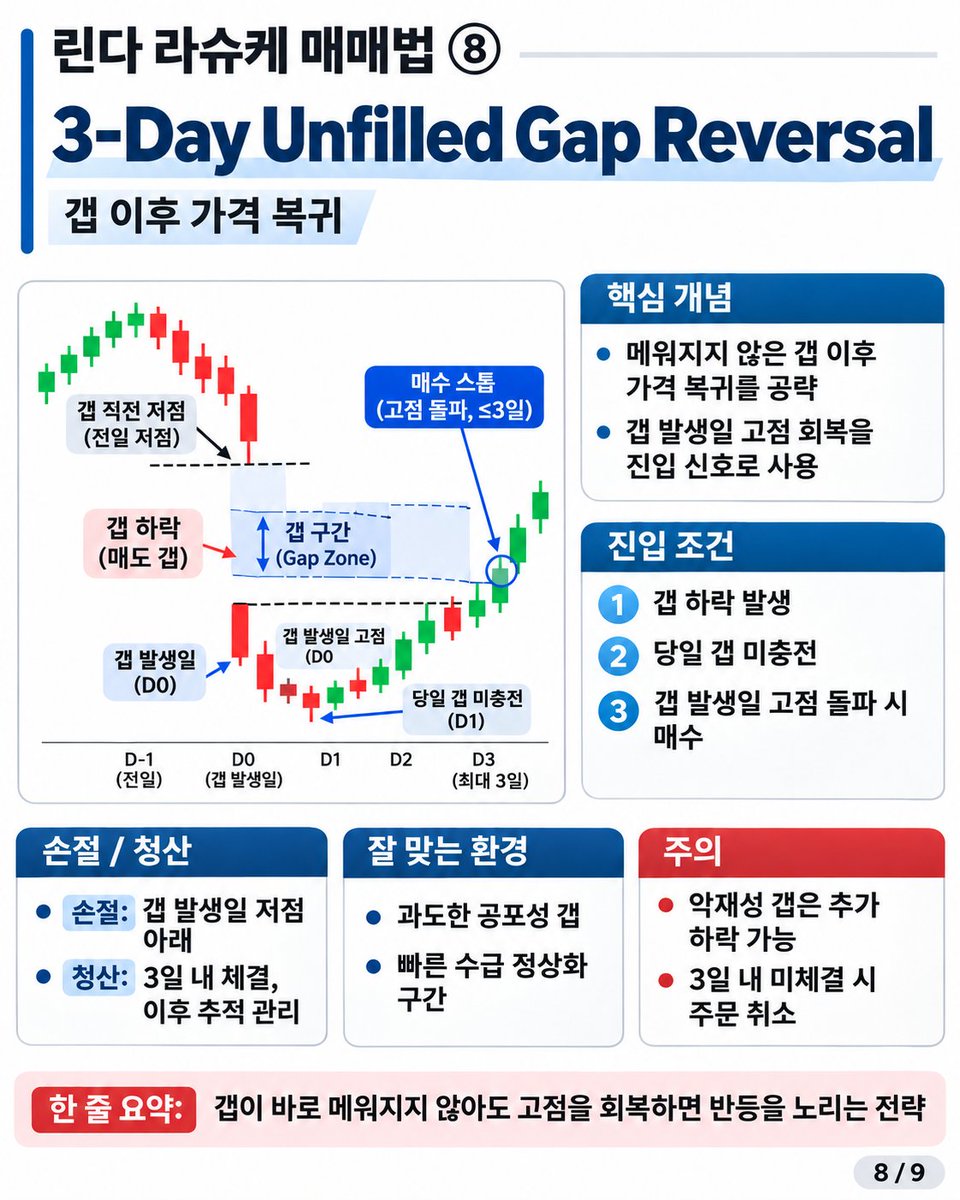
8. Three-Day Unfilled Gap Reversal — 갭 이후 가격 복귀
�� 하락이 발생한 뒤 가격이 회복되는 움직임을 이용한다.
매수 규칙은 다음과 같다.
1) 주가가 전일 저가 아래에서 출발한다.
2) 당일 갭이 메워지지 않는다.
3) 갭 발생일 고점보다 한 틱 높은 가격에 매수 주문을 둔다.
4) 주문은 이후 3거래일 동안 유지한다.
5) 체결되면 갭 발생일 저점 아래에 손절을 둔다.
3거래일 동안 체결되지 않으면 주문을 취소한다.
특히 기업 실적 발표 이후 발생하는 갭과 시장 전체의 변동성 확대에 따른 갭을 구분해서 분석할 필요가 있다.
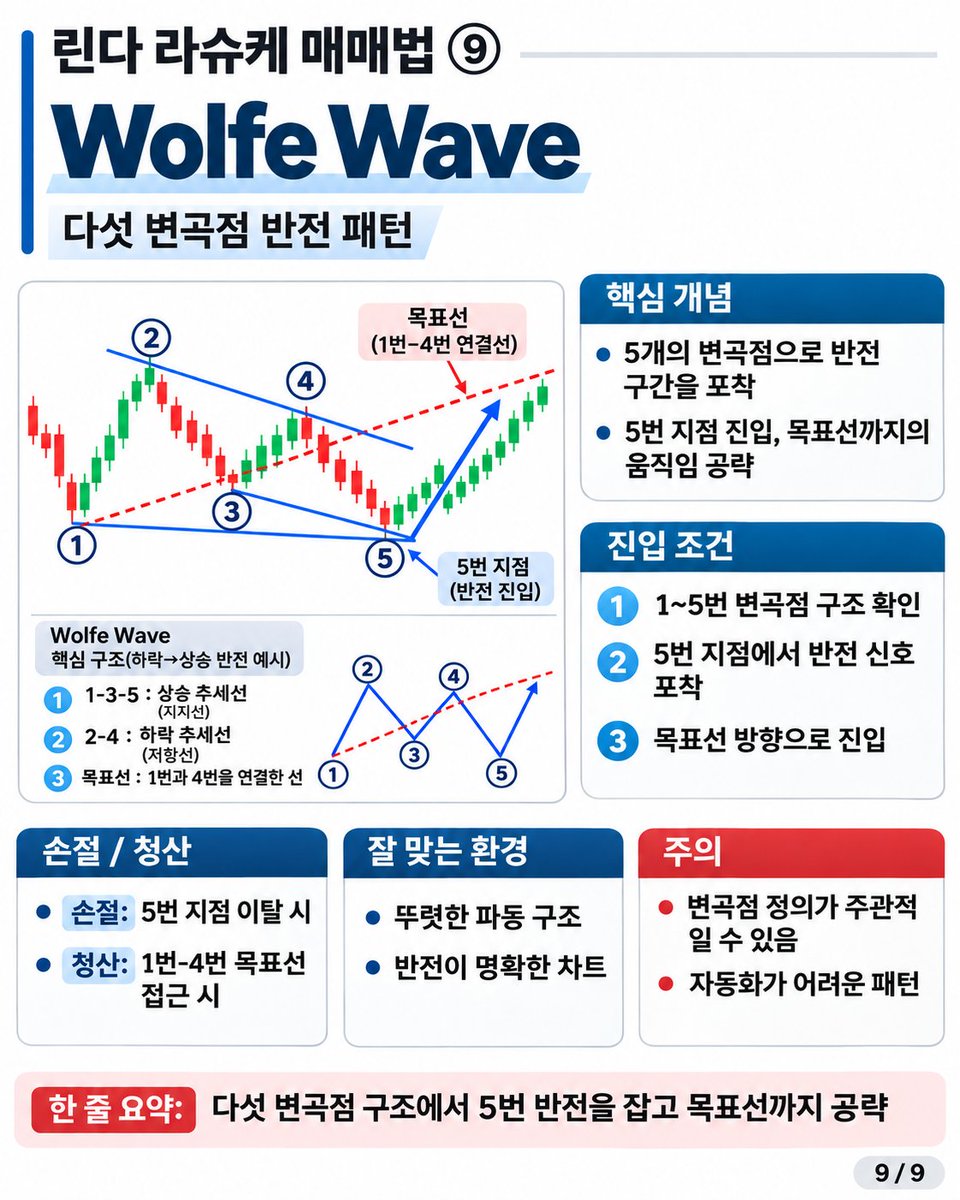
9. Wolfe Wave — 다섯 개의 변곡점을 이용한 반전
연속된 다섯 개의 고점과 저점을 연결해 가격 반전을 예상하는 패턴이다.
1번과 3번 변곡점을 연결한 추세선을 연장해 5번 진입 구간을 찾는다.
이후 1번과 4번을 연결한 선을 목표가격으로 활용한다.
가격 구조를 시각적으로 이해하기에는 ���용하다.
다만 변곡점을 어떻게 정의하는지에 따라 진입 신호가 달라진다.
자동화하려면 고점과 저점을 확정하는 수학적 규칙부터 정해야 한다.
---
그렇다면 실제로 수익이 발생할까?
여기가 가장 중요한 부분이다.
앞서 미국 ETF 일봉 데이터로 Anti와 Turtle Soup Plus One의 일부 규칙을 직접 재현했다.
2020년 7월부터 2026년 11월까지의 IEX 데이터를 사용했고, 2024년부터를 표본 밖 구간���로 분리했다.
거래비용을 차감한 단순화된 롱 전략의 표본 밖 결과는 다음과 같다.
Anti
- QQQ: 17회 거래, Profit Factor 1.29
- SPY: 12회 거래, Profit Factor 0.48
Turtle Soup Plus One
- QQQ: 5회 거래, Profit Factor 0.00
- SPY: 8회 거래, Profit Factor 0.22
Profit Factor는 총이익을 총손실로 나눈 값이다.
1.0을 초과하면 총이익이 총손실보다 많다는 의미다.
이번 탐색에서는 Anti가 QQQ에서 양의 성과를 보였지만 SPY에서는 손실이 발생했다.
Turtle Soup Plus One은 두 시장 모두 부진했다.
거래 횟수가 적고 일봉 내부의 체결 순서를 완전히 재현하지 못했으므로 이 결과는 예비 연구 자료로 봐야 한다.
그럼에도 확인할 부분은 분명하다.
동일한 전략을 사용해도 시장과 청산 규칙에 따라 성과가 상당히 달라진다.
실제 매매에는 어떻게 적용할까?
우선 시장 상태에 따라 사용할 전략을 구분하는 방식이 합리적이라고 생각한다.
강한 상승 추세에서는 Holy Grail.
추세 속 단기 조정에서는 Anti.
박스권의 돌파 실패에서는 Turtle Soup.
변동성이 극도로 수축했다면 NR7.
단기 과매도 이후 가격이 회복되는 상황에서는 Momentum Pinball과 80-20.
그리고 모든 전략에서 가장 중요한 것은 손절과 포지션 크기다.
예를 들어 계좌자산이 20,000달러이고 거래당 위험을 0.5%로 제한한다고 가정하자.
허용 손실은 100달러다.
500달러에 매수하고 490달러에 손절한다면 주당 손실은 10달러다.
거래비용을 제외하면 최대 10주까지 매수할 수 있다.
이렇게 위험을 먼저 계산하면 진입가격과 손절가격이 달라져도 동일한 위험 기준을 유지할 수 있다.
서로 상관관계가 높은 종목을 동시에 매수할 때는 전체 위험 노출도 함께 계산해야 한다.
최종적으로 무엇을 연구할 것인가?
개인적으로는 Anti와 NR7을 가장 먼저 연구하고 싶다.
Anti에서는 추세 강도와 모멘텀 재가속의 조합을 검증할 계획이다.
ADX 수준, 이동평균선 기울기, 조정 폭, 거래량 변화에 따라 성과가 어떻게 달라지는지 확인하는 것이다.
NR7에서는 변동성 수축 이후 방향성이 얼마나 지속되는지 확인하고 싶다.
특히 돌파 이후 거래량, 시장 폭, 변동성 확대가 다음 몇 시간의 수익률과 어떤 관계를 갖는지 살펴볼 가치가 있다.
라슈케의 전략을 관통하는 공통점은 시장에서 반복되는 가격 행동을 규칙으로 정리했다는 것이다.
추세가 형성되고, 조정이 발생하고, 모멘텀이 회복된다.
중요한 가격을 돌파한 뒤 실패하기도 한다.
좁은 범위에서 움직이�� 시장이 갑자기 강한 방향성을 형성하기도 한다.
이런 가격 행동은 지금도 시장에서 관찰된다.
여기서 연구의 핵심은 각 현상이 발생한 이후의 수익률 분포를 측정하는 것이다.
어떤 시장에서, 어떤 국면에서, 어느 정도의 손절과 보유기간을 사용할 때 통계적으로 유의미한 기대값이 발생하는지 확인해야 한다.
라슈케가 수십 년 동안 활용해 온 방법론에서 배울 부분도 여기에 있다고 생각한다.
매매 이전에 진입 조건을 정한다.
손절가격과 수량을 계산한다.
예상한 움직임이 나오지 않으면 청산한다.
그리고 같은 규칙을 반복하면서 결과를 측정한다.
결국 장기 성과를 결정하는 것은 개별 거래의 적중 여부보다 수많은 거래에서 발생하는 기대값과 위험 관리의 일관성이다.
@LindaRaschke
The Top 50 ytd% Companies in the $SPX $SPY
outside of the top 3 names $SNDK $LITE $CIEN, what are the most surprising names to you?
I'll start: $INTC $MRNA
Use this as a reference: the trade entry and stop are structured within a single candle print, based on fixed variables for risk percentage and % of Low-of-Day execution.
1% ADR, (30% LoD execution), 0.3% Risk to Equity =
50% Capital Required
2% ADR, (30% LoD execution), 0.3% Risk to Equity =
25% Capital Required
3% ADR, (30% LoD execution), 0.3% Risk to Equity =
12.5% Capital Required
4% ADR, (30% LoD execution), 0.3% Risk to Equity =
6.25% Capital Required
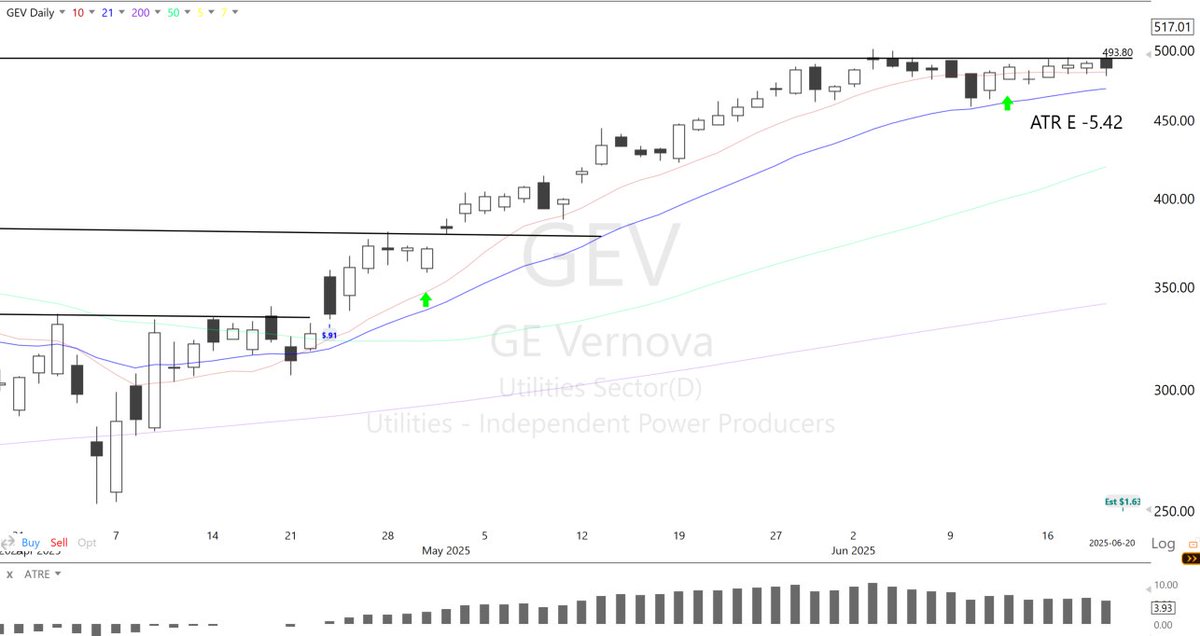
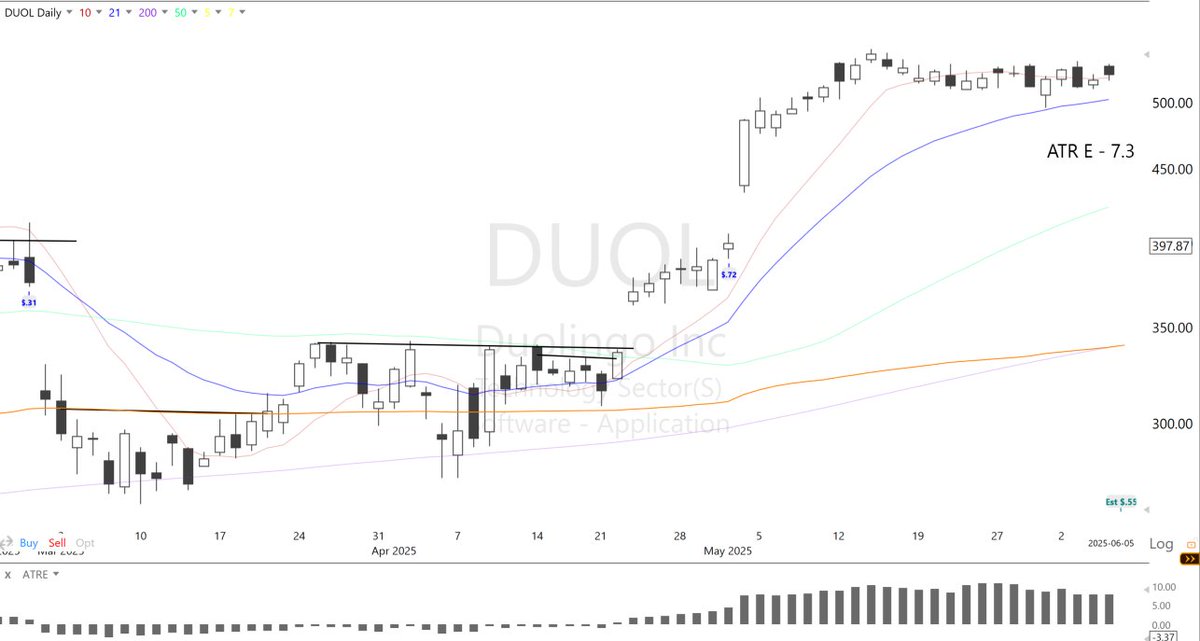
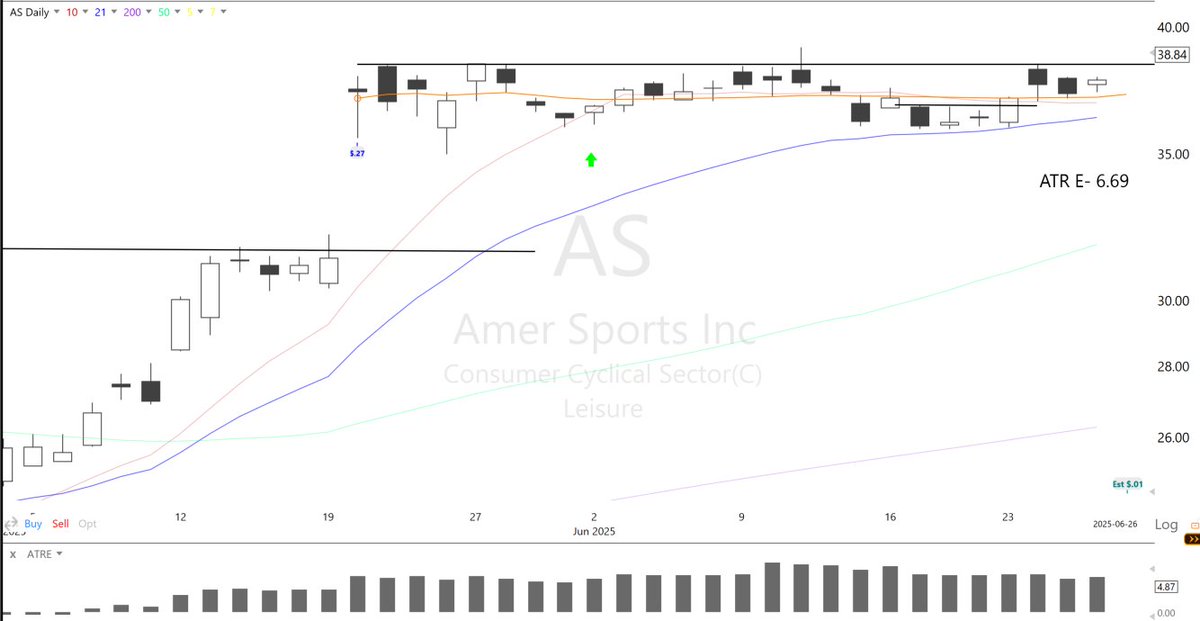
The number 1 eye-opener for me this year has to be not buying extended setups - No, it isn't what your eye thinks is extended or not, but objectively how many ATR the stock is from its 50D. Here are some great examples of tickers that look "fantastic" in picture, but every single one of them was way too extended from ATR - Could some work ? Sure, but if you want to stack probability on your end, then skip these. Just 2 months ago I would have taken every single one of them because they look solid - Uptrend and orderly consolidation. Thanks a ton for opening my eyes @jfsrevg
How I use insights from my 15 go-to liquid stocks to identify trading opportunities (you can build your own mega cap list with the same process)
1. Understand the existing technical environment of major index (both cap weighted, equal weighted, and mega cap growth oriented) $SPY $QQQ $RSP $QQQE $MGK
$SPY - 10-MA below 20-MA, 20-MA rejection, 2-months Down Trend Line
$RSP - 10-MA below 20-MA, much weaker than $SPY relative to 20-MA
$QQQ - 10-MA below 20-MA, 20-MA rejection, 2-months Down Trend Line
$QQQE - 10-MA below 20-MA, 20-MA rejection, much weaker than $QQQ relative to 20-MA
$MGK - 10-MA below 20-MA, 20-MA rejection, 2-months Down Trend Line
2. 1-Month Relative Strength Sorting to Identify Leaders — ideally focusing on the top 30% of the list. A key nuance is also considering 1-Month % Gains relative to peers for added context.
Index Reference (1-Month RS% / Symbol / 1-Month % Gain)
50% - $QQQ (-2.99%)
83% - $MGK (-1.9%)
Liquid Leaders
100% - $PLTR +18.7%
92% - $MSFT +1.93%
92% - $HOOD +21.4%
88% - $NFLX +4.04%
83% - $GOOGL (-3.03%)
83% - $MSTR +19.52%
50% - $TSLA +9.44% (included here because of top 5 1-month % gain that's not captured in top 5 RS ranking)
3. Check Individual watch-listed names for RS technicals, where are their price action positioned relative to the indexes highlighted above
$PLTR - The only name trading above all MA, including 100-MA. Down trendline is already breached on 9th April. Immediate resistance at previous high of 25 march.
$MSFT - Already Reclaim 10 & 20-MA, but rejected 50-MA on latest close. Immediate 50-MA resistance coincide with re-test of previous high from 25 march.
$HOOD - Already Reclaim 10 & 20-MA but still remains in lower high. Distance to previous high (similar to $PLTR and $MSFT) is 10% away.
$NFLX - Attempted Reclaim of 20-MA with 3 days of volatility contraction. Down trend channel intact with 2 lower highs, and 2 lower lows. 7% away from previous high
$GOOGL - Already Reclaim 10 & 20-MA, but 6.8% away from 50-MA on latest close. Weaker 1-M RS relative to $HOOD and $NFLX because $GOOGL was sold straight down since Q4'24 post earnings gap on 4th feb.
$MSTR - Trading above all MA, excluding 100-MA. Much stronger than $BTCUSD. Has yet to have a consecutive close below 200-MA since 10th March 2023. Bounced off 200-MA on 5 occasion in past 25 months. Building a base off 200-MA bounce
$TSLA - Below all MA. 1-Month % gainer mainly because of high ADR% of the stock (8.8% for 770B Mega Cap!). May be in consolidation off $220 lows (5th week)
4. Track for VCP style setup at less than 3xATR% multiple extension above 50-MA. Anything more, the most optimal entry is already missed imho.
It's pretty clear which names I'll be focusing on from the list moving forward, right?
My Rule: Relative Strength First, Setup Second—Always.
I shared the quoted tweet 3 weeks ago, sorted the 15 stocks via RS strength. Note that $MSFT ranked 2nd in RS despite a modest 1-month gain of just 1.93%, 7th in 1-Month % gain ranking.
The following is the 1-Month % gain sorted from biggest gainer. I put an * behind if they were not captured in my top 7 RS stock earlier.
$PLTR +44.76%
$MSTR +36.27%
$NFLX + 23.84%
$COIN +17.82%* (Note: 7.3% ADR)
$HOOD +15.91%
$MSFT +14.91%
$TSLA +8.98%
The first step in pre-market prep is identifying relative strength—or weakness, if you're trading inverse setups—before diving into charts or screeners. A clean technical setup can still be a laggard if its peers have already broken out and run, eg. $NFLX vs $SPOT after 10 straight sessions out of base.
Outperformance requires positioning ahead of the prevailing consensus and narrative shifts, and you definitely should not chase if you have already missed the move.
"What changed everything for me was recognizing that I’d been chasing setups long after the best entry was gone.'' - David Ryan, 3 time US Investing Champion 1985,86,87
During the recent sell-off, 65% of the 17 technical metrics I cared about the most, signaled oversold. Historically about 48% is what is needed to be statistically near a tradeable short-term bottom in the stock market. I also thought volatility would decline from the Vix index hitting 50 on Monday which implies over a 3% daily move per day for the next 30 days. While following the 6% bludgeoning on Friday, the market saw more downside on Monday and Tuesday (1.8% further losses combined at the close and even more violent intra-day), that all changed today.
I said in interviews earlier this week that the three other big market drawdowns we have seen Covid, GFC and the Tech Bubble were all structural in nature but the tariff issue could be fixed with a tweet. A global pandemic, bad bank balance sheets or technology over investment issues did not have overnight solutions. But the current problem could be fixed overnight by rolling-back/delaying tariffs.
On Monday, there was a pre-cursor to today when the S&P went from being down 4.7% to up 3.4% intra-day. This was over an 8% intraday gain from trough to peak) even though the S&P ultimately closed down slightly. This rally was all on the hopes that tariffs could get rolled back.
In addition, Scott Bessent was put in charge of negotiating the tariffs with Japan earlier in the week and that gave me hope that a less disruptive trade policy could be forthcoming. He worked with George Soros when they were betting against global currencies like the sterling and yen before starting his own hedge fund. Bessent understands global markets.
Also President Trump referred to an interview by Jamie Dimon (the CEO of $JPM) and @MariaBartiromo today and that probably influenced his decision to delay tariffs along with the action of the bond & stock markets. When one of the best CEOs in the world said a recession is now “a likely outcome,” that probably got the President’s attention. In addition when enough market cap is wiped out in the stock market, the wealth effect can cause a recession. The recent selloff in the credit & bond markets was arguably more concerning.
https://t.co/P5HmqORKyR
The S&P closed at 5671 on April 2nd before reciprocal tariffs were announced. I could see upside to that level from current levels but I would use that level to aggressively derisk. The other level I am watching to aggressively derisk is 28 on the Vix which was the most recent peak on 3/10 or 22 which was the level on April 2nd when the reciprocal tariffs were announced after the close. I would also keep an eye on credit metrics that had started to deteriorate at a rapid rate recently likely driven by global deleveraging.
There are only two days better than the 9.5% S&P rally today in recent history and both were during the GFC on 10/13 (+11.6%) and 10/28 (+10.8%.) Unfortunately despite an additional 6.9% gain over the next five trading days, the market ultimately went down another 28% from its close on 10/28 before it reached its ultimate low on 3/9/09. This is despite the S&P being down already 40% by 10/28 from its high on 10/09/07. There were 7 days during the 1930s that had over 9.52% gains as well but that is so far back, I am not sure it is relevant given the changes in the structure of the stock market today.
When I gave my Top5 Picks to start the year, I led with cash invested in money market funds yielding over 4% and had no Magnificent 7 stocks on that list for the first time in years. My conservatism was driven by:
1) the impact of new government policies
2) the S&P trading at a lofty 25x trailing PE
3) fears of an AI digestion phase.
All those issues remain and though the PE is down to 23x trailing now, it is likely that estimates for over 10% EPS growth for 2025 is too high. As an aside, estimates have been coming down since mid-last year which investors find easy to ignore when the Fed is cutting rates and the stock market is going higher. 19x trailing for PE is the average when inflation is between 2.5-3.0% and mid-teens for a recession/stagflation scenario. Obviously that is a lot lower than current levels.
The next big fundamental test for the market after this huge one day rally is bank earnings on Friday morning which include $JPM, $WFC and $BLK. While I believe, the current rally should technically have more room to go in the near-term, I am a fundamental investor when thinking about the longer-term.
To paraphrase Charles Darwin, I am taking the market day by day given daily changes in tariff policies and trying to stay “adaptable to change.”
Conditions are bearish and point to much lower prices, but I've learned the hard way that sometimes when the charts look extremely bearish, it's because institutions have "painted" the tape that way. All you can really do is collect some gains as the market plunges.
Go back and examine previous periods where a market has had more than 14 closes below a 5 SMA on the dailies. Less than 5% of the time has it has led to a bottom. There can be tradable reactions up, but then the market turns down to make a lower low.
A few things I have learned since I started trading in 1998.
This isn't a bullish post or a bearish post, just some key lessons that I have learned over time:
- the market knows more than we do.
- you will rarely win a fight with the tape - you might get lucky every so often, but luck is tough to duplicate over years.
- the S&P 500 averages a 5% pullback every 3 1/2 months and 10% pullback every 11 months, build this into your thinking. $SPY is -6.5% right now from the highs.
- most popular stocks, tech and growth, can pullback much more than the index, which for many is why the 5% pullbacks can feel like a blowout.
- the index could turn up at any time, when it does, it will show up on the charts.
- you don't have to buy at the very bottom or sell at the very top to make a lot of money along the way.
- stocks with shallow pullbacks in uptrends are a much different buy than trying to chase stocks down the chart.
- charts breaking out in market pullbacks should get top priority.
- I don't buy stocks below the 50-day MA. Doesn't make it right or wrong, but it works great for me.
- if the charts don't set up the way you want them to, or if high volatility is a concern, it's ok to do no buying or small buying, follow your stops on open positions and wait until you get a better read of the landscape.
- I have been buying stocks fairly consistently over the past few weeks, small buys mostly - but it's mostly not the same stocks I was buying 3-6-12 months ago.
- I might be adding to my 2024 winners again, or not, the charts will tell me.
- charts in uptrends and breaking out work much better for me than charts rolling over into downtrends.
- when volatility picks up considerably, reduce your trading activity, reduce your position sizing and reduce "all-in" sector bets.
- small losses are better than big losses - also, very often a small position is better than no position, if you have a valid buy signal.
- if you want to make aggressive pullback buys, do it small and use stops. If they keep pulling back, stop buying. If the market has a confirmed reversal, look to add on the way back up.
- buying a stock "lower" because you think it is going "higher" is not an actual strategy.
- waiting until a stock proves itself higher is a strategy than many professionals use.
- it doesn't matter what happened last time, or what happens 15 out of the last 20 times, each market is unique and has its own set of circumstances.
- the "story" doesn't stay the same forever; you need to pay attention to major new information if the market says it's relevant.
- there is always something breaking out somewhere, pay attention to those charts.
- where many investors and traders run into difficulty is not managing risk - not using any type of stop loss or risk management, buying and adding to stocks in downtrends, over concentration in tech and growth etc. Over-trading, positions too big.
- determine how much you are willing to risk/lose before you take a position and stick to that.
- more cash is the only true hedge - everything else has volatility.
- for 95% of retail (non-institutions), hedging is a fallacy that won't overcome having no risk management plan. Manage your risk at the buy with stops and correct position sizing. Assume that you will be wrong and define your risk at the buy.
$app paid the price of its "not cleanest" setup.
Even after years of trading, I still get reminded why waiting for the A setups is key to long term success.
👇🏼👇🏼