I WARNED YOU ABOUT THIS DUMP AT $83K.
Now it’s at $58K.
And the path is still unchanged:
$83K → $65K → $55K → $45K → $65K → $130K → $200K
The bear market is only 50% complete.
Do you honestly think the market will let everyone calmly buy the bottom before the next historic run?
It won’t.
When Bitcoin loses $55K, billions of dollars in leveraged positions will be liquidated.
Stops will trigger.
Forced selling will accelerate.
And once the cascade begins, it will be unstoppable.
At $45K, your portfolio will be bleeding.
Your timeline will declare the bull market over.
The same influencers calling for new highs today will suddenly tell you Bitcoin is heading below $30K.
Most traders will believe them.
They will sell at the exact moment they should be preparing to buy.
And here is the part almost nobody understands:
That final collapse will not destroy the opportunity.
It will create it.
That will be the moment to buy.
Exactly when buying feels the most painful, dangerous, and completely irrational.
When leverage is destroyed, weak hands surrender, and everyone becomes convinced Bitcoin is going lower, that is when the final bear-market bottom will form.
This is how major market bottoms form.
The crowd will see the end.
The traders who remain patient will see the final accumulation window before $200K.
I expect the bear-market bottom to arrive in October.
Then the move nobody believes is possible begins:
$45K → $65K → $130K → $200K
When Bitcoin reaches the bottom, fear will be everywhere, and it will feel like the entire cycle is over.
That is exactly when the next call will matter most.
Because surviving the decline is only half the trade.
The other half is having the conviction to buy when everyone around you is convinced you are making a catastrophic mistake.
Follow me and turn on notifications so you don’t miss that call.
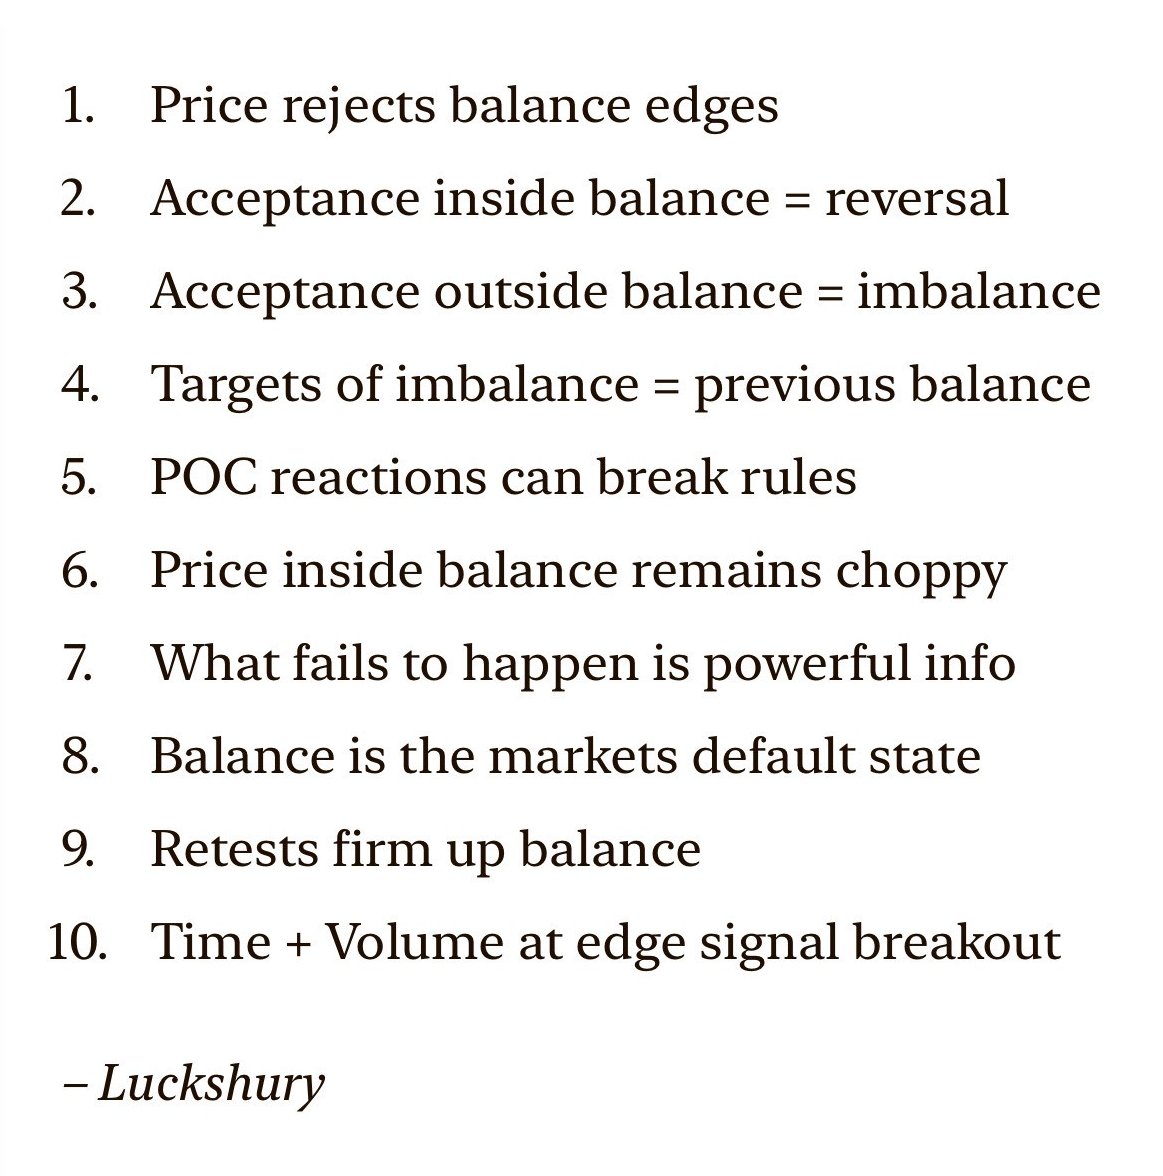
Market profile
only a few elements I'm constantly monitoring.
> poor highs/lows
> gaps/single prints
> selling/buying tails
all 3 being inefficiencies which i'm looking for price to eventually come back to and complete the auction.
I recorded a 20-min video on how to set up footprint charts, including settings and use cases
0:14 - market orders
0:52 - passive/aggressive flow
1:48 - cluster vs profile
2:38 - dual cluster mode
3:51 - tick sizes
6:08 - other render & text types
7:33 - delta shading
8:20 - big player absorption
9:33 - colour settings
9:48 - point of control
10:32 - imbalances
13:40 - aggregating footprint
15:08 - open interest
17:15 - bar stats
17:57 - use case
Internal Range Liquidity ( IRL ) And External Range Liquidity ( ERL )
95% Of traders trading Without bias ..! Thats why they are Failing..!
Here after you are not..!
This is How i Find my Daily Bias using IRL & ERL concept 👇
A thread 🧵
How to Trade the MACD Indicator
0:00 - What is MACD?
0:14 - Uses of MACD
0:17 - Histogram
2:10 - Pullbacks
2:38 - Divergences
3:46 - Advanced Strategies
4:06 - Support and Resistance
5:18 - Bollinger Bands
6:24 - EMA Bands
POC Shifts
Good for developing an intra-day bias inside developing value.
Looking for consecutive shifts in the time point of control in a given direction.
The continuous shift signifies an imbalance in directional value.
Done inside a developing day.
...example below ↓
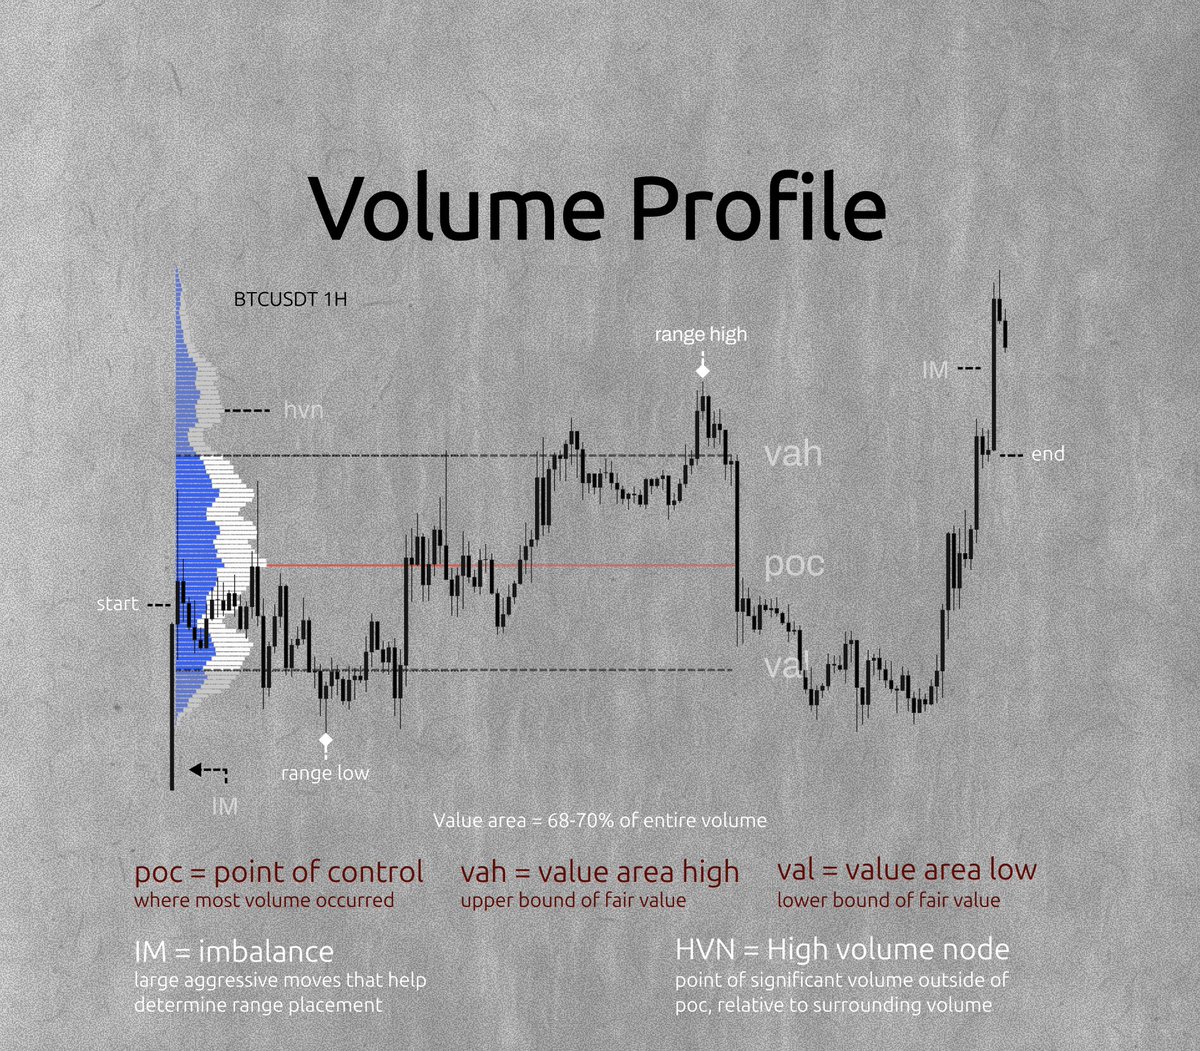
COMPLETE VOLUME PROFILE TUTORIAL
0:30 - foundations
0:55 - tick size
2:14 - profile components
2:42 - volume gaps
2:57 - high volume nodes
4:12 - visible range tool
4:57 - fixed range tool
5:38 - trending moves
6:53 - reading the profile
8:49 - ranges
9:20 - selecting a range
10:38 - reading a range
11:51 - line in the sand levels
12:43 - balance vs imbalance
13:39 - prior areas of balance
14:52 - high conviction plays
16:33 - other tools
WYCKOFF VOLUME CONCEPTS FOR BEGINNERS
1. ACCUMULATION (Smart Money Buying Quietly)
What Accumulation Is
Accumulation is when big institutions quietly buy shares after a downtrend.
They don’t want the price to explode yet — they want to load up without attracting attention.
What You See on the Chart
- Volume dries up → selling pressure is fading
- Price moves sideways → forming a base
- Down‑moves on low volume → weak sellers
- Up‑moves on slightly higher volume → early demand
- Shakeouts / springs → smart money removing weak hands
Wyckoff’s Key Volume Signals
- Low volume at lows → selling is exhausted
- Increasing volume on rallies → demand returning
- Climactic volume → final panic selling before reversal
- Spring + high volume → strong accumulation confirmation
What It Means
Smart money is preparing for a new uptrend.
This is where future leaders are born.
---
2. DISTRIBUTION (Smart Money Selling Quietly)
What Distribution Is
Distribution is when institutions unload shares after a big uptrend.
They sell slowly, carefully, without crashing the price — yet.
What You See on the Chart
- Volume increases near the top → heavy selling
- Price moves sideways → topping range
- Up‑moves on low volume → weak demand
- Down‑moves on higher volume → supply taking control
- Upthrusts / bull traps → smart money selling into strength
Wyckoff’s Key Volume Signals
- High volume at highs → supply entering
- Lower highs + heavy volume → distribution phase
- Upthrust + high volume → fake breakout, smart money selling
- Breakdown with volume → markdown phase begins
What It Means
Smart money is preparing for a downtrend.
This is where trends die.
I recorded a quick 8-min video on the VWAP
0:05 - what is VWAP
0:27 - why I like it
1:20 - setting it up
3:04 - vwap slope
3:49 - directional bias
5:18 - vwap bands
6:38 - strong trends
7:24 - choppy ranges
New Monday:
1:00 Bullish Flag
2:15 Bearish Flag
3:00 Cup with handle
5:01 Bullish Rectangle
6:00 Bearish Rectangle
8:00Bullish Pennant
9:-Double tops &Bottom ETC
You only need one setup. This could be it 👇
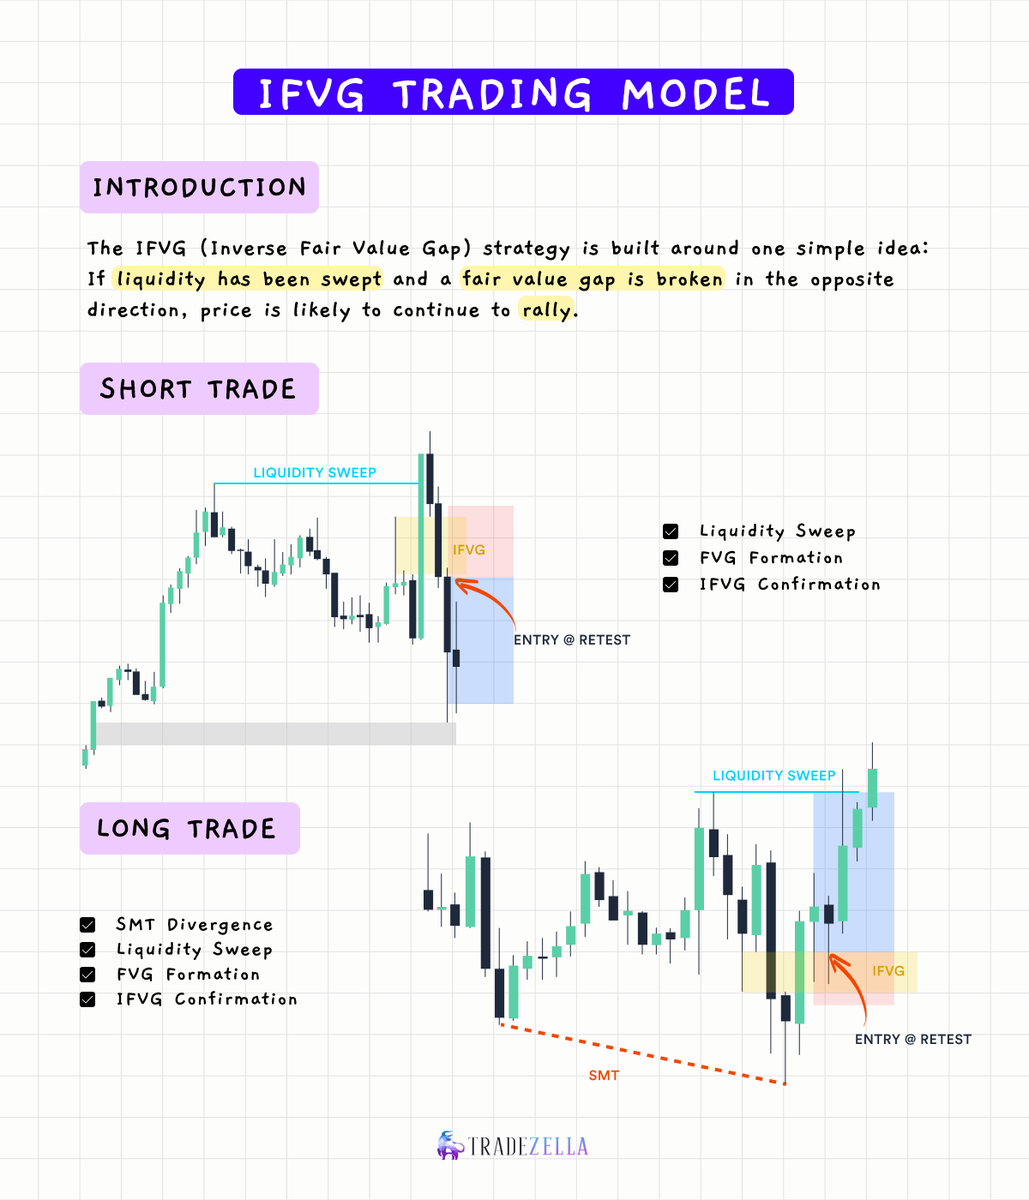
Liquidity swept → FVG breaks → you catch the continuation
Learn exactly how to confirm, time, and execute the Inverse Fair Value Gap strategy step-by-step.
Like & reply "IFVG" to get the playbook in your DMs!