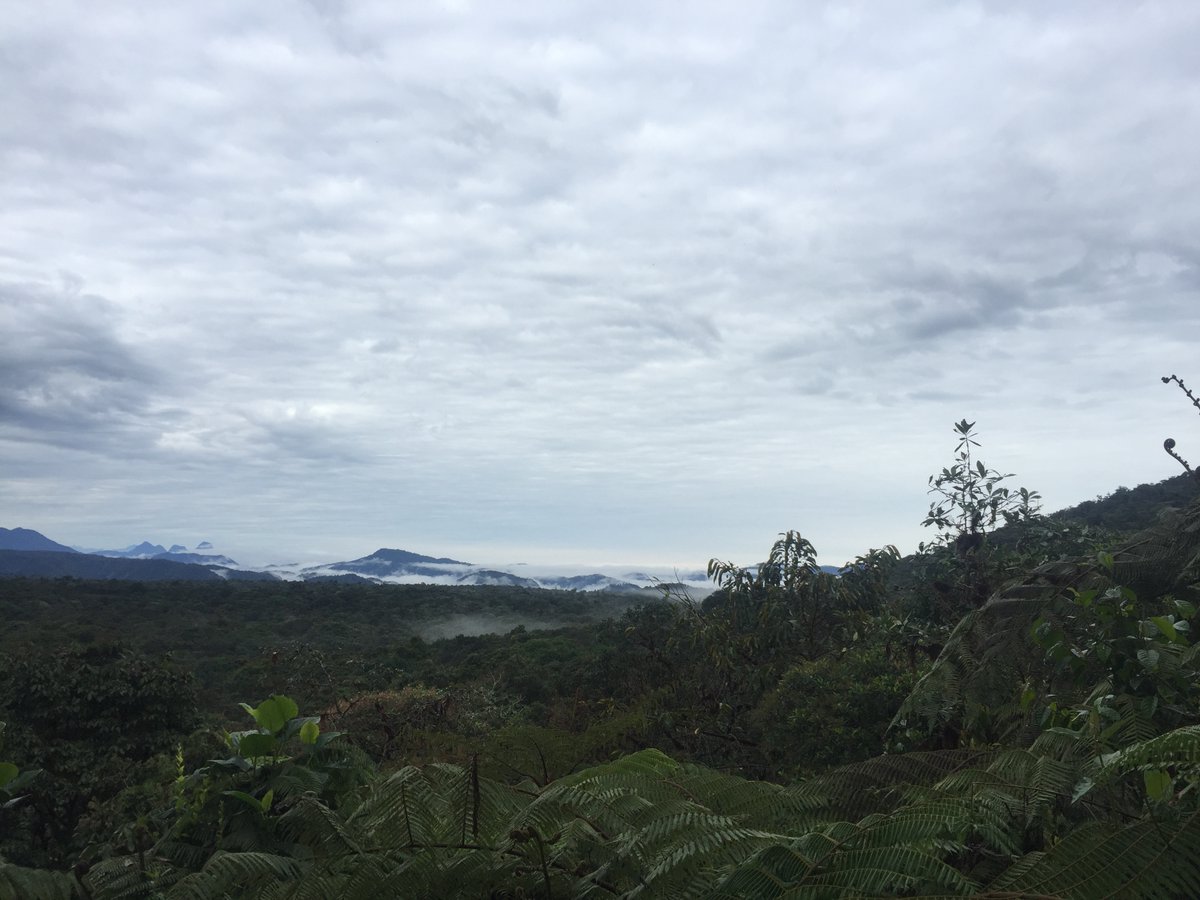
This shot was taken on the last night in Bicuar National Park. It sums up how awesome it was to carry out fieldwork here. @e3dtp@TheBotanics@GeosciencesEd
That's a wrap! Fantastic 2 weeks in West Kalimantan, Borneo, working with colleagues from BRIN and Bogor to set up permanent monitoring plots in Kerangas and peat swamp forests. Amazing biodiversity!
🌿Excited to share our new study in New Phytologist! 🌿
Polyploidy is a major force in plant evolution, but is understudied in the tropics. We find that polyploidy arose multiple times in Inga, a characteristic Neotropical tree radiation (1/n) 🧵.
🔗 https://t.co/HOIVF25jDC
Introducing a new way to see our planet! 🌍 🛰️ Using Google DeepMind’s new geospatial AI model, AlphaEarth Foundations, we’re making satellite data more analysis-ready, packing a year of info into each pixel. https://t.co/bxqV7bnXkG #EarthEngine#AIforGood
Hyperdominance in the world's most diverse savanna. The Cerrado has more than 1,600 tree species, and yet just 30 make up half of all trees. Congratulations to Facundo Alvarez and colleagues for this pan-Cerrado analysis with hundreds of plots.
https://t.co/SzZS13nDUY
With ever more forest satellites in the sky, scientists on the ground are needed more than ever, especially in tropical forests!
Our work with @GEOSEC2025@ESA_EO@esascience and partners world-wide.
https://t.co/4ZajSlrUhF
Forest and savannas are the two largest biomes in the tropics, but how do they compare in terms of beta diversity? Here we explore patterns of phylogenetic beta diversity in Africa.
https://t.co/W3cS9DwULS
Visualize genomic data with ease using gggenomes, an R package that extends ggplot2 to handle and display genomic information intuitively. Whether you’re comparing genomes, analyzing features, or showcasing synteny, gggenomes provides the tools you need to turn complex genomic data into clear, informative visualizations.
Why use gggenomes?
✔️ Genomic-focused visualizations: Specifically designed for handling genomic data, including features, alignments, and comparative analysis.
✔️ Versatile and modular: Create detailed and layered plots for diverse genomic scenarios with flexibility for customization.
✔️ Built on ggplot2: Leverages ggplot2’s familiar framework, making it easy for users to adapt and enhance their visualizations.
The example visualization shown here is taken directly from the gggenomes GitHub repository, demonstrating how it transforms genomic data into compelling plots: https://t.co/FzE2wNzHeP
Curious to learn more about creating data visualizations in R and using tools like ggplot2 and its extensions? Check out my online course, "Data Visualization in R Using ggplot2 & Friends!"
Learn more: https://t.co/ztlEzoEDWv
#RStats #ggplot2 #Rpackage #R
1️⃣ 🌍 Fresh out in #Science! The Asian tropics are among the most biodiverse places on Earth, but where does all that diversity come from? 🤔🔍 We used 🌴 phylogenomics and 🦴 new fossils to unravel the roles of different regions in generating and distributing species! #Evolution
Woody plants with hooks in Congo.
Hugonia sp. (Linaceae) and Ancistrocladus sp. (Ancistrocladaceae), similar habitat, similar strategies from two very distantly related families.
Interested in joining the ForestGEO team? 🌳 We're hiring a Staff Scientist! 🧑💼 Click to learn more about our opening for a Research Ecologist in our Central and South American Forest Dynamics Plots. 🌎Apply now! https://t.co/Ibf1lhKHMN
Amazing to see this study on my favourite plant genus: Forget-me-nots (Myosotis) phylogenomics of a rapid radiation in New Zealand
https://t.co/72S0vxV9Il
🌳 The First 100 Years of Research on Barro Colorado: Plant and Ecosystem Science (Volumes 1 & 2) are online
📚 The first of a series of volumes on the scientific #research & history of #STRI on BCI is now available online in English.
Download here https://t.co/vmx6Ev2UJ7
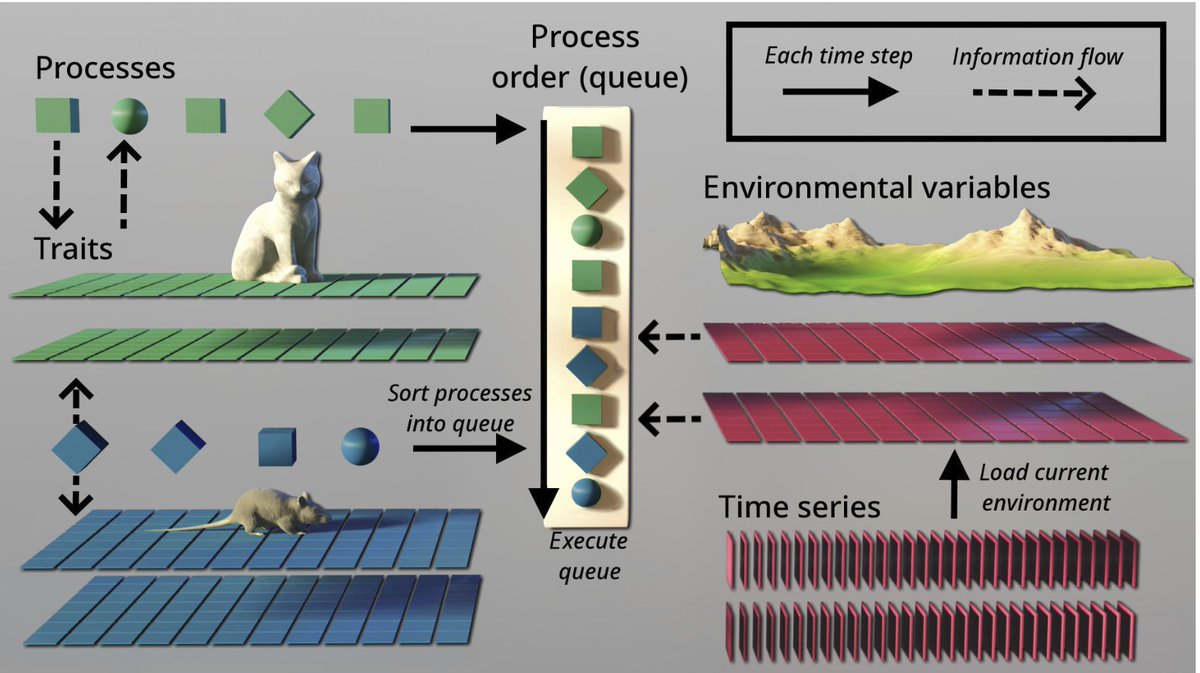
Our metabolismus-based metapopulation range model for simulating species range dynamics is online @MethodsEcolEvol. It is a framework in which you can build your own model structure or use our functions, including biotic interactions. Check it out: https://t.co/JYCZfVRgUW
Article just published in @MethodsEcolEvol ! In this study, we introduce a new method to automatically extract objective and interpretable seed morphological traits from images. https://t.co/jbmF75hsUx 👇🧵(1/7)
Happy that our paper on Tree Competition using our R package TreeCompR got published 🎉 - Check it out here: https://t.co/zX4Zb1NBP5
Try out our package: https://t.co/sKL76Wwf7s