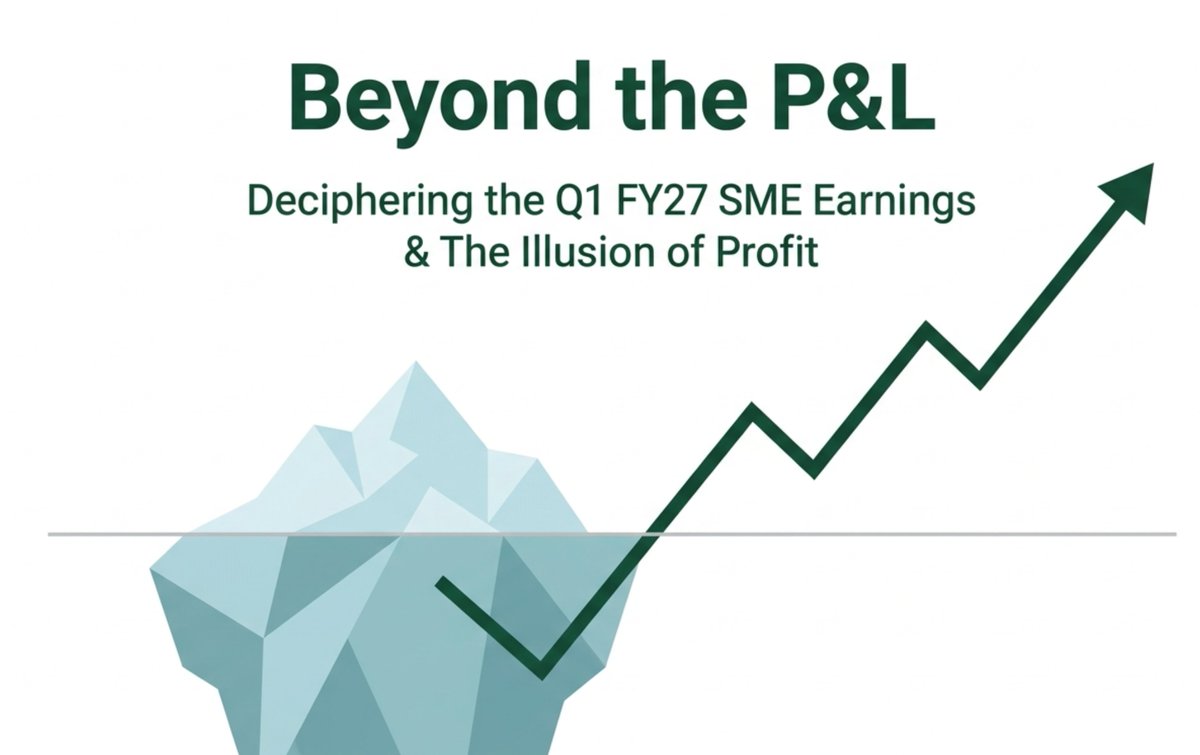
Famous SME Companies That Delivered Excellent Q1 FY27 Results 🔥🔥🔥
🔹 Susan Electricals
🔹 Hoac Foods
🔹 Akiko
🔹 TAC Infosec
🔹 V-Marc India
🔹 Telge Projects
🔹 OBSC Perfection
🔹 Sathlokhar Systems
🔹 Monolithisch India
🔹 Afcom Holdings
🔹 Khazanchi Jewell
🔹 Exato Technologies
🔹 Z-Tech (India)
🔹 Msafe Equipments
🔹 Supreme Power
🔹 Asarfi Hospital
🔹 Sugs Lloyd
🔹 KRM Ayurveda
🔹 Bondada Engineering
The numbers are certainly impressive across many of these companies, with strong YoY growth in sales, EBITDA and profitability. For example, Susan Electricals reported Q1 FY27 revenue of ₹95.4 Cr versus ₹25.2 Cr a year ago, while net profit turned positive at ₹6.39 Cr from a loss in the year-ago quarter.
A company posting excellent results means the business appears to be growing and generating accounting profits. But the real question is:
“Where is the cash?” 💰
🔹 Check Operating Cash Flow - is the company actually generating cash from its business?
🔹 Compare Operating Cash Flow vs Net Profit - if profits are rising but cash generation remains weak, investigate why.
🔹 Check Receivables / Debtors - are sales growing because customers are genuinely paying, or because outstanding receivables are piling up?
🔹 Check Inventory - unusually high inventory growth can sometimes indicate working-capital stress.
🔹 Check Borrowings and Debt - is the company funding growth through internal cash generation or excessive debt?
🔹 Check Working Capital - especially important for smaller companies where a large portion of profits can get stuck in receivables and inventory.
🔹 Check Balance Sheet strength - cash, debt, receivables, inventory, net worth and other key items.
🔹 Check Cash Flow Statement - don't blindly trust only the profit & loss statement.
🔹 Check Promoter holding, pledging and dilution as well.
Remember:
Profit is an opinion.
Cash flow is the reality.
These companies can be added to the SME study/watchlist, and then we should dig deeper into their annual reports, balance sheets, cash flows, concalls, order books, management commentary and valuations before taking any investment decision.
Disclaimer: This is purely for educational and research purposes and is not a buy/sell recommendation.
New campaign by https://t.co/4KakOdehQy 🚀
MentionOS is now live on USA Today, Business Insider, Yahoo Finance, Associated Press, Financial Post + 200 other media outlets already!
Our launch offer ends soon, and the $888 package will be gone tomorrow.
Stop telling Claude, "do this."
Stop telling Claude, "write code."
Stop telling Claude, "fix this error."
You're actually treating a senior AI like a junior intern.
Here are 8 prompts you can copy and paste directly:
This is how I think about strategies at a volatility hedge fund.
I like to consider ourselves a blend of quantitative and discretionary trading. The primary reason is that trading from the long-volatility side of the market constantly reminds you of a fundamental problem: the events that matter most are often the events for which you have the least amount of data.
Outlier events, structural breaks, changes in market microstructure, and shifts in participant behavior do not always provide enough historical observations to build a purely quantitative system with complete confidence. At the same time, relying entirely on human intuition creates its own set of problems: bias, inconsistency, emotion, and the tendency to see patterns that may not actually exist.
This hybrid approach makes the two disciplines serve as safeguards for one another.
Here is an example of how that infrastructure works:
1) Idea generation begins at screen observation.
One of the traders notices something interesting in the market: a recurring behavior, an unusual relationship, etc.
Rather than immediately searching through data for something profitable, the observation comes first and is then passed to the quantitative side of the business. I think this distinction is extremely important. It creates a natural safeguard against data mining and overfitting. We are generally starting with a market hypothesis and asking the data whether it is real, rather than starting with the data and searching endlessly until we find something that looks profitable.
2) The quantitative arm attempts to validate or kill the idea.
Once the idea reaches the quant side, statistical validation begins.
Can we isolate this specific source of alpha? Does it persist across different periods and regimes? Is the relationship statistically meaningful? The objective at this stage is not to prove the trader right. It is to independently validate or negate the hypothesis.
3) If the edge survives, we begin designing the strategy.
Assuming the edge holds up, the discussion moves back and forth between the trading and quantitative teams. This is where instrument selection, tenor, strike, sizing, liquidity, and implementation all begin to matter.
An edge can be completely real and still be capitalized on poorly. Identifying the underlying phenomenon is only half the battle. But at this stage, we have our first real version of a “strategy.”
4) Then the real testing begins.
We strip out an OOS and begin testing the strategy historically.
We incorporate practical assumptions around transaction costs, market impact, capacity (NBBO tests). We want to know whether the edge remains economically meaningful after accounting for the realities of actually trading it.
The standard should be whether that evidence remains convincing after you have done everything reasonable to try to break it.
5) Once validated, the strategy is formally documented. Before anything goes into production, a formal write-up is completed and signed off on by every member of the team.
The document defines exactly what we believe the edge is, why we believe it exists, the statistical evidence supporting it, how we intend to monetize it, and the risks surrounding the implementation.
Just as importantly, we explicitly define failure conditions and escape valves. What would cause us to reduce risk? What would cause us to stop trading the strategy entirely? Conversely, what milestones would justify increasing capital?
I think this is an underrated part of systematic trading. You want to define what failure/ success looks like before you are emotionally or financially invested in the outcome.
6) The strategy enters production slowly.
Once approved, the strategy is introduced with a relatively small amount of capital. We monitor realized transaction costs, fills, liquidity, market impact, signal decay, and whether the live return distribution resembles what we expected.
(Continued below)
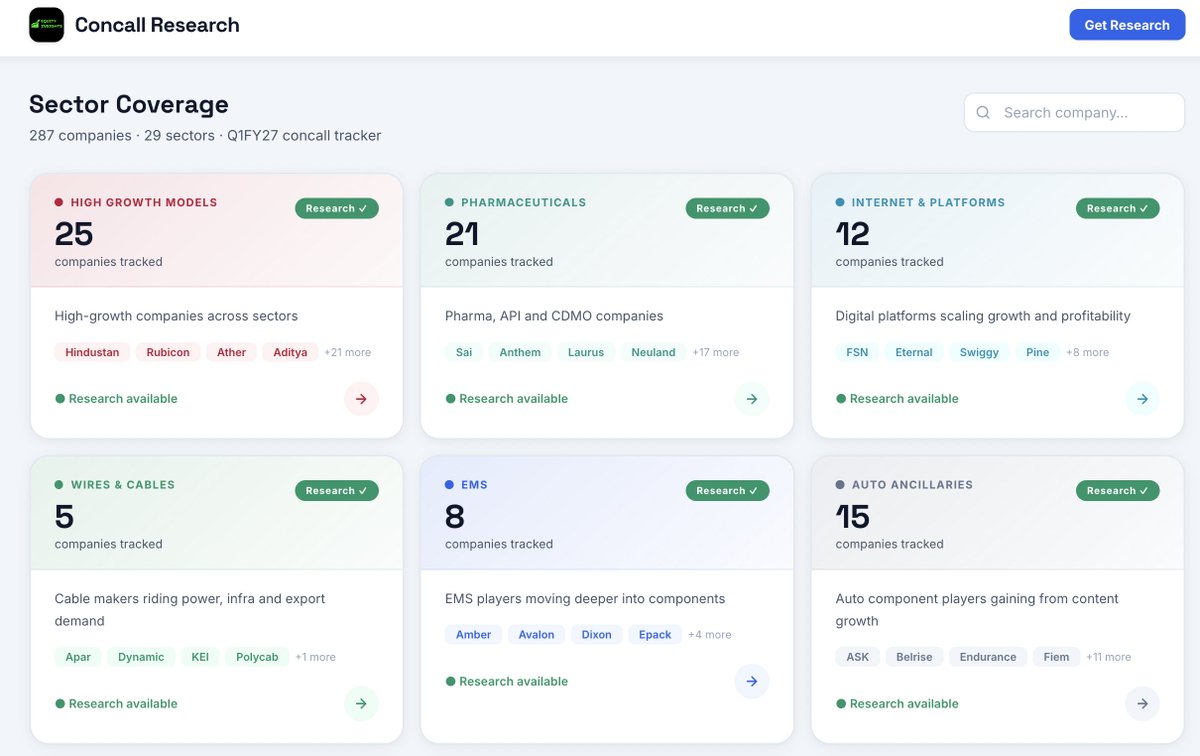
We have updated version of Concall Research
Q1FY27 concall tracker now covers 287 companies across 29 sectors
You can now track sectors like Pharma, Platform, Gold Finance, MFI, Affordable Housing, Value Retail, Jewellery Retail, Wires & Cables, Hospitals & many more
@SBK_analysis@_anujsinghal@CNBC_Awaaz A big thank you to all CNBC family .
Pointing out what’s wrong isn’t criticism it’s about keeping the system clean. It indirectly helps regulators like SEBI. Many media house stay silent out of fear, but real improvement starts when someone speaks up.
@_anujsinghal Pointing out what’s wrong isn’t criticisim it’s about keeping the system clean. It indirectly helps regulators like SEBI. Pee business stay silent out of fear, but real improvement starts when someone speaks up for making it correct.
@ChanderBhatia01@vishalmmotwani This area such indont think you are looking reality actual grounded reality . Please walk 1km daily for all direction for four days and buy consumption thing , then comments this GDP number
The new Oportunity list :
Q1, FY27
Only for study and observation purpose .
No buy/ sell recommendations.
I have taken some inputs and added sector, key triggers and guidance .
Please find below .
https://t.co/gzs3pqGkxa