TRENDLINE STRATEGY, CLEAN & PROFESSIONAL INSIGHT.
Trendlines give structure clarity, showing where buyers step in and where momentum continues.
✅ Higher Lows — foundation of a bullish trend
✅ Break of High — your entry trigger
✅ Stop Loss — placed at the recent swing low
✅ Trail SL — follow the trend until it weakens
✅ Trendline Close — your clean exit signal
Simple, disciplined, and perfect for traders who want structure‑based precision.
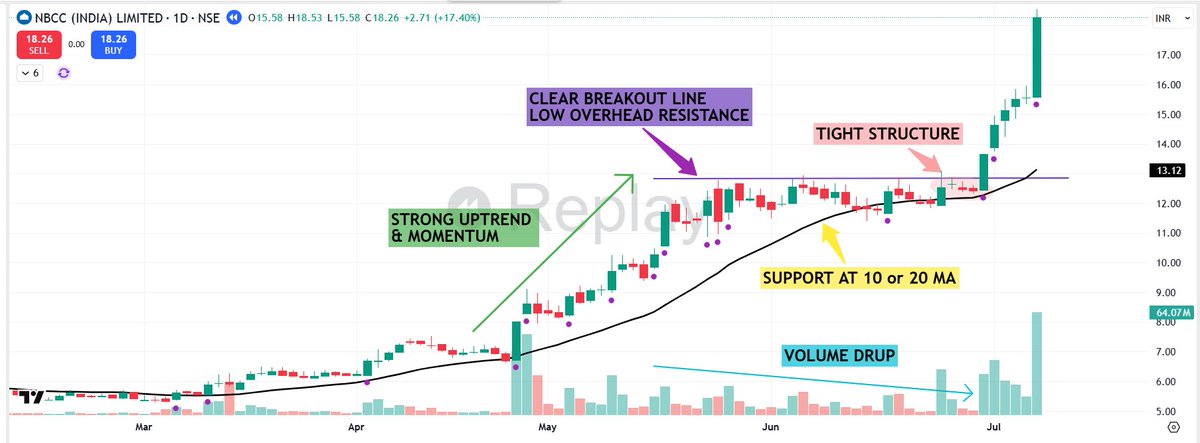
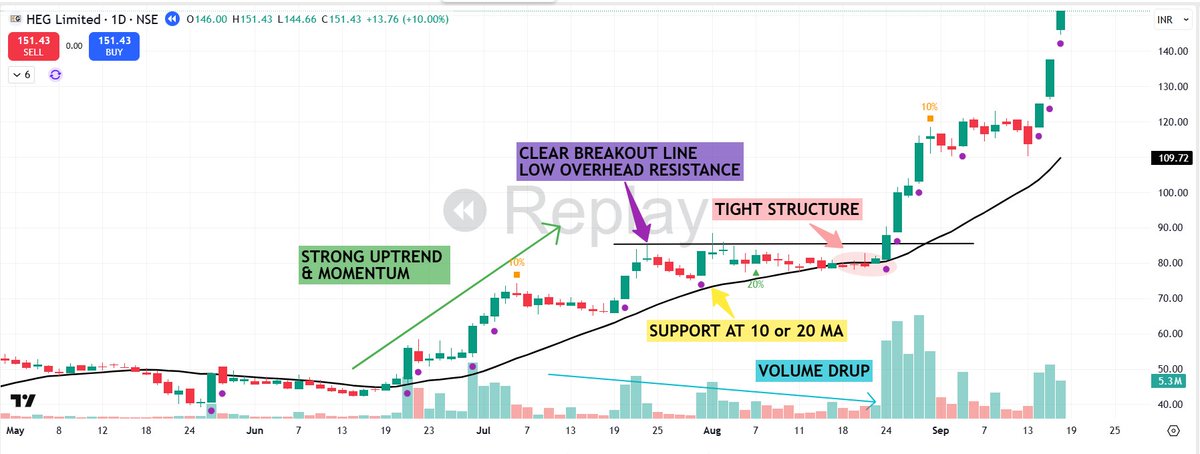
🟢7 Characteristics of a Great Breakout Setup 👇
1⃣Tight Structure :
The volatility inside the base must "DRY UP". You want to see the daily ranges getting smaller & smaller - Price compressing like Spring. Each contraction tells you that weak hands are out , Sellers are done.
2⃣Strong Uptrend & Momentum :
Before forming its base, the stock should already be up at least +50%, often closer to 100%. True leaders don't start from lows- they continue from strength.
3⃣Support at 10 or 20 MA :
A strong stock respects its moving average. During the base, price should hold MA 10 or MA20.
4⃣Volume Contraction & Accumulation
Inside the base, Volume should contract showing reduced supply - but you also want to see accumulation spikes.
5⃣Relative Strength leadership:
The stock must be stronger than the indices and its sector peers.
6⃣Strong Catalyst or Theme:
Every big winner has a reason behind it. You want clear fundamental fuel
7⃣Clear Breakout Line & Low overhead Resistance:
The Breakout level should be obvious - tested multiple times , forming a clean pivot
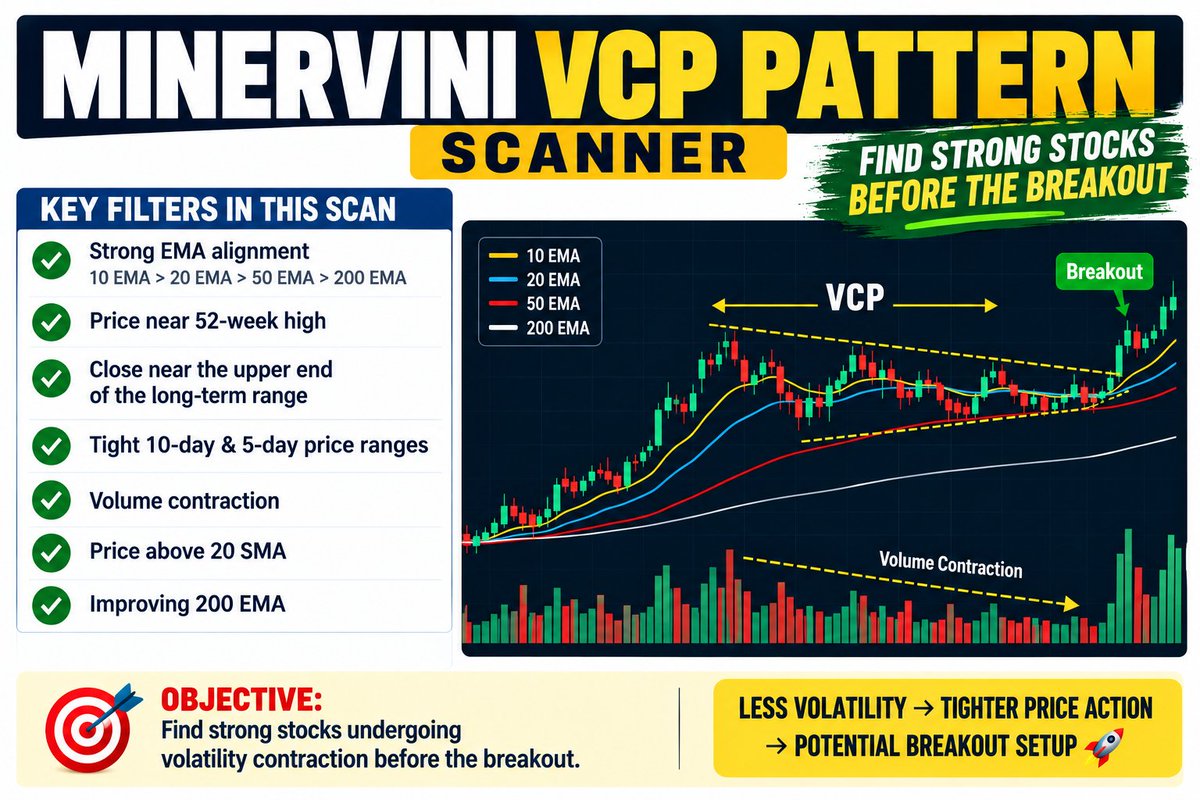
⭐ MINERVINI VCP PATTERN SCANNER
Looking for stocks that are quietly building pressure before a potential breakout? 👀
My VCP scanner focuses on:
✅ Strong EMA alignment
10 EMA > 20 EMA > 50 EMA > 200 EMA
✅ Price near 52-week high
✅ Close near the upper end of the long-term range
✅ Tight 10-day & 5-day price ranges
✅ Volume contraction
✅ Price above 20 SMA
✅ Improving 200 EMA
🎯 The objective:
Find strong stocks undergoing volatility contraction BEFORE the breakout.
Less volatility → tighter price action → potential breakout setup 🚀
Chartink Scan : https://t.co/ECQZpBZMPZ
FUCK.
Been a while since I posted something this interesting.
Today, QQQ was
▪ Up at least +2.75%
▪ On a day VXN (VIX for QQQ) was up at least +1.00 point
And how has QQQ done 2 weeks and 1 month after every similar event in the past?
Hahahahahahafuck.
📈 Trend Following Series – (Part 4/10): Best Entry Methods 🚀
A good trend is useless without the right entry! 🎯
Here are 4 high-probability ways to enter a trend:
1️⃣ Pullback Entry 📉➡️📈
✅ Wait for price to retrace to support/50 EMA
✅ Enter when trend resumes
⭐ Safer than chasing moves
2️⃣ Breakout Entry 🚀
✅ Find consolidation zones
✅ Enter after strong resistance breakout
⚠️ Avoid entering after a huge candle
3️⃣ Retest Entry 🔄
✅ Let breakout happen first
✅ Wait for price to retest the level
✅ Enter after confirmation
4️⃣ Trendline Bounce 📊
✅ Use higher lows & trendline support
✅ Enter near structure
✅ Confirmation improves quality
🔥 Golden Rules of Trend Following:
✔ Trade with structure
✔ Prefer pullbacks
✔ Wait for confirmation
✔ Always define your risk
✔ Never chase candles
📚 Better Entries = Better Trades 💡
#Trading #TrendFollowing #PriceAction #TechnicalAnalysis #Nifty #StockMarket #TradingEducation #RiskManagement 📈
16 Mental Models to Reach the Top 1%
Clearer thinking. Better decisions. Faster growth.
Here are 16 simple mental models:
First Principles → Break problems to basic truths
Map ≠ Territory → Models simplify reality, test them
Inversion → Ask “How can this fail?”
Diminishing Returns → Know when extra effort stops helping
Second-Order Thinking → Think about long-term effects
False Consensus → Others don’t always think like you
Parkinson’s Law → Work fills the time you give it
Lindy Effect → What lasts longer will keep lasting
80/20 Rule → Focus on the vital few
Confirmation Bias → Challenge your own views
Survivorship Bias → Study failures, not just winners
Occam’s Razor → Simplest explanation is best
Hanlon’s Razor → Don’t assume bad intent
Sunk Cost Fallacy → Past costs shouldn’t decide future
Hick’s Law → Fewer choices = faster decisions
Regret Minimization → Choose what your future self won’t regret
Which one do you use most?
Want to learn more, Get this Behavioral Finance PDF for Free Here
https://t.co/KssoNifXx1
VWAP shows you where price is trading relative to the day’s average.
The Doji tells you when the market is losing momentum. 📊
One of the biggest mistakes traders make is entering a trade simply because price touches VWAP.
Professional traders wait for VWAP + Price Action Confirmation:
🟢 VWAP → Identifies the intraday value area
🟢 Price above VWAP → Buyers have the advantage
🔴 Price below VWAP → Sellers have the advantage
🟡 Doji near VWAP → Signals indecision
🟢 Next candle → Confirms the direction
My framework before every VWAP + Doji setup:
✅ Identify the overall intraday trend
✅ Mark VWAP as the key reference level
✅ Wait for price to approach or retest VWAP
✅ Look for a Doji forming near VWAP
✅ Wait for the next candle to confirm direction
✅ Check volume for additional confirmation
✅ Enter only after confirmation
✅ Keep the stop loss beyond the VWAP/rejection zone
🚫 Avoid forcing trades when:
❌ Price is moving sideways around VWAP
❌ Doji appears without a clear market context
❌ You enter immediately after seeing the Doji
❌ The confirmation candle is weak
❌ Volume does not support the move
📌 Remember:
VWAP gives you the context.
The Doji gives you the warning.
The confirmation candle gives you the **trigger.
Don't trade the Doji alone.
Trade the reaction around VWAP. 🎯
💬 Question for traders:
What do you trust most for VWAP entries?
1️⃣ VWAP + Doji
2️⃣ VWAP + Volume
3️⃣ VWAP + Price Action
4️⃣ I use all three
Drop your answer below. 👇
❤️ Like • 🔁 Repost • 🔖 Bookmark this for your next chart review.
Educational purposes only | Not a buy/sell advice
SEBI RA INH000025151
Follow @TradesByAnand for daily trading notes, price action education, and high-probability intraday trading strategies.
#StockMarketIndia #Nifty50 #TechnicalAnalysis #IntradayTrading
Al Optical Networking Could Grow 9X by 2028
Goldman Sachs estimates that the Al optical-networking TAM could expand from $15B in 2026 to $1548 bv 2028.
As Al infrastructure continues to scale, analysts expect strong forward revenue growth across key companies in the optical networking and connectivity space:
$GLW — Corning | +16% | Market Cap: $143B
$CIEN — Ciena | +29% | $48.3B
$FN — Fabrinet +31% | $14.9B
$COHR — Coherent | +49% | $59.1B
$MTSI — MACOM | +50% | $21.0B
$MRVL — Marvell | +60% | $197.4B
$AVGO — Broadcom | +76% $1.75T
$CRDO — Credo | +81% $31.3B
$LITE — Lumentum | +107% | $76.1B
$ALAB — Astera Labs | +120% | $49.5B
$AEHR — Aehr Test Systems | +157% | $3.0B
$AAO — Applied Optoelectronics | +195% | $9.0E
Al is driving massive demand for high-speed connectivity and optical infrastructure.
These are some of the names worth keeping on your radar as the Al data- center buildout continues.
Price tells you where the stock is trading.
Anchored VWAP tells you where the important participants are positioned. 📈
One of the biggest mistakes traders make is looking at price without understanding the volume behind the move.
A powerful combination for swing traders:
🟢 Anchored VWAP → Identifies the average price from a key starting point
🟢 Volume → Confirms whether participation is increasing
🟢 Price Action → Shows whether buyers or sellers are in control
When price holds above Anchored VWAP with strong volume, the probability of continuation increases.
My framework before taking a trade:
✅ Anchor VWAP from a major swing low, breakout, or important event
✅ Price holding above Anchored VWAP
✅ Pullback respects the AVWAP zone
✅ Volume contracts during the pullback
✅ Volume expands on the bullish move
✅ Bullish price-action confirmation
🚫 Be cautious when:
❌ Price repeatedly loses Anchored VWAP
❌ Breakout happens on weak volume
❌ Selling volume increases below AVWAP
❌ Price is moving sideways around AVWAP
📌 Remember:
AVWAP tells you where the average participant may have conviction.
Volume tells you how strong that conviction is.
Price action tells you when to act.
Put all three together, and your chart becomes much easier to read.
💬 Question for traders:
What do you trust more for confirming a breakout?
1️⃣ Price Action
2️⃣ Volume
3️⃣ Anchored VWAP
4️⃣ I use all three
Drop your answer below. 👇
❤️ Like • 🔁 Repost • 🔖 Bookmark this for your next chart review.
Educational purposes only | Not a buy/sell advice
SEBI RA INH000025151
Follow @TradesByAnand
for daily trading notes, price action education, and high-probability swing trading strategies.
#StockMarketIndia #Nifty50 #TechnialAnalysis