🔥 "The Power of Price Action Reading" Le mostraron 9.794 gráficos anónimos a un campeón de trading, sin ticker ni fechas ni noticias. Convirtió una estrategia perdedora en +3.968%
Zarattini, de Concretum, se juntó con Marios Stamatoudis, top performer del US Investing Championship 2023 a los 26 años, para responder la pregunta del millón: ¿leer gráficos es una habilidad real o es humo?
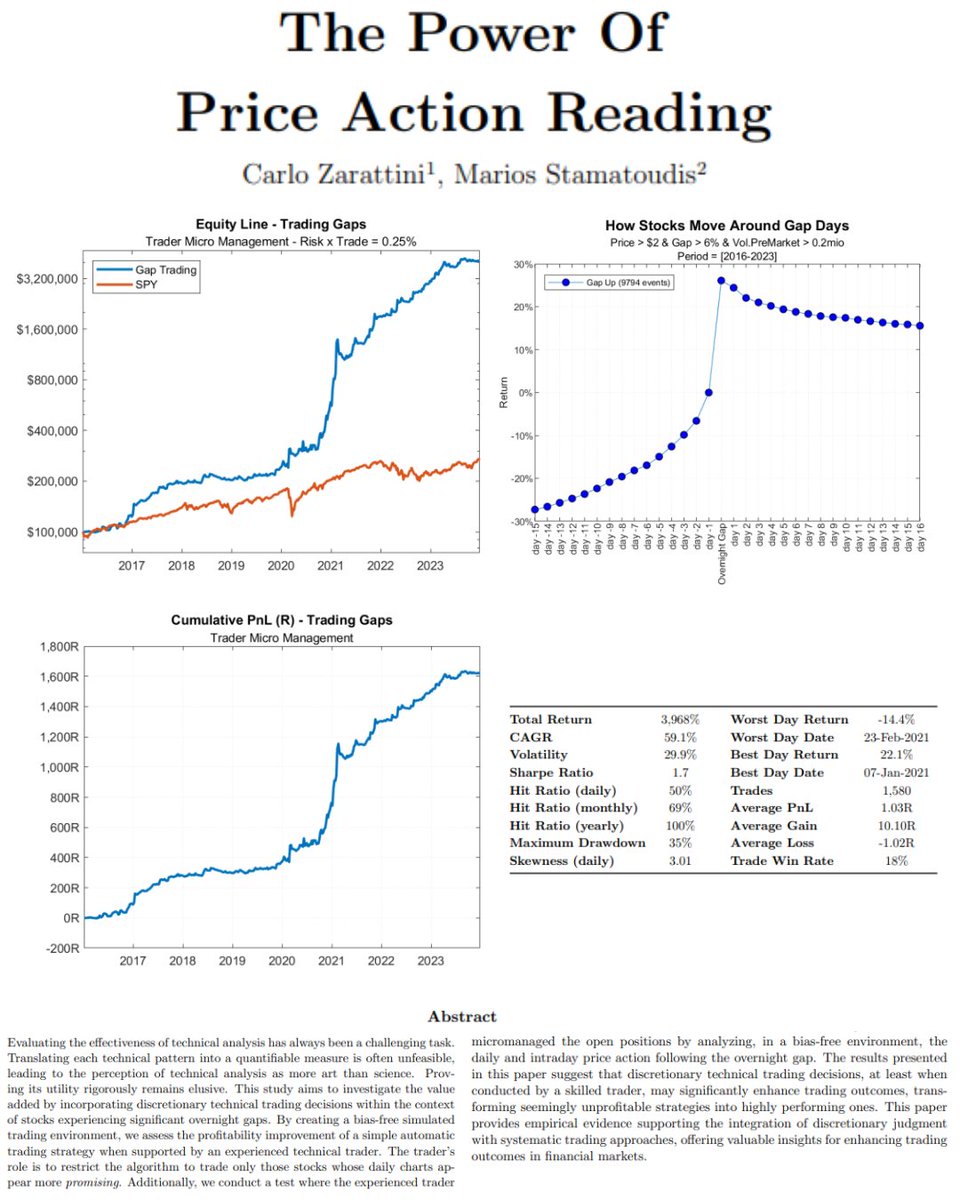
El experimento es una joya. Agarraron todos los gaps de más de 6% del mercado americano entre 2016 y 2023, 9.794 eventos, y probaron 6 estrategias mecánicas para operarlos: TODAS pierden o quedan en cero. Comprar gaps a lo bruto no funciona
Después le mostraron los 9.794 gráficos al trader, uno por uno, en un software que borra ticker, fechas, sector, noticias, precios y volumen. Solo las velas, en orden aleatorio y sin feedback de cómo venía. Aprobó 1.721, el 18%
Resultado con su selección y su manejo de posiciones:
- $100.000 se convierten en más de $4.000.000 en 8 años
- Retorno total de 3.968%, un 59,1% anual, con Sharpe de 1,70
- Costos de $0,01 por acción incluidos
- Ni un solo año en rojo en todo el período
Y lo que rompe el mito: ganó apenas el 18% de los trades. La ganancia promedio fue de 10,10R contra una pérdida promedio de -1,02R. Pierde chico 8 de cada 10 veces y cada tanto agarra una que paga por todas
Para no vender humo: es UN solo trader, y no cualquiera, un campeón. El paper no prueba que cualquiera pueda hacerlo, prueba que la habilidad existe y se puede medir. Que es justo lo contrario de lo que dice la academia hace 50 años
Mi conclusión: el price action no es astrología, pero tampoco es democrático. En manos expertas hay edge real y medible. La pregunta incómoda es cuántos de los que te lo venden lo tienen
Link al paper en el primer comentario
@TheOneLanceB@veptrader All the small account challenge , trade it as if they are trading large account .
Some dumb shit small account like $40k post a trade with like $2m position execution.
The people who feel the urge to do something every single day are the same ones who give back a months worth of progress during a pullback/consolidation.
"Everyday is a day to lose money, but not everyday is a day to make money" @Qullamaggie
@LoneStockTrader this is a great tip, what i usually do is just search ticker with 2x behind it or use @finviz_com on the stock main page to find those ticker (inverse also)
You never know which market will perform the best in the future.
There are lots of Nasdaq 100 momentum systems out there but how do you know the Nasdaq 100 will perform the best in the future? Picking that universe because it backtests the best is a form of curve fitting.
Hence why I purposely always force my systems to trade multiple universes.
This system was developed on the Nasdaq 100 (green line) but I also trade it on the Russell 1000 (yellow line) and the S&P100 (red line).
The Nasdaq 100 was the best in the Backtest, so it’s temping to just trade it on the Nasdaq 100.
But since going live with this system in 2024 (purple vertical line), the Russell 1000 system has been doing the best by far.
Doing this technique may not make your Backtest look better, but it will make your live results better.