.
The Bitcoin Bottom will be Much Lower Than You Think
URGENT UPDATE! BTC is About to get CRASH Wave 3
Many Moonboys believe Bitcoin just bottomed at $57k, just as they did at $80k & $60k . A few other Moonboys believe BTC will bottom at the low $50k area. My second favorite Moonboy thinks that.
What I can tell you with great certainty is that $50k won't be the bottom for Bitcoin. Bitcoin is going a whole lot lower than everyone thinks. Historically, the last part of the BTC bear market gets a really bad crash, often worse than the first leg down of the bear market.
The last bear market in 2022 had a 52% for the first leg down and that was followed by a 68% crash for the second leg down. BTC has only dropped 30% so far from the May 6th peak. The second leg down of the bear market began on May 6th.
If Bitcoin does what it did the last bear market and drops 68% after completing a bear market rally, BTC would crash to down to the $25k to $26k area. That's an 80% drop from the October 6, 2025 top. It also happens to be the upper end of my long term target for BTC, made right after I called the day of the Bitcoin top on October 6, 2025. Bitcoin is going a whole lot lower than everyone thinks.
I was correct calling the day of the BTC top in October. I was correct predicting a 50% to 52% crash to kick off the bear market. Predicting BTC would crash to $60k to $63k, when everyone else was predicting BTC would be at $200k to $250k by December 2025. I correctly predicted this latest crash after calling another lower peak on May 6, 2026. My signals remain bearish and there is no evidence of a bottom. I think I will be correct about a much bigger BTC crash into the midterm elections. Historically, BTC has crashed into the midterm elections, this time will be no different.
.
$BTC #BTC $IBIT #Bitcoin $BTCUSD #BTCUSD #BTCNews $ETH $HODL $SOL #crypto #CLAIRTYAct
🧭I randomly stumbled over this post from October 7th 2026.
❗️ONE FREAKING DAY, ONLY ONE DAY AFTER the official price ATH at $126k (October 6th 2025) - yes, you are reading that again: ONE DAY - I stated that this indicator will show us THE $BTC macro regime change and it did!
🚨Today is your chance to take the deep dive into this metric. Lean back, take a sip of your favorite drink and get this metric into your brain! If you invest ten minutes of your time, you will know more than 98% in CT, bet?
EXPLANATION:
The Central Bank Liquidity Oscillator models global monetary liquidity as a normalized, composite time series, derived from balance sheet dynamics and financial system drains. It translates heterogeneous macroeconomic inputs into a bounded statistical signal, capturing the state and momentum of global liquidity conditions in reciprocity to Bitcoin.
1. Conceptual Foundation:
In macro-financial systems, liquidity can be approximated as the net availability of money and credit provided by central banks, adjusted for institutional absorption mechanisms.
2. Data Structure:
The model separates inputs into positive and negative liquidity vectors.
Expansion variables are:
- Federal Reserve total assets
- European Central Bank total assets
- Bank of Japan total assets
Drain variables are:
- Treasury General Account (TGA)
- Reverse Repo Facility (RRP)
This reflects a net liquidity balance, where some components inject capital while others remove it from circulation.
3. First Transformation (Delta Operator)
Rather than using absolute levels (which are non-stationary), the model applies a finite difference operator. This converts the system into a rate-of-change framework, emphasizing acceleration and deceleration rather than size.
4. Standardization: Z-Score Normalization ensures:
- comparability across heterogeneous series
- transformation into a dimensionless statistical space
- identification of deviations from equilibrium
5. Composite Liquidity Function
The standardized components are aggregated into a single function attached with this post.
6. Smoothing: Low-Pass Filtering
To reduce high-frequency noise, the model applies an exponential moving average. This introduces a temporal smoothing kernel, isolating structural trends from short-term volatility.
7. Nonlinear Bounding: Arctangent Transformation
To constrain extreme values, the oscillator compresses outliers and preserves relative order. This creates a bounded oscillator, suitable for cyclical interpretation.
8. Indicator Analysis
The oscillator revolves between the +86 and -80 thresholds, volatility-implied swings are normal. When analyzing the indicator, one ONLY focuses on the final swing after each halving.
Step 1: AFTER THE HALVING, GCBLO will rise above +86 (red level), marking the final top phase aka pure risk on liquidity-wise.
Step 2: When GCBLO goes BELOW the red level threshold after its post-halving run up, this marks the final cycle top for Bitcoin, at least in liquidity terms
Step 3: GCBLO quickly crashes below -80 (green level), this is the last warning and final exit opportunity before the bear market hits
Step 4: Liquidity-wise, when GCBLO crosses above the green -80 level, a new Bitcoin bull market has started every time. Sometimes, liquidity lags price in bull market entries (2019 entry)
9. Summary
The Central Bank Liquidity Oscillator formalizes global liquidity as:
- A weighted system of monetary variables
- Transformed into momentum space (Δ)
- Standardized via Z-scores
- Aggregated into a composite index
- Smoothed using EMA filtering
- Bounded through a nonlinear transformation
This results in a dimensionless, stationary, and cyclically interpretable signal, representing the evolving state of global liquidity conditions within a mathematically consistent framework that can be used to test the waters for liquidity behavior and therefore, for Bitcoin’s current situation.
🚨Today is July 24th 2026, and I herewith declare, considering this indicator perspective, that the bottom in $BTC is in - at least liquidity-wise. According to GCBLO, it's our time to RE-ENTRY - NFA!🚨
Now things get confusing.
Plenty of people are screaming for lower prices, and some isolated indicators like Weekly RSI are at cycle bottom levels.
So you should be buying, right?
The whole picture says no. Psychology can be helpful, but also misleading. Price can still go up or down when "most" people expect it to. It does all the time.
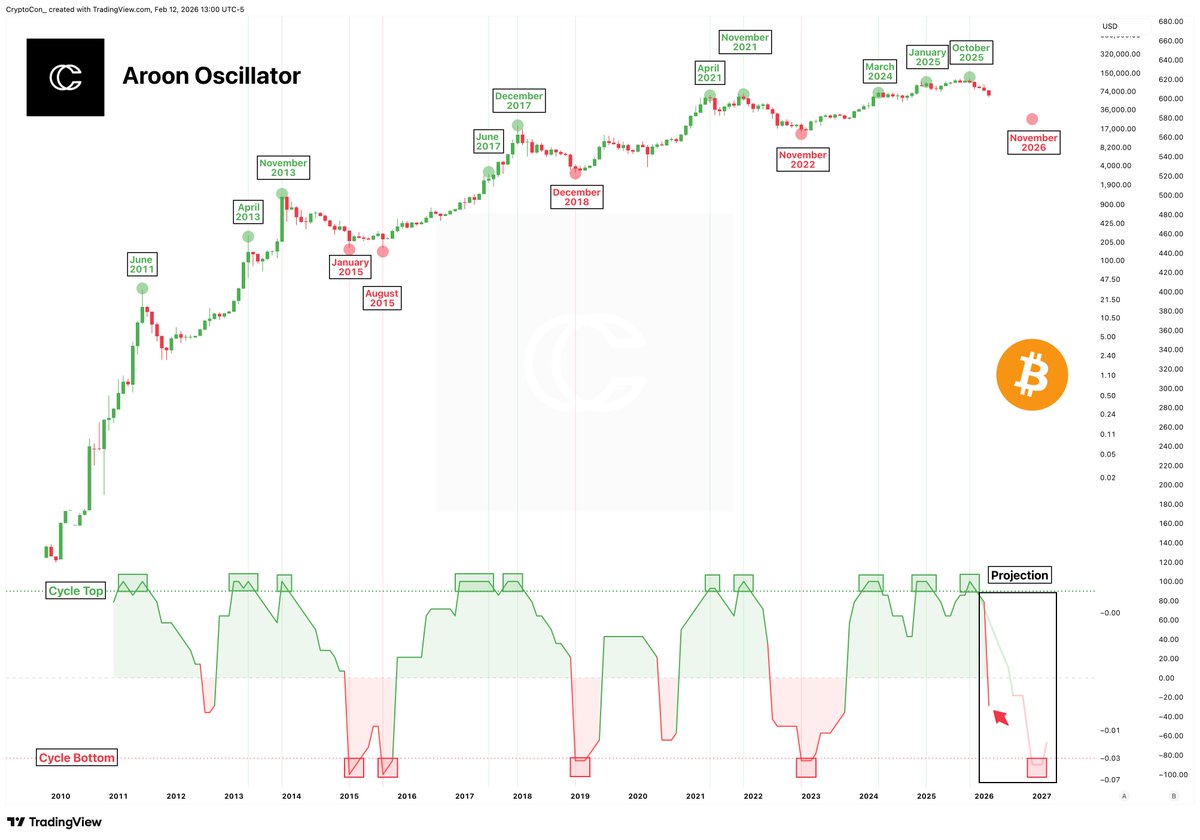
The Aroon Oscillator is ahead of the projection I laid out for returning to cycle bottom levels, but still has plenty of ground to cover before getting there.
#BTC Bullish case to hold the low-
A drop to $81K would liquidate $1B in longs
A rise to $99K would liquidate $8B in shorts
That's 8x the liquidations 🧐
The push down won't have as much fuel
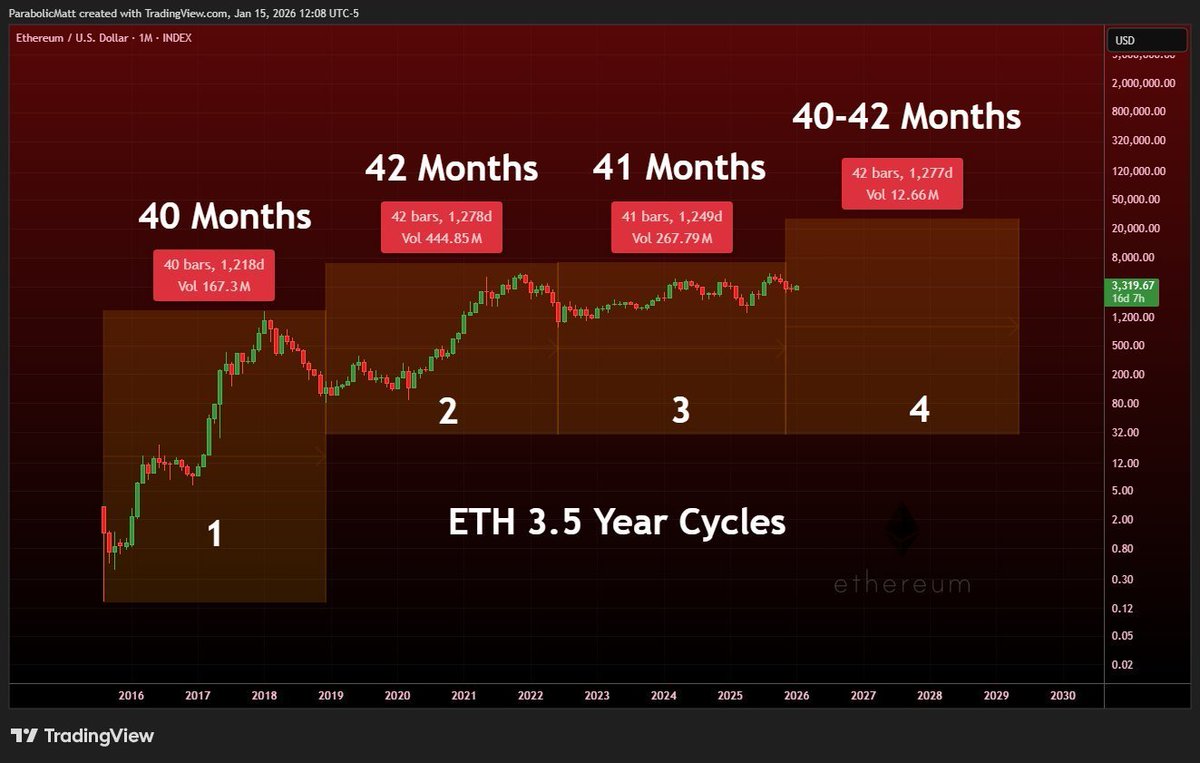
#ETH
2025:
Red year
9 of 12 months Red
3.5 year cycle decline right into months 40-42 after making new all time highs just like the prior two cycles
The next cycle for ETH has begun
The wait is over!
Introducing... 🥁
Bitcoin Quantile Model v2.
You’re going to want to bookmark this post—and follow for regular model updates.
After months of research and development, I’m very proud of this model—my flagship quantile framework.
I’m confident it’s one of the best—if not the best—long-term Bitcoin investment frameworks available.
As a full-time, unpaid Bitcoin researcher, I’m often asked how people can best support my free content.
Simply bookmark, repost, and comment on my posts :)
Thanks for all your continued support!
— PlanC
Key Features & Improvements:
1. Quantile lines never cross—mathematically impossible.
2. Cycle-length agnostic.
3. 133,000+ data points and 1,500 lines of code.
4. Fits and stores 999 quantile levels (τ = 0.001–0.999 in 0.001 steps) and identifies which level the last price is closest to.
5. Fits the two leading decay functions (stretched exponential decay & exponential decay) and selects the better fit via quantile-appropriate AIC.
Uses Akaike weights to identify the best-supported model.
Akaike weights (AIC-based):
Stretched exponential decay: 96.4%
Exponential decay: 3.6%
6. Piecewise Quantile Regression — Linear + Stretched Exponential Decay (Nonlinear).
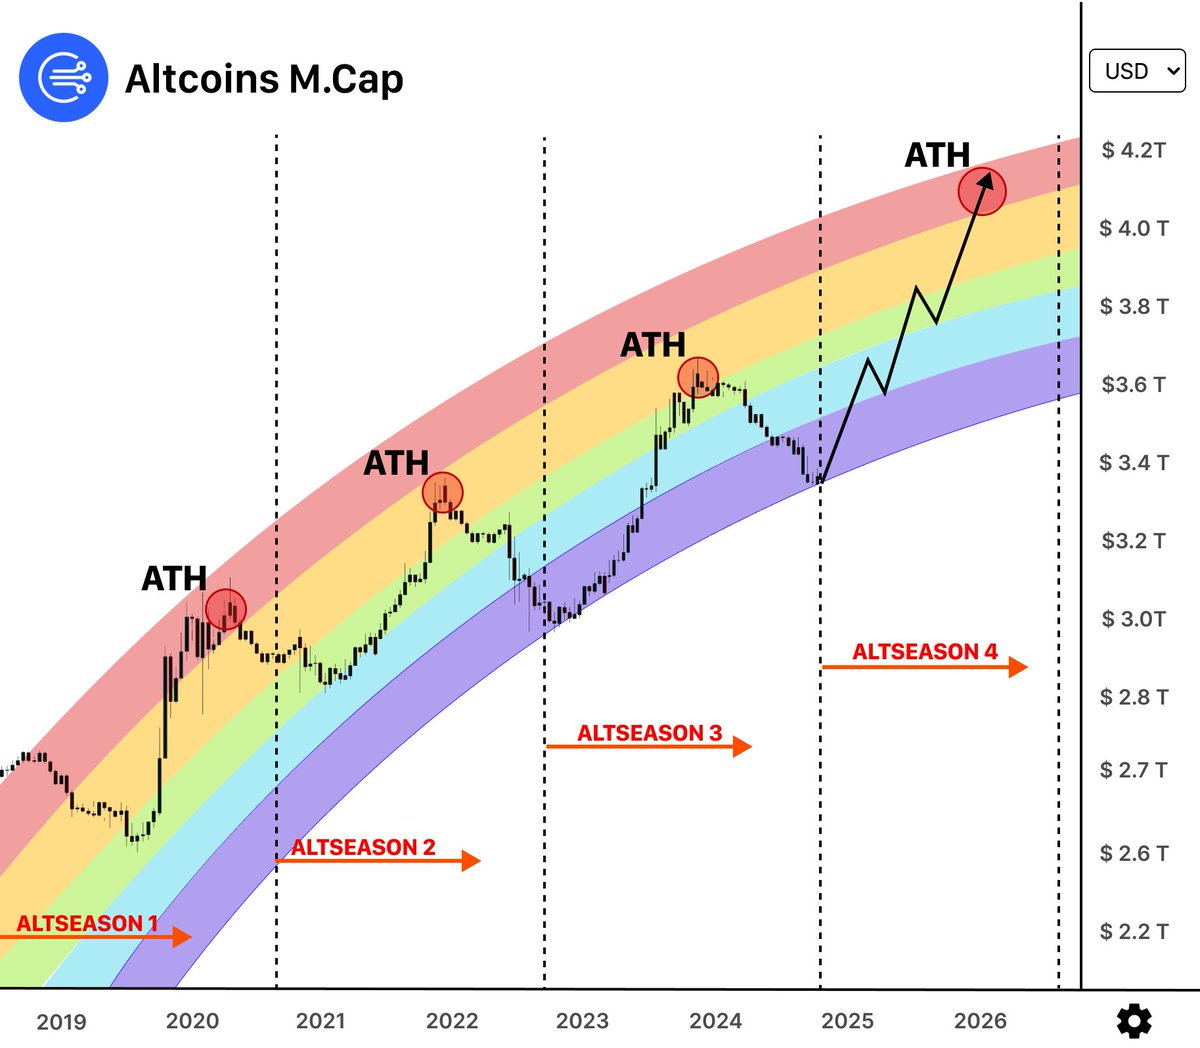
🚨 This ALTSEASON will be MASSIVE
The cycle has completely changed liquidity is overflowing
This is your chance to turn $200 into $231,766 in days
Here’s what changed in the cycle and 6 alts for 100x 👇🧵
Looks like the S&P 500 is already making a swift recovery from its Quartercent Cycle's Theory 15-year high, just as we should have expected based on others.
I created this cycle theory just a couple of months ago, but it's already working wonders!
The next major high for the stock market is not expected until 2028, and the next true recession-like period is not until 2034 according to the theory.
I'm ready to leave these recession narratives that we've been fed this cycle in the dust!
The S&P 500 correction continues from the "15-year" point. The Quartercent Cycles Theory is right on track.
Other 15-year corrections were in 1957 and 1990 which both lasted only a few months and took us down about 20%.
Our current correction is at 18.5%.
Contrary to what most people are telling you to expect, this, according to the theory, is not a market pause like 2000 - 2008, it is just a temporary and normal drawdown as we've seen many times. The next major market pause is not due until 2034.
The Bitcoin cycle clashes with this and still has the rest of the year left to go.
This cycle is different to others because we haven't seen a BTC blow-off top yet.
Retail interest is low, BTC Dominance is high, and altcoins are down -60%+
But different doesn't mean worse. It just means your timing and pivots matter.
Let me break it down ->