@willowdesk@AllVentured What's the difference between consumption and implied-demand change. Are there any explanatory notes available with definitions? Thanks a lot!
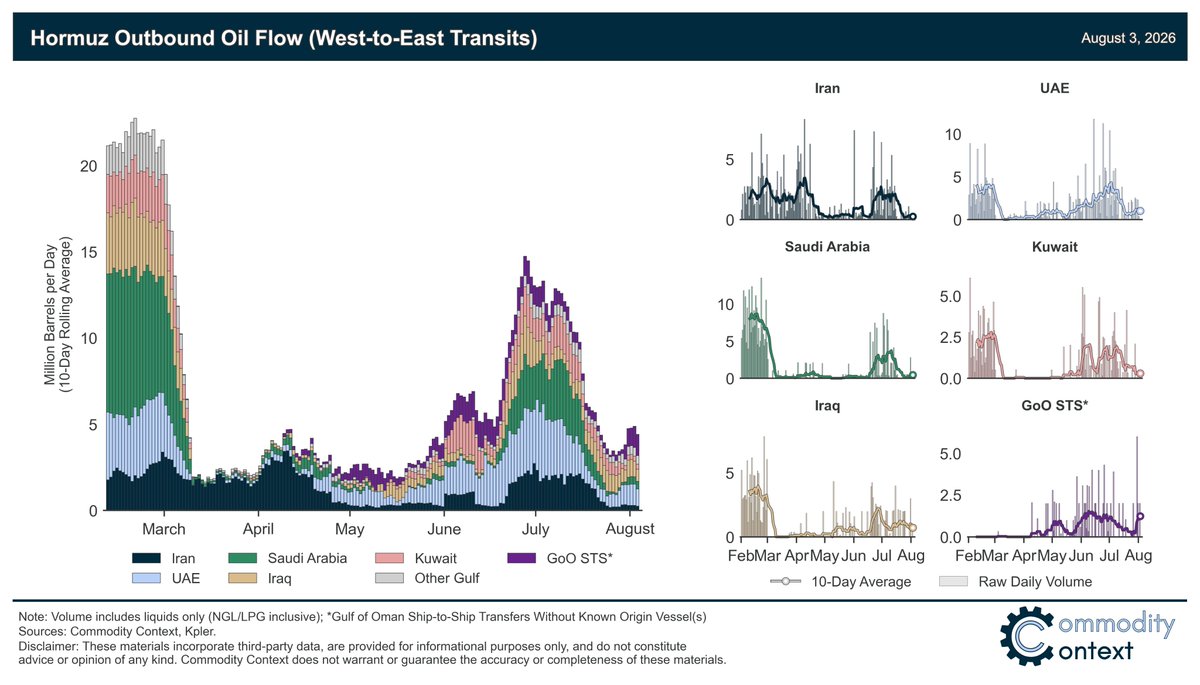
Hormuz oil flow begins to rise again.
Still well off the ~15 MMbpd late-June high, but back up to just less than 5 MMbpd (10dma) at latest count.
As expected, much of that is the return of the Gulf of Oman ship-to-ship dark shuttle trade, which may soon exceed pre-MOU pace.
@MerruX@tleilax___@ElliotDodson@phileeppos Images of western side of Hormuz also corroborated these exits. On one day you see 8 VLCCs waiting, next satellite pass you see just 1. There's little reason for VLCCs to go back, so they probably transited Hormuz.
@MerruX@tleilax___@ElliotDodson@phileeppos Tracks tankers out of Gulf of Oman, which means that anything that passes Hormuz still spends several days doing STS. What we saw during last 2 days likely passed Hormuz during last weekend or Monday.
@MenchOsint There are satellite images for today already and I cannot find anything burning in the Strait. FIRMS was quiet as well. Maybe this video is an old one which wasn't published previously?
@WindwardAI Hello, it seems you missed this VLCC in your Hormuz traffic analysis https://t.co/cZfk8kNiRv . How can this happen? An amateur with only public info at hand shouldn't be able to extract more data than Windward...
@Rory_Johnston Nitpick, but shouldn't prices at the same expiration be compared? Or at least variable blend between two front expirations as the front month becomes less and less important as expiration approaches.
@JuneGoh_Sparta Thanks a lot! Is there any resource with a collection of information about approximately which region could accept which crude grades? Or does it involve so many variables that it's always evaluated on case by case basis?
@jrex035@PatrickPatten8@phileeppos There's also almost 5mbpd of products which don't flow anymore. That affects oil prices indirectly as well, because with 12mbpd of oil down there's enough refinery capacity that increased product prices will translate to increased oil prices when inventories are drained.
@LVision_Trading The SAR images are public: https://t.co/JaAqlPG8qR . I zoom near each ship and measure its length. If it's ~330m then it's VLCC. There's some blur, but with some practice it's easy to differentiate between 300x50 Suezmax and 330x60 VLCC.
@LVision_Trading This is not taking into account the inbound journey which should be _at least_ another 30 hours.
I suspect that there's AIS spoofing, maybe as "evidence" of loading at specific port so that fewer questions are asked where the oil is from.
@LVision_Trading I think this cannot possibly happen (would have written a PM for discussion, but seems I cannot).
Between loading port and current location there's 1280km in the most optimistic route. Their max speed is 14.6kn=27km/h. They would've needed 47 hours just for the exit journey.
@LVision_Trading There's chance that few escaped. I didn't see even single VLCC escaping in the SAR images. Yesterday and today it was very convenient as the satellite passed ~2:15 UTC when the transits should've happened.
STS activity is low as well, less than 3mbd.