We’ve raised $36M in Series C, led by @SusquehannaVC (SIG). Existing investors @LongJourneyVC , @ElevCap and @peakxvpartners doubled down. @makemytrip joined the round, marking the start of a strategic partnership to further enable seamless travel.
But if I’m honest, moments like this belong just as much to our customers. The people who trusted us with journeys that really mattered to them. Many came to us anxious, uncertain, sometimes completely overwhelmed by the process. And yet they chose Atlys. Many came back again. Many told someone else to try us. That kind of trust has shaped our growth far more than any metric ever could.
A big thank you to the team as well for your effort, commitment, and conviction. This progress reflects what we’ve built together and what is still ahead.
Marketing teams are often accused of spending too much and measuring too little by the CEO, CFO, board members, and investors. But the answer isn’t to stop spending. It’s to start measuring the right things.
This post is about how to track brand health and evaluate success/failure of brand campaigns in a way that’s meaningful, repeatable, and useful for decision-making, not just to impress the board or justify ATL spends
Measuring Success of a Brand Campaign
Performance campaigns are easy to measure. You get almost immediate feedback through sales numbers, click-through rates (CTRs), and other conversion metrics at each step of the buying process.
Brand campaigns are more complex. While their ultimate goal is to generate sales, they typically don't drive immediate results. This makes measuring their success or failure trickier. So how do you do it?
The answer isn't in the "buzz" generated, awards won, or other vanity metrics. The metrics I use to evaluate a brand campaign’s impact fall into two categories: brand metrics and business metrics.
Brand metrics aim to measure the awareness of your brand among consumers and understand if they have formed the intended associations with it. Business metrics aim to measure the tangible business impact the campaigns have created.
To measure a campaign's impact, you need to commission a brand track—an ongoing measurement of brand building efforts that tracks key metrics like brand awareness and perception
Research agencies typically conduct these by interviewing a statistically significant sample of your target group (TG) through face-to-face or online questionnaires.
Brand metrics
1. Correct Brand Recall to Reach Ratio
Every media plan has a target to achieve certain reach and frequency numbers for their TG.
For example, 75% reach at 1+ frequency means 75% of your TG will see the ad at least once. However, seeing an ad, noticing it, and correctly remembering the brand are three distinct things. The campaign must ensure that all three happen, and to check if these are indeed happening, interviews are conducted in the field.
Usually, during brand track interviews, the brand name is masked in the ad shown to consumers. They're asked two questions:
Do you remember seeing this ad? (indicates Ad Recall)
If yes, which brand was advertised? (indicates Brand Recall)
Correct Brand Recall = Ad Recall × Brand Recall.
If 50% remember seeing your ad, and half of them correctly identify the brand, you have a 25% Correct Brand Recall. With a 75% Reach at 1+ Frequency, your Correct Brand Recall/Reach ratio would then be (25/75) or 0.33.
Ideally, Correct Brand Recall should equal Reach. The higher this number, the more successful the campaign. Strong, clutter-breaking campaigns achieve ratios of 0.6-0.8.
New brands find it harder to achieve high Correct Brand Recall. Viewers might remember the ad but not the brand name. Since the brand is new, it needs something different and unique to make an impression. This metric tests how well your communication breaks through the noise. Without success here, subsequent metrics become meaningless, and this is also where most campaigns falter.
2. Improvement in Spontaneous Awareness
Spontaneous Awareness is also an indicator of how well your brand is known and how it’s faring with respect to the competition in terms of occupying mind share.
For example, if you sell fans and ask respondents, "Which fan brands are you aware of?", the percentage who name your brand without any cue or prompt represents your Spontaneous Awareness. This indicates how many people know your brand exists and its purpose.
When your campaign effectively links your brand to its category, Spontaneous Awareness should spike. The difference in Spontaneous Awareness levels before and after the campaign measures its success.
3. Improvement in Brand Associations
Beyond creating the association with the right category of product, brands aim to build specific associations. These can be tangible, like features (for new brands), or intangible, like emotions (for mature brands).
Fogg, for instance, did both successfully at different stages of its journey. “Bina gas wala deo” established that their deodorant didn’t have gas inside. Later, “Fogg chal raha hai” appealed to the senses or emotions of consumers rather than any product features.
Each marketing campaign should strengthen these desired associations. The change in associations before and after the campaign indicates its effectiveness.
Business metrics
1) Increase in brand searches
Across Google, Amazon, Flipkart, and other e-commerce or quick commerce channels, the number of searches for your brand should increase after a brand campaign. Most platforms allow you to measure the number of searches happening. Compare the figures for before and after the brand campaigns were activated. The higher the increase, the better the campaign’s performance.
2) Improvement in performance marketing CTR and conversion rates
A successful brand campaign builds awareness and trust, making conversions easier. Tracking them at every step of the performance marketing funnel is straightforward. If conversions have improved and sales have increased, it’s an indication that the brand campaigns are effective.
3) Comparison between geographies where a campaign has run and not run
Measuring sales numbers and conversion rates for two different geographies—where you've chosen to run a campaign in one but not in another—will give you a sense of the campaign's effectiveness.
For example, if TN and Karnataka showed similar numbers initially, did Karnataka's numbers improve after running an ad there? If not, the ad hasn't been effective.
4) Increase in Rate of Distribution Expansion
Effective marketing campaigns create brand pull, encouraging consumers to seek out the brand in stores. This naturally creates a ripple effect and retail stores are more keen to stock your brand.
This makes it easier for the sales team to establish new retail locations. The change in distribution expansion rate before and after the campaign measures its impact.
While there are other leading indicators (like brand searches, organic visits) and lagging metrics (revenue, reduced dependence on performance marketing), these four metrics best isolate campaign impact and identify areas for improvement.
Hopefully, future campaign awards and recognition will be based on these meaningful metrics rather than vanity metrics.
Measuring Brand Health and Brand Strength
While campaigns happen from time to time, brand building a continuous process. And if the brand keeps getting stronger, invariably the business benefits
The strength of a brand can be measured in different ways. A marketing manager would look at it from a more current, operational point of view, whereas a CEO would be more interested in a long-term, strategic view. For newer brands, it’s possible that the CEO doubles up as the CMO or the marketing head, so it’s imperative for them to look at both types of metrics.
I have segregated these metrics into Operational Metrics and Strategic Metrics. Operational Metrics help the marketing manager with decision-making in a relatively short-term timeframe. They ensure tactical efficiency and allow for quick course correction if needed. Strategic Metrics help you evaluate the brand from a business perspective, and aid you for the larger, more critical decisions pertaining to the future of the brand
Operational Metrics
Operational Metrics broadly comprise the following five metrics:
Awareness
Consideration
Trials
Preference
Performance
You’ll notice that they move progressively from understanding how well a brand is known to how much the brand’s products are actually being purchased.
Awareness
Brand awareness can be evaluated through quantitative surveys. For example, for fans, simply ask consumers, "Which fan brands do you know of?" Their responses reveal how well your target audience recognizes your brand and allow you to further categorize the audience by their awareness levels.
When respondents list brands, the first one they mention indicates "Top of Mind Awareness." If we’re doing a survey for Atomberg and 30% of respondents say "Atomberg" first before any other brand, that's 30% Top of Mind Awareness for Atomberg. Naturally, the higher the Top of Mind Awareness, the stronger the awareness.
At the second level, brands mentioned without any aid or prompts represent "spontaneous" or "unaided awareness." For instance, if 40 out of 100 people mention Atomberg at any point in their list of brands they’re aware of, that's 40% Spontaneous Awareness.
"Aided awareness" is measured by directly asking, "Have you heard of Atomberg?" This is done when Atomberg isn’t listed by the consumer on their own. A positive response here counts toward Aided Awareness.
Total Awareness then is the sum of Spontaneous and Aided Awareness. (Note that Top of Mind Awareness is included under Spontaneous Awareness for this calculation.) Companies regularly track this metric through Brand Tracks.
Another key awareness indicator comes from search volumes on platforms like Google, Amazon, and other relevant e-commerce sites.
Rising search numbers with time indicate growing awareness. You can monitor exact search volumes weekly on most such platforms.
Consideration
While awareness metrics show how well people recognize your brand, consideration metrics reveal how many would actually consider purchasing it.
To measure consideration, we ask potential category buyers: "Which two brands would you consider buying the most?" This question focuses on brands they're already aware of. For instance, if someone knows four brands, we want to know which two they'd seriously consider purchasing.
The brands mentioned first and second comprise the "Top 2 Consideration" metric, while the top three mentions make up the "Top 3 Consideration" metric.
Strong consideration from your target audience indicates effective brand communication. However, some brands achieve high awareness but struggle with low purchase intent. This disconnect often signals a need to reassess both communication strategy and product offering. While high awareness suggests large scale media investment, low consideration indicates that despite knowing the brand, consumers aren't sufficiently motivated to buy.
Trials
While consideration metrics are more relevant for high-intent purchase items, like consumer durables, low-intent and low-ticket-size items must be evaluated through Trials.
Here, the question for potential buyers in a category is, “Which brands have you tried?”
Similar to consideration metrics, if brand awareness is high but not enough people are trying the product, it's a clear indication that the brand communication isn't persuasive enough. Every brand must aim for a high Trial-to-Awareness ratio.
For new consumer brands, a low Trail-to-Awareness ratio could also indicate a product problem or a smaller than expected market size for the category.
Brand Preference
For people who have tried multiple brands, brand preference can be measured by asking which brands they like the most. This metric shows how strong your brand and product are compared to competitors, and indicates what they’re likely to purchase next.
Some brands face an interesting challenge: they may have high awareness and trial rates but low preference. Take Pepsodent, for example—it has high awareness and trials, but low preference. This could signal issues with the product itself, brand associations, or persuasion effectiveness.
Another strong indicator of brand preference is when consumers search for specific product variants on Google or other platforms—for example, "Cadbury Silk Mousse" rather than just "Cadbury." High search volumes for specific variants indicate that consumers have developed a strong affinity for those particular products, demonstrating both strong consideration and brand preference.
Performance
Brand strength is reflected in the effectiveness of performance marketing campaigns. A strong brand should see conversion rates significantly higher than the category average at each funnel stage. Moreover, as brand strength grows, spending on performance marketing should gradually decrease.
Simply put, brands with high consideration result in high click-through rates (CTRs), and a stronger brand preference results in higher conversion rates.
Strategic Metrics
When scaling consumer brands, here are 5 key strategic metrics that a CEO must monitor periodically. These metrics indicate brand strength from a long-term business perspective and help guide the brand's future direction.
1. Price Elasticity of Demand
This measures how demand changes relative to price changes.
Price Elasticity = Percentage Change in Demand/Percentage Change in Price
A strong brand typically has lower price elasticity. The ability to increase prices without losing demand to competitors is one of the strongest indicators of brand strength.
Ideally, as brand strength grows, price elasticity should continue decreasing.
2. Contribution of Discounted Sales
Every brand has a standard market operating price (MOP, which could be MRP in some categories). Brands also generate sales through consumer discounts beyond the MOP.
Discounted Sales Contribution = Sales Volume with Discounts/Total Sales Volume
A strong brand will have a lower contribution from discounted sales. The ability to maintain sales at the market operating price indicates brand strength.
As brand strength grows, the contribution of discounted sales should decrease.
3. Performance Ads Driven Sales
Brands generate both organic sales (through brand searches, repeat purchases, marketplace SEO, etc.) and paid sales (through Amazon ads, Google/Meta ads, etc.).
Performance Ads Driven Sales Percentage = Sales due to ads/Total Sales
A strong brand has a lower contribution from ads-driven sales. Strong brands naturally generate higher repeat purchases, more brand searches, and rank organically at the top for generic marketplace searches.
As brand strength grows, the percentage of ads-driven sales should decrease.
4. Performance Ads Driven Visitors
Both D2C websites and marketplace listings receive organic visitors (through brand searches and SEO) and paid visitors (through Amazon Ads, Google/Meta ads).
While overall ads-driven sales attribution can be complex (as customers may click ads to visit a D2C website but purchase organically from marketplaces), visitor attribution is more straightforward.
Percentage of Performance Ads Driven Visitors = (Ads-driven visitors on Marketplaces + Ads-driven visitors on D2C)/(Total Visitors on Marketplaces + Total Visitors on D2C)
As brand strength grows, the percentage of ads-driven visitors should decrease.
5. Share of Spends/Market Share
Share of Spends (SOS) represents the brand's marketing expenditure as a percentage of total category marketing spend done by all the brands in a year.
When a brand's market share exceeds its Share of Spends in the category, it indicates:
Higher conversion rates and a more efficient marketing engine
High baseline sales
New brands typically have a higher share of spends than market share (as baseline is 0). However, this ratio should decrease as brand strength grows.
While reaching zero might harm long-term brand health as it indicates no brand investment, strong brands should maintain a ratio between 0.5-1. This means that if they have a market share of 20% in the category, their Share of Spends in the category should be in the 10% to 20% range.
6. Share of Spontaneous Awareness / Market Share:
If your share of spontaneous awareness is higher than market share, it means your proposition and conversion levers need to work harder. If it’s the other way around, it indicates there’s plenty of scope for gaining market share by improving spontaneous awareness.
7. Share of Consideration / Market Share:
If your share of consideration is higher than market share, it means availability and conversion levers need to work harder. If it’s the other way around, then improving consideration can improve market share, and focus should be to create a stronger proposition to improve consideration.
8. Share of Spontaneous Awareness / Share of Consideration:
Very similar to the awareness/consideration ratio, this ratio shows if you have a stronger proposition relative to your competition. A higher share of spontaneous awareness than consideration shows a weaker relative proposition and vice versa.
These metrics help isolate where your brand is strong and where it’s leaking. And it highlights issues with proposition, distribution, conversion levers, creatives, etc.
Strong brands naturally lead to strong businesses. When done right, brand-building investments always pay off financially. Strong brands rely less on performance marketing and discounts, and can increase prices without losing volume.
These metrics presented here will help you gauge your progress in building a strong brand
P.S. This post is from one of the chapters of my book Zero to Scale and is fairly representative of the writing in the book- language, depth, style etc. If you like it, there is a good chance you will find value in the other 24 chapters. If not, it saves you the time/effort of going through the book :)
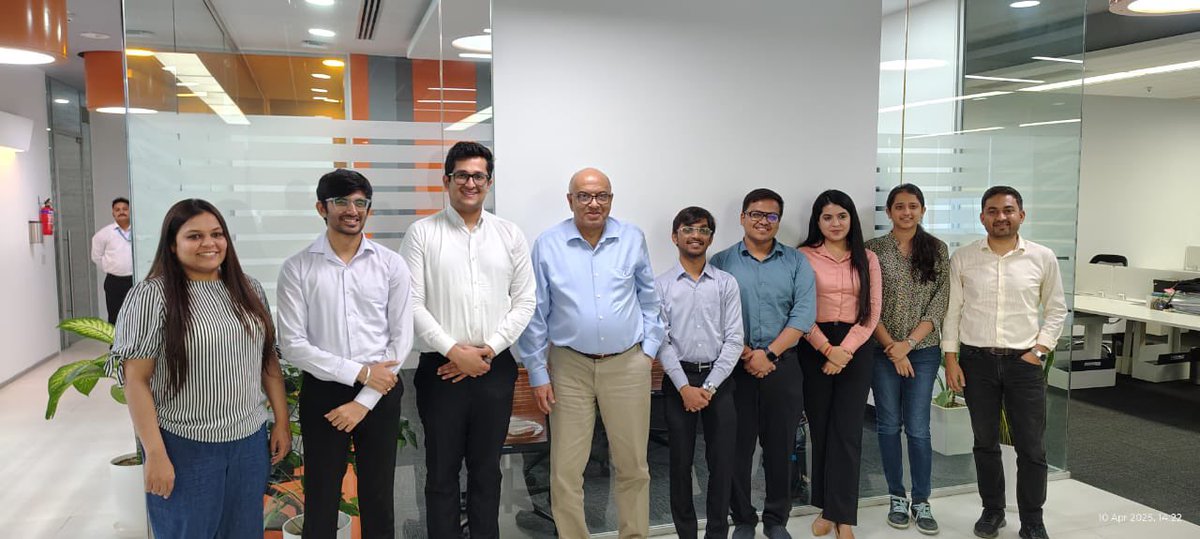
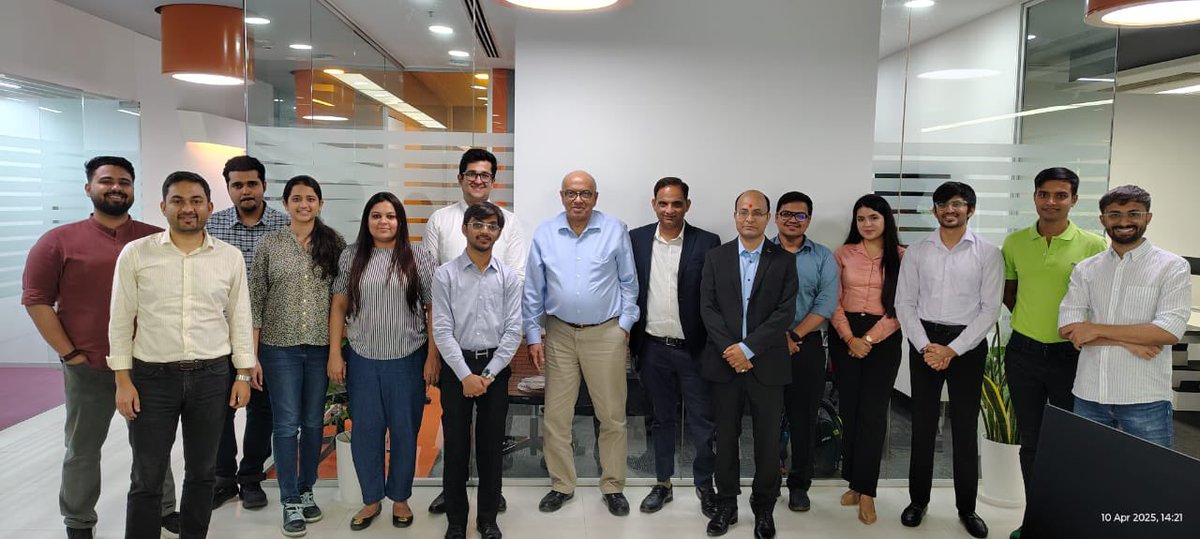
After I tweeted a few days ago about the fact that all three of the gold medallists at IIMA were from Shaheed Sukhdev College of Business Studies the College Principal reached out to me and invited me to the college to interact with the IIMA gold medallists who were visiting. The college is in Rohini and that would have been a full day expedition so I invited the students to meet the Info Edge Ventures team in our office in Gurgaon instead. They dropped in today for lunch - two faculty and five students. The five students, all SSCBS alumni and from the 2025 class of IIMA were ranked 1,2,3,5 and 7 at IIMA. Unbelievable. Five out of the top seven at IIMA are from SSCBS. There is something remarkable happening at SSCBS. I asked the students what it was. The top ranker replied “Sir we go to IIMA as underdogs so we try harder”. The faculty gave me reasons like college culture, student commitment, the teaching, selection process while admitting students, the leadership of the Principal Ms. Poonam Verma etc. Whatever it is, this hasn’t happened at IIMA earlier - five out of the top seven from the same college. And SSCBS puts dozens of students into the leading IIMs each year @SSCBS
For the first time ever, @skylaneinc is opening its doors to the public.
🔹 Witness next-gen visas in action
🔹 Experience the future of global travel security
If you’ve ever wondered how countries will manage borders in the future, this is your chance to see it firsthand.
📍 Skylane Experience Center, One Lodha Place, Mumbai | Limited Slots | RSVP now → https://t.co/h5CkDr0mEq
This isn’t just a demo—it’s a glimpse into the future of visas.
93 years young and still unstoppable! 💪
“Loneliness kills. I will make my life again, Why The Heck Not?” — KP Singh, Chairman Emeritus of DLF, on bouncing back after the loss of his wife of 65 years.
A must-watch interview for inspiration!
A lot has been said about how we represent government fees on @atlys:
1. Every country calls its visas different names - SDF for Bhutan, ETA for Kenya etc. As a customer, it is very confusing to understand what these terms mean but it's easier to know that it's going to then Government directly. Hence we use "Government fees" everywhere. This is also based on numerous experiments, surveys and user research.
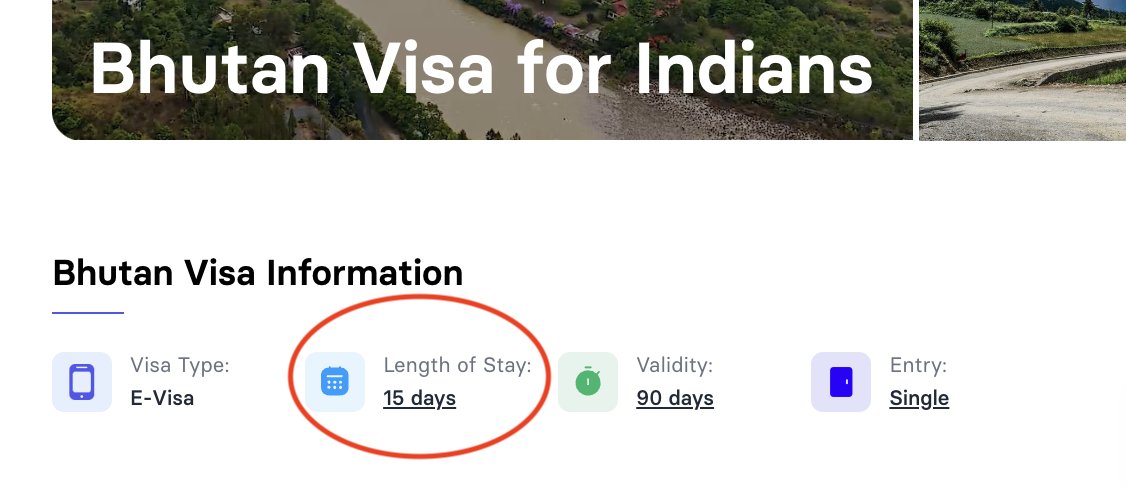
2. On Bhutan, we only offer a 15 day entry permit (SDF) currently. Hence, 1200 x 15 = 18k. On our page, we clarify a) it's 15 days only b) that it is SDF c) history of SDF and why it exists. If someone wants to go for shorter or longer time, they can apply directly. For many countries, Atlys still offers only one visa type yet. And i think there's nothing wrong with that.
Huge congratulations to Adi Agarwal for being selected into the prestigious Junior Academy at the New York Academy of Sciences (NYAS)! 🎓✨ With an acceptance rate of just 10%, Adi joins an elite group of young minds passionate about research and STEM studies. 🧬🔬
@s0humshah It's the best movie ever made in world cinema. I saw it thrice in theatres and lost count of times on tv. Everytime the dadi moment is haunting, the first hastar scene is mind boggling and the moment when the story starts to reveal in our mind is THE moment why cinema shd exist
Having a dominating share on e-commerce marketplaces has been one of the pillars of our growth over the last decade. And contrary to popular belief, it can also be a profitable channel. 10 pointers for founders to keep in mind while scaling e-com
1. The fundamental equation of e-com is “Sales= Traffic*Conversion”. Not meeting sales numbers is either a traffic problem or a conversion problem.
For every SKU, figure out whether it is a traffic problem or a conversion problem. Do not try to solve traffic problems with conversion levers. And vice versa. And relook at the problem statement to solve every month for every SKU
2. Like all performance marketing, e-com media also has diminishing returns. Figure out your spends and sales graph through experiments. Beyond a point, increasing spends will not increase sales at the same speed. Stop at that point
3. If you want to increase profitability, you need to increase your organic discoverability in the platform. Amazon is a search led platform with search contributing to 60-70% views in most categories. For Flipkart, along with search, merch and reco are equally important.
But the fundamentals of organic discoverability is same. Both platforms have an algorithm where SKUs with the best reviews, highest listing quality score, lowest time to delivery and highest conversion rates get pushed. Optimize for these parameters and see organic discoverability skyrocket
4. The other way to reduce dependency on platform ads( and hence increase profitability) is to ensure your branded searches increase. This is directly a function of your off platform marketing activities, word of mouth and repeat customers. So, work on those parameters
5. Category Relationships matter a lot. Understand what the number 1 objective of your category manager is for the year. And help them achieve it.
If they are looking to improve ASP, help them with that assortment. If they are looking to increase profitability for their category, help them reduce returns and other levers. If you help them achieve their number 1 KPI, they will ensure you do well on the platform
6. Whatever the ads team tell you, take it with a pinch of salt. Most times they are very helpful. But their number 1 KPI is to sell ads. Not your success. So, sometimes what is good for them might not be good for you
7. All SKUs will not do well. All sub-categories won’t do well. If there is no PPCMF, no amount of good execution will cut it. So, important to cut your losses and stop investing more money on losers. Instead, allocate to your winners in the portfolio
8. Have a E-Commerce dashboard which goes beyond the L0 metrics. Look at your L1 and L2 metrics daily and hold teams accountable for these metrics. Ads driven sales, share of search, organic visits, conversion rates etc are all examples of L1 metrics
9. Sometimes there will be irrational competition and they will bid crazily for keywords. Do not compete with them. They are burning cash and because blind venture money is running out quickly in consumer brands, they will fizzle out. Instead, stay consistent with your spends instead of reacting to irrational competition
10. Do not overdo discounts. Discounts are like antibiotics. You use it 2-3 times a year, you see huge spikes. Use it every alternate day, and that becomes your market operating price. Start tracking your discounted sales( over MOP) and ensure it does not move above a certain %
A startup that I'm truly rooting for is Atlys.
A Travel Tech Startup with a clear mission: Simplify the tedious and time-consuming Visa application process.
⏭️Investors include: Elevation Capital, Peak XV, Southpark Commons, a16z - Series A ~$12 M
Problem: Visa processes are -
- Bureaucratic, Time-consuming, Heavy paperwork
- Proe to high rejection rate
- Subject to delayed approvals
Solution: Atlys provides ⏬
- Seamless digital experience, can apply for a visa in <4 min
- 1 visa application makes you visa ready over 60 countries
- Can predict the exact time of Visa arrival with 99.7% accuracy
- Applicants are eligible for a refund <= ₹8,000 in the event of visa rejection
In India alone, we have 30 million yearly international travellers, growing at ~9% CAGR. Globally the market is estimated to reach $4 B by 2032!
As per Entrackr-> Atlys is in talks to raise a Series B of $15-$18 M at a valuation of $70 M.