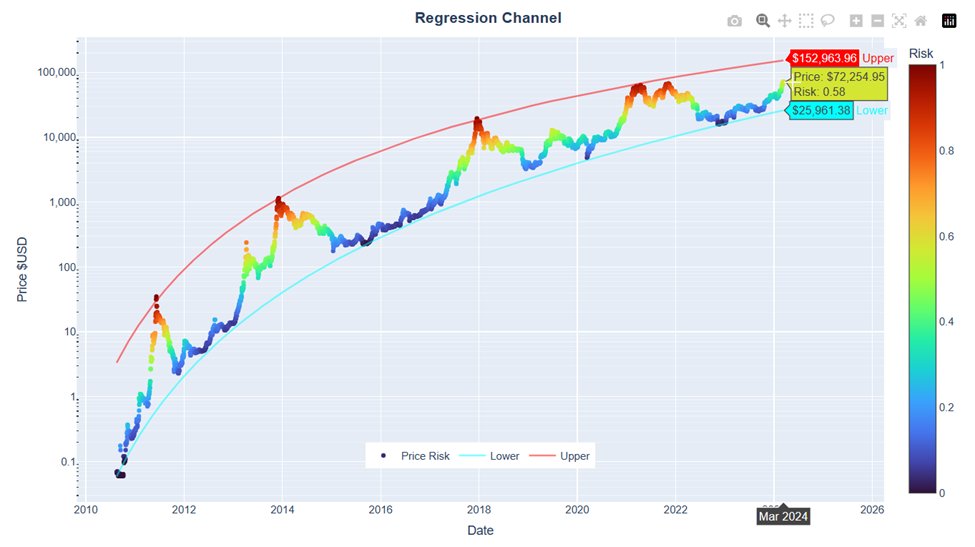
Introducing the Bitcoin Risk Metric.
The risk metric is a 0-1 scale that estimates the risk of holding BTC at any given time, based on historical data. A value of 0 represents periods of low risk, while a value of 1 suggests holding BTC is risky.
1/🧵
@Yield_Strat Thanks Brad.
I don't think my last update fixed the issue you mentioned earlier, but it should be working now, I promise :)
Also added the forecast capability but it only works for daily, weekly and monthly timeframes.
Reload the script and you should see the new feature!
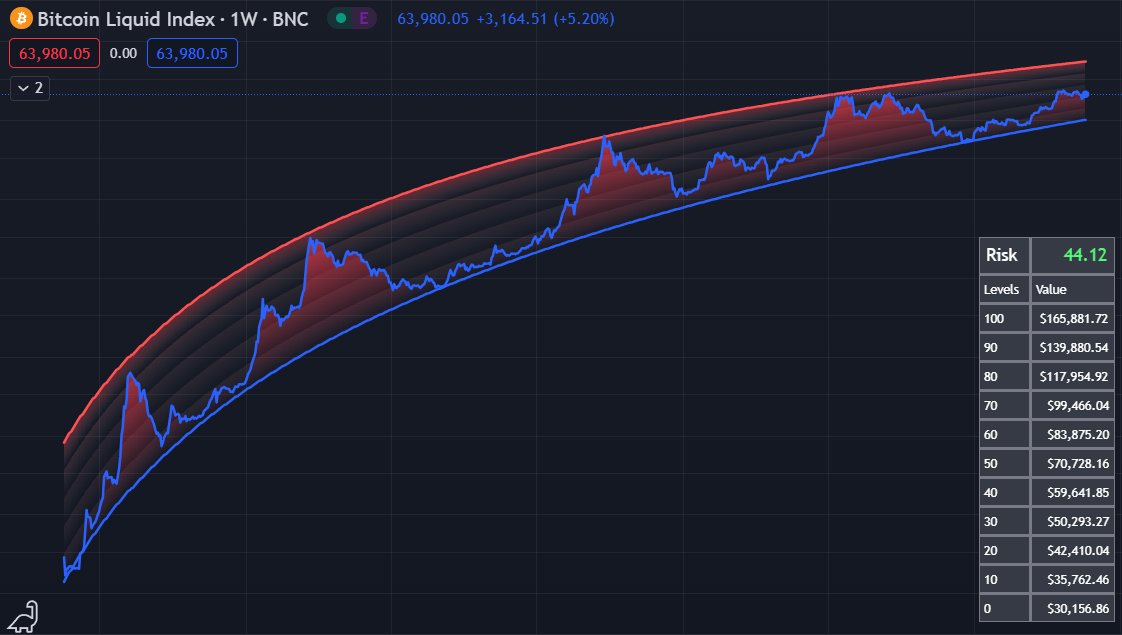
@Yield_Strat Hi Brad, this was due to the BNC:BLX ticker being down since Sep 1st. I’ve changed the data source and script is working again. If you remove the script and add it again to your chart, the latest version should display the correct values.
Introducing the Bitcoin Risk Metric.
The risk metric is a 0-1 scale that estimates the risk of holding BTC at any given time, based on historical data. A value of 0 represents periods of low risk, while a value of 1 suggests holding BTC is risky.
1/🧵
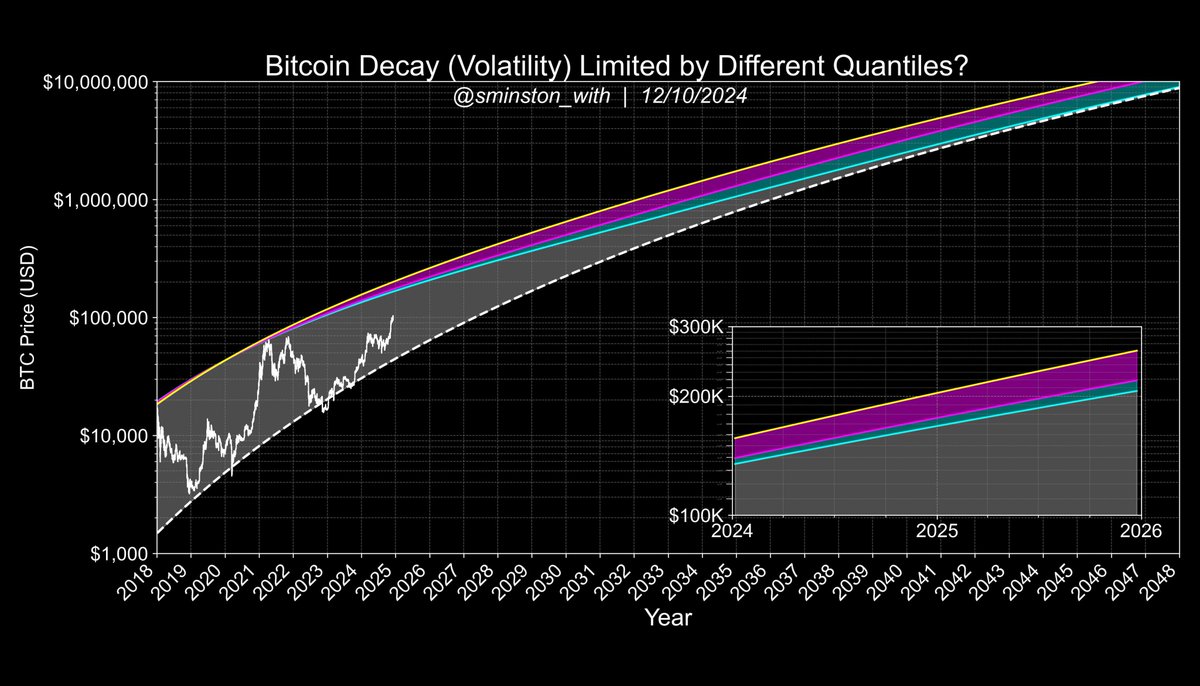
An exciting update on the Decay Channel model—which, as we know, captures the exponential decay of the 4 maximum deviations from the support line over the last 4 cycles and projects that forward as a top bound for future cycle peaks.
Here is a logical way to create a more bullish version of the Decay Channel: the cyan line represents the top model if the decay asymptotically approaches the 0.05 quantile power law regression line ("support," the white dashed line). The magenta line represents the top model if the decay asymptotically approaches the 33rd percentile power law regression line, and the yellow line represents the top model if it approaches the 67th percentile power law regression line.
This explores the question: "Is it actually intuitive that the tops decay into the support, essentially eliminating all volatility far in the future?" It also provides a couple of bands that might be more intuitive regarding what volatility stabilizes to in the future (something within the 33rd–67th percentile range, in my estimation).
Great news in the short term, too, if true—this allows the top (if in 2025) to hit $200k around mid-year, rather than at the end of the year in the original model. Or, if the 67th percentile scenario plays out, it allows us to hit $200k as early as this month (Dec 2024) theoretically (if this is when BTC decides to peak).
I just bought BestBitcoinData dotcom 👀
Sina, Ph.D., Sminston, Ph.D., and I—also known as the Best Bitcoin Data Team, are launching it in early 2025.
The top #Bitcoin handpicked and in-house created models, indicators, and metrics, all in one place with interactive charts.
2/ My new official online platform! 📢
From today onwards, you can visit https://t.co/H9ClRtxZKc where you will find:
1. Articles on my ongoing Bitcoin research - Dive deep into my latest insights and analyses.
- My first article on PLRRv2, https://t.co/pfmpSrxxGx - a comprehensive look at this new indicator.
2. Interactive charts and tools - Engage with dynamic data visualizations.
- Check out the live PLRRv2 + Quantile price chart on https://t.co/DuikR5tFtR . This tool provides real-time data visualization, helping you determine if Bitcoin is under/overvalued based on its current price and return level.
Cheers!
@math_sci_tech Ashwin and apsk32?! The dream collab we’ve all been wanting!
New indicator looks great! Cool solution to average different timeframes to avoid those spikes when black swans roll out of the 1 year vol moving average
#Bitcoin
I am exploring an alternative approach where I applied quantile regression using a power law fit for the 0.1%, 5%, and 50% quantiles. For the 95% and 99.9% quantiles, I used a quantile regression based on a log-quadratic fit. This method provides an excellent fit to the data.
I appreciate all the memecoins that donate portions of their supply directly to charity.
(eg. I saw ebull sent a bunch to various groups last month)
Anything that gets sent to me gets donated to charity too (thanks moodeng! The 10B from today is going to anti-airborne-disease tech), though I truly prefer if you guys send to charity directly, maybe even make a DAO and get your community directly engaged in the decisions and process.
I've said before that I think the best thing for memecoins is if they can be maximally positive-sum for the world, so it's great to see moments when that actually happens!
The quantile regression approach essentially says that bubbles happen randomly in time, but that has not been the case. Instead, they happen roughly every 4 years.
The four bubble peaks we've seen have averaged 2.33 standard deviations above the Power Law trend line, using trailing 4-years of daily data to calculate StDev. If bubble peaks happened randomly in time BTC might touch $1m in late 2030, but If BTC bubbles continue occurring with the same regularity we've seen we should expect to peak near the +2.33 Sigma line in late 2025 and then again in late 2029, at which time it will touch about $800k and then fall back. Price would need to hit +2.9 Sigma to reach $1m by late 2029, roughly 50% higher than any previous peak.
Same conclusion as @moneyordebt, but for a slightly different reason: if BTC price continues following its historical pattern there is essentially no chance it will hit $1m by 2030.