VVIX + VIX Term Structure - The Ultimate Volatility Trading System
🧵 Combining VVIX levels with VIX term structure creates a 3-dimensional view of volatility
This system has 75%+ win rate on volatility trades
Here's the complete framework and how I use VVIX in addition to VIX analysis to evaluate what volatility regime the market is in👇
This thread is the most comprehensive overview of the types of days you’ll get with the levels. Does it always work out like this? No. But majority of the time. You can identify the type of day just based on the RTH open in relation to levels.
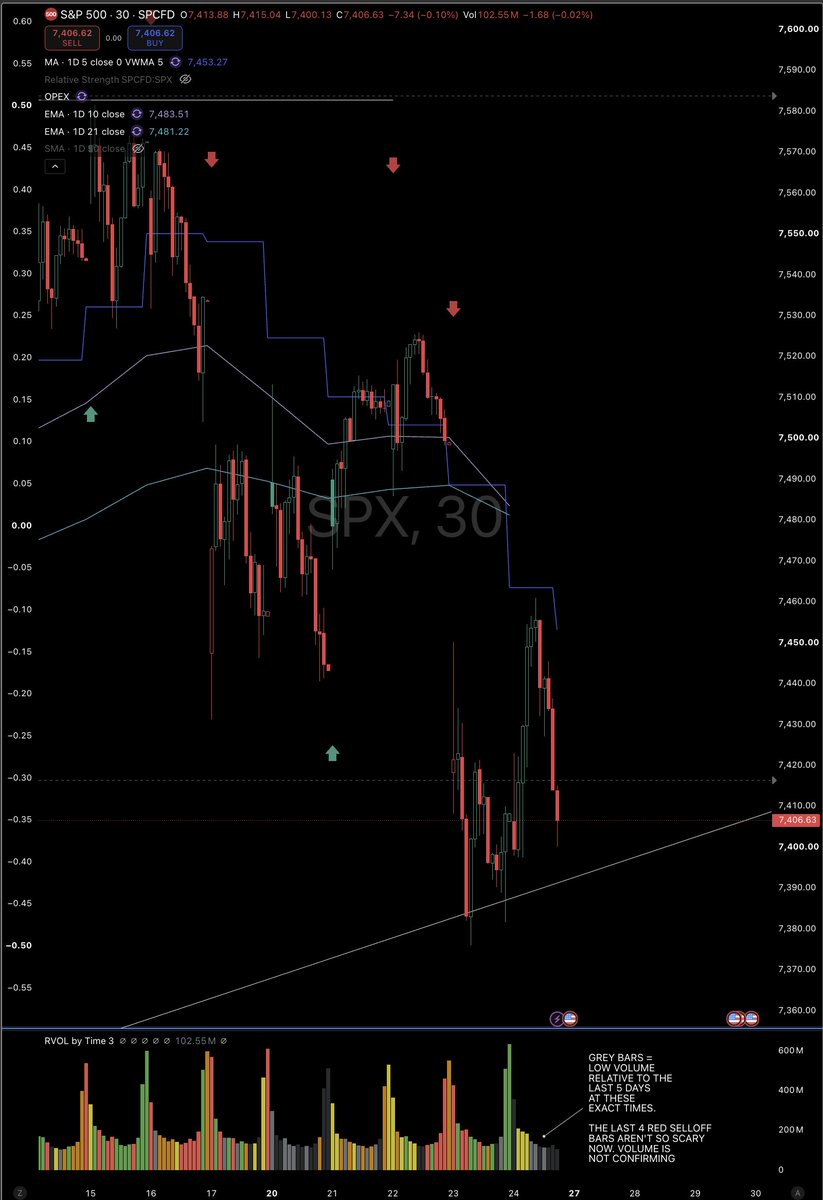
For those of you who are interested in one of the ways I use the intraday time-of-day volume comparison. Today's $SPX 30 min intraday chart "sold off hard" the last 5 bars. Look below and the volume bars are light and dark grey. So the volume was either average or below average for this time of day.
What's this tell me? No volume behind the selling.
Great for determining if rallies are dead cat bounces or real buying too.
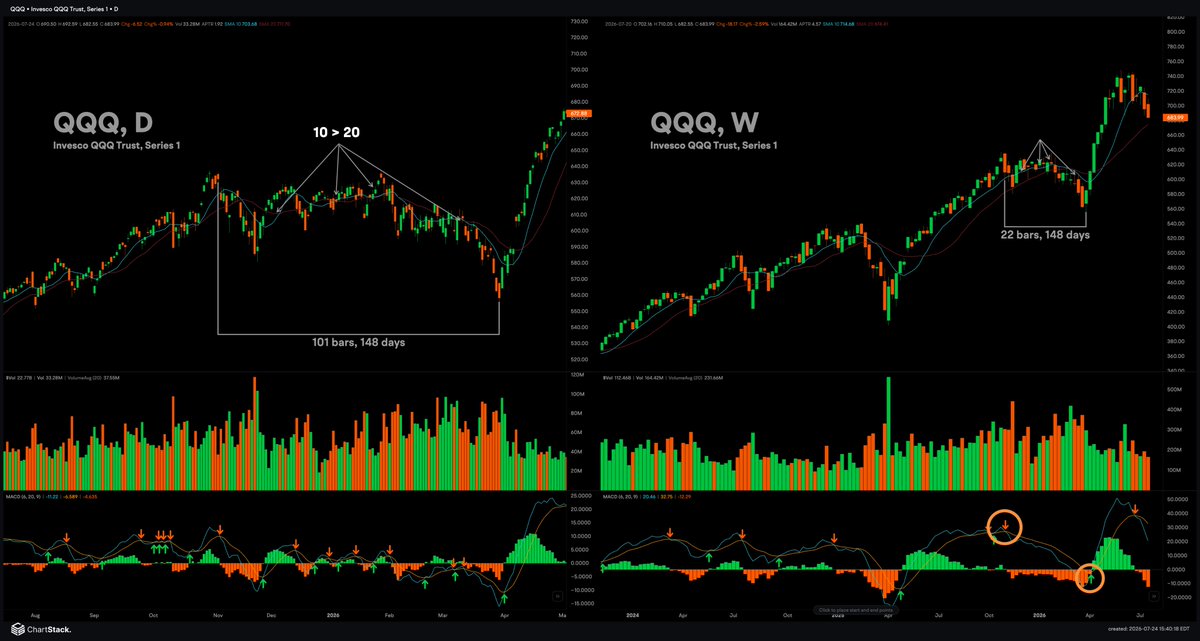
In my experience, 10 > 20 alone adds quite a bit of noise and headache.
If you look at the attached screenshot, the left pane is QQQ daily and the right pane is the weekly. Using the weekly MACD 6/20 cross would have saved you months of headache trying to trade through chop from December 25' through 26' april lows off the 10 > 20 alone.
Waiting for a weekly MACD 6/20 close may get you to the party a little late, but it does a much better job of confirming there’s actually a party worth going to in the first place.
I started as a Qullamaggie purist, but over my career and studies, I’ve refined and, in my opinion improved, some of his lesser-defined or under-optimized rules.
Thanks for the great discussion James, you are both a scholar and a gentleman and your dedication to studying the markets is truly impressive.
p.s.
This example may seem cherry picked, but if you're interested in gaining your own conviction around this concept open the charts study all the past periods where this risk filter is relevant and lmk what you find.
You learn exactly how quants price options and turn volatility into daily P&L
One talk that shows the real mechanics behind derivatives trading
00:07 - Lecture Overview
00:43 - Investment Bank Role
03:50 - Markets & Option Types
06:45 - Why Quants Are Needed
11:11 - Convexity & Volatility
15:30 - Black-Scholes & Greeks
33:05 - Delta Hedging & P&L
51:47 - Quant Career & Routine
You watch this and see why models matter and how convexity decides every trade
Save this, then read the article
Intraday $SPX insights
Today the market is betting on a highly priced but structurally dampened day following an already priced-in gap-down — the most likely outcome is a sub-open settle around ~7400, with meaningful right-tail optionality.
The 7499 cash print is yesterday's close finishing the day down -0.13% at 7499 —, the implied spot (7434.6) is live. Pre-market $ES is at 7470, down −0.93%, $NQ is down −1.34%, and $VIX has jumped +12.9% to 18.79; the ES level, with the ~35-point September basis, is broadly consistent with the pipeline's implied gap of −0.86%. Alongside $GOOGL's fundamentally strong quarter, the 45 billion capex turned FCF negative, and $TSLA's adjusted EPS significantly missed expectations; additionally, the US struck Iran for the 11th consecutive night with expanded targets, and Brent ran up to 97 dollars. But what is really hurting the index right now is that FedWatch is already pricing in a ~24% chance of a July hike and ~69% for at least 25bp by September — the energy-driven inflation impulse has turned into a hike-repricing, essentially my yields-up/energy-reacceleration thesis is already materializing. Today we still have initial jobless claims and $INTC/ $RTX/ $TMUS earnings on the calendar. Add to this the Japanese rate hike I expect for the second half of the year, and the increase in their import inflation risk, which builds vomma risk into the yen carry trade, as well as the true number of casualties concealed during the war, and the AI infrastructure slowdown due to future energy prices.
...I have been saying all this since last November-December, X-people just don't give a damn to listen, and the winds of the X algo blow mostly garbage...
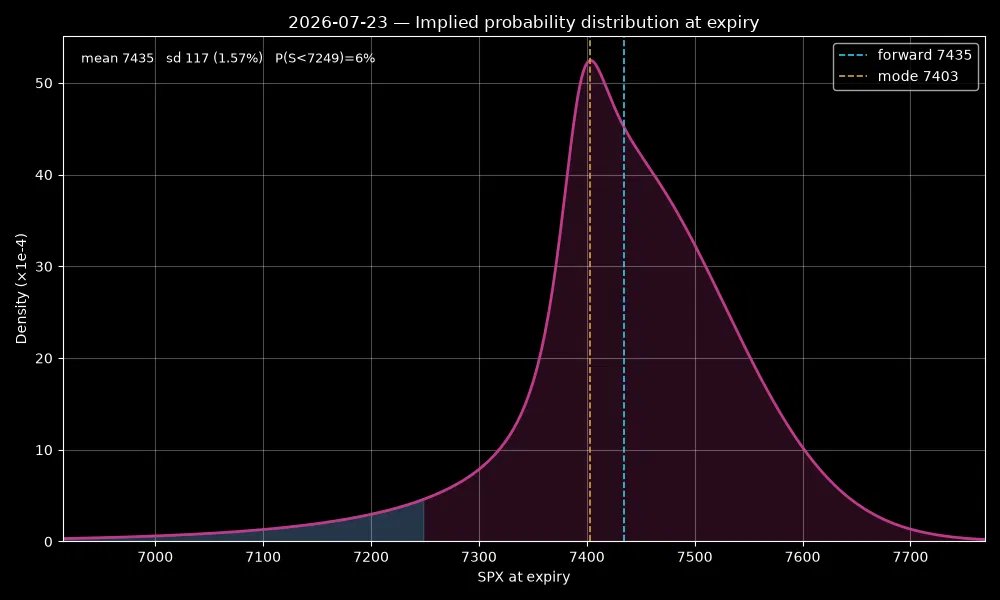
The daily mode is 7403, 32 points below the forward — of this, lognormal mechanics (−3σ²τ/2) would only explain ~3 points, the remaining ~29 points are genuine, smile-driven asymmetry. The body sits between 7370–7460, the right side decays more slowly (shoulder 7450–7550), this keeps the mean on the forward.
At the left tail, P(S<7249, i.e., −2.5%) = 6%, which is barely fat compared to the Gaussian equivalent of ~5.6% — so the market is not pricing in crash probability, but rather selling deep insurance at a premium (~34 vol around 7275, ~43 at 7200, ~50 at 7070).
The 1σ band is 7318–7552, and this is a nice confluence, bcs at the bottom it falls exactly on the net gamma flip (7315), at the top on the 7550 strike structure.
Long gamma around the spot — net +2.8M/1/1%, shadow +4.1M /1, peak 4.55M at ~7455. The shadow runs ~45% above the net, meaning the vol dynamics (vanna, smile-shift) further amplify the dampening compared to sticky-strike GEX: the 7435–7460 zone generates a strong magnet.
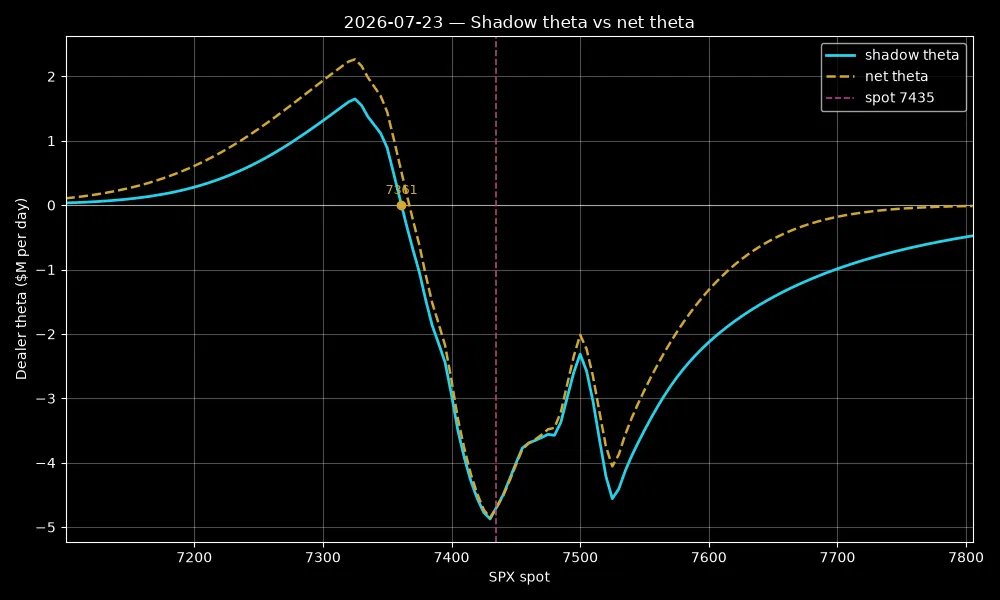
The theta trough (−4.9M$/day) sits exactly on the spot — the maximum bleed of the book is here, the long gamma needs ~117 points of realized movement today to break even; if the event underdelivers, a vol crush and pin is the likely continuation tomorrow.
It is also telling that the 0DTE ATM is at 26.9 versus the 18.8 VIX: a sharply inverted front-end, risk heavily concentrated on today, not as a regime-level fear. To the downside, theta turns into serious risk below 7361, the accelerant regime comes below 7315 (shadow ~7325); to the upside, at 7500 there is a theta-relief spike and strike wall, above it up to 7535 is a shadow-gamma pit (2.0M) — the brake is thinner there, a 7500 breach can quickly run up to 7550–65, where the secondary peak will catch it again.
The customer book is condor-like in terms of shadow exposure as the body (7400–7460) is sold — this is where dealers sit in long gamma —, the protective put wing is bought around 7250–7300 (where dealer gamma turns negative), on top at 7500–7530 there are long calls (PnL kink and gamma dip), and sold above 7550.
But the non-shadow implied PnL is a long RR. Its breakeven is 7414. At the modal 7403 settle the short-vol book is already slightly in the red, and below 7400 the pain increases linearly at a rate of ~$0.2M/point — this is the threshold below which monetization flow could start, although dealer long gamma cushions it.
The 7400-7460 zone is therefore strongly magnetic, a large range is priced in by customers (±1.6%), but positioning is working against a continuous trend — the risk is in the form of headlines, not a grind. Central band 7400–7460, pin gravity 7435–7455. Downside pivot sits at 7366, upside is at 7455. Left-tail starts below 7320.
Kiss, kind regards😘
(the clear/refined plan and opportunities can still be read on my blog for 52 euros a month)
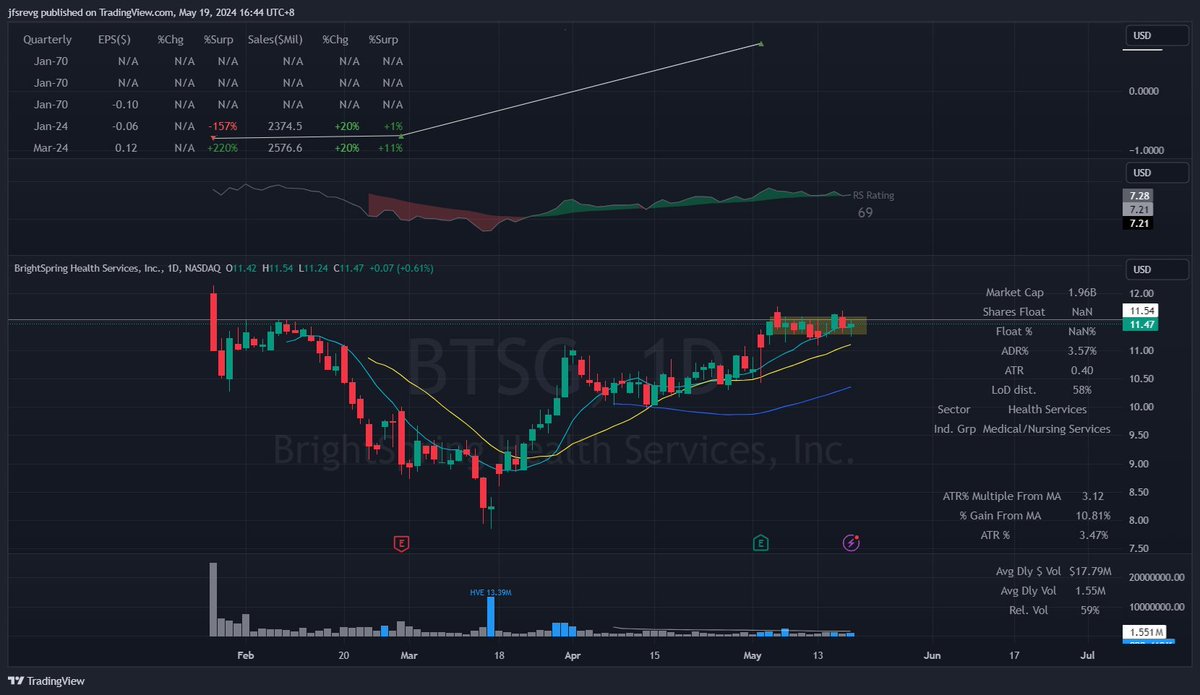
A collection of my @tradingview threads on hacks, indicators, templates, screening and follows.
1. My template and valuable free community tools
https://t.co/gduI7z4Mn3
2. ADR% multiple from 50-MA indicator, courtesy of @DumbleDax (1,000+ free users)
https://t.co/X5KQDfjkxU
3. Swing Data Indicator, courtesy of @DumbleDax (1,300+ free users)
https://t.co/2NWd5z53pX
4. How I interpret and apply Swing Data (LoD, ATR, etc.)
https://t.co/fGhMrnuc5N
5. New TradingView Version 2 (v2) screener along with multi-chart display
https://t.co/owUaqjsHUg
6. Screening within Watchlist
https://t.co/50ZXjyEQV7
7. My 14 screens parameters & daily watchlist screening process on v2 screener (Video)
https://t.co/NSYbzXV0kg
8. My additional Hottest Stock Screen
https://t.co/xBLNPSONqe
9. New Tradingview ETF screener
https://t.co/USs3Qr4WLo
9. Solution to real-time RVOL watchlist tracking for strong volume footprints
https://t.co/SfO8FqA6GD
10. Tradingview Earnings Page
https://t.co/ZcmN2d2xwW
11. Volume Delta (VD) Indicator I'm researching
https://t.co/0H2i4gRrBw
12. Direct feedback, suggestions, and improvements from the community in collaboration with TradingView
https://t.co/zlMsjYg7RL
13. Recommended follows for valuable free Tradingview scripts/indicators and solution @DumbleDax@amphtrading@JohnMuchow@finallynitin
BONUS: Best productivity hack for X users (Video)
1. https://t.co/uBCIIg5RaC
2. https://t.co/GNFqPmTMx2
double the optimal bet size and a 60% win rate compounds to exactly zero
not smaller. zero. the edge stays real and the growth rate dies anyway
that's the part of the kelly criterion nobody quotes
john kelly, bell labs, 1956. one formula for how much of your capital to risk
f* = (p·b − q) / b
p is your win probability, q is 1−p, b is your win-to-loss ratio
the output is the fraction that maximizes long-run geometric growth
worked example. 60% win rate, 1:1 payoff:
f* = (0.6 × 1 − 0.4) / 1 = 0.20
twenty percent of capital per trade. that's the growth-optimal size
now the asymmetry retail never sees
in continuous form the growth rate is g(f) = f·μ − f²σ²/2
it's a parabola. it rises to a peak at f*, then falls
and it crosses zero at exactly 2f*
so betting 40% instead of 20% on that same system doesn't halve your returns
it deletes them. same edge, same win rate, zero compounding
past 2f*, the growth rate goes negative and ruin becomes mathematically certain despite a positive expectancy
that's how traders blow up holding a strategy that actually worked
the strategy was never the problem. the fraction was
which is why desks run fractional kelly
half-kelly gives you 75% of the growth for half the volatility
that trade is why AQR, PDT, two sigma all size below the theoretical optimum on purpose
retail asks "how much can i make on this trade"
a desk asks "what fraction keeps the geometric mean positive across every sequence this system can produce"
kelly published in an open bell labs journal in 1956
thorp used it at princeton-newport for 19 years without a losing one
the formula was never the secret
the secret is that the curve punishes overconfidence harder than it rewards a better signal
full breakdown in the article below