1 nanosecond in HFT, stretched to 1 second, makes a blink of an eye last about 10 years.
Sameer Kumar (iRage), Stefan Jansen (@ml4trading), @G2GAjaySharma, Tony Lee (Alpaca) and Mridul Arora (Elevation Capital) at our Algo Trading Conference 2026 👇
#AlgoTrading#HFT #QuantTrading
@SystematicPeter About 550 trades since 2016 is roughly 1 a week. Is the quieter year fewer days passing the filter, or the usual count with smaller moves? I can't tell which from a trade-number axis.
@TedHZhang The S&P 500 has closed at a record on only about 8% of days since 1950, so even the index is in some drawdown most of the time. I'd read the 95% as what a noisy rising series tends to look like. Depth and length are what I'd track.
@banquetsbetter SPY has closed far enough down to put a spread this far out at max loss on about 1 day in 26, but those days tend to bunch up. Most came within a week of another one. So at 9:1, the week after a big drop is when I'd go smaller or sit out.
@Little_K_Story The wait tends to cost most when the stock runs up without ever reaching your strike. Chasing it with a higher strike is tempting, but then it's no longer a price you chose in advance.
@MannarNitin On Nifty, how do the skipped days compare with the days the bot trades? If they make much less for the same risk, the filter may still be doing its job there, even with no loss to show for it.
@MikeZaccardi@Bluekurtic Several of the dates are only days apart, so their windows cover mostly the same days. If you count each cluster once, from its first date, you get about 7 episodes. SPY did rise after every one, but the median gain drops from 3.1% to 1.6%.
@SmallCapSmarts Locates affect the backtest too. If it assumes every short could be borrowed, rerun it with only the names you could locate that morning. If the ones you couldn’t borrow were among the best trades, the two results will be far apart.
@ethanrkho@annanay In practice, that weighting decides the quote. With little evidence behind the fair value, you quote wider and smaller. With a lot, you can quote tighter. The fair value can be the same in both cases.
@KrownCryptoCave Going by the chart, bitcoin fell less than the Nasdaq or rose in 7 of the 13, and fell more in the rest. So holding up better has happened about half the time. The -21.1% median is just the row where one group ends and the other starts.
@GammaGirlLab The jump from 1.18x to 2.5x looks to be mostly because SPX is now close to the flip. A 1% rally takes it almost there, where dealers stop having to buy. A 1% drop takes it further away, where they have to sell more. On Friday, it was far from the flip either way.
Method: VIX and S&P 500 price index via Yahoo, 1990 to Oct 2026. Episode = first close above 30 after 60+ sessions without one; 12 months = 252 sessions. A 20-session rule gives 62%, 126 gives 80%. 21 cases, a small sample. History, not a forecast. Not investment advice.
"Buy when the VIX is above 30" looks great if you count days.
The VIX closed above 30 on 734 days since 1990. The S&P 500 was higher a year later after 87% of them.
But that's only 22 separate scares. Of the 21 with a full year, 14 were higher (67%). Any day: 81%.
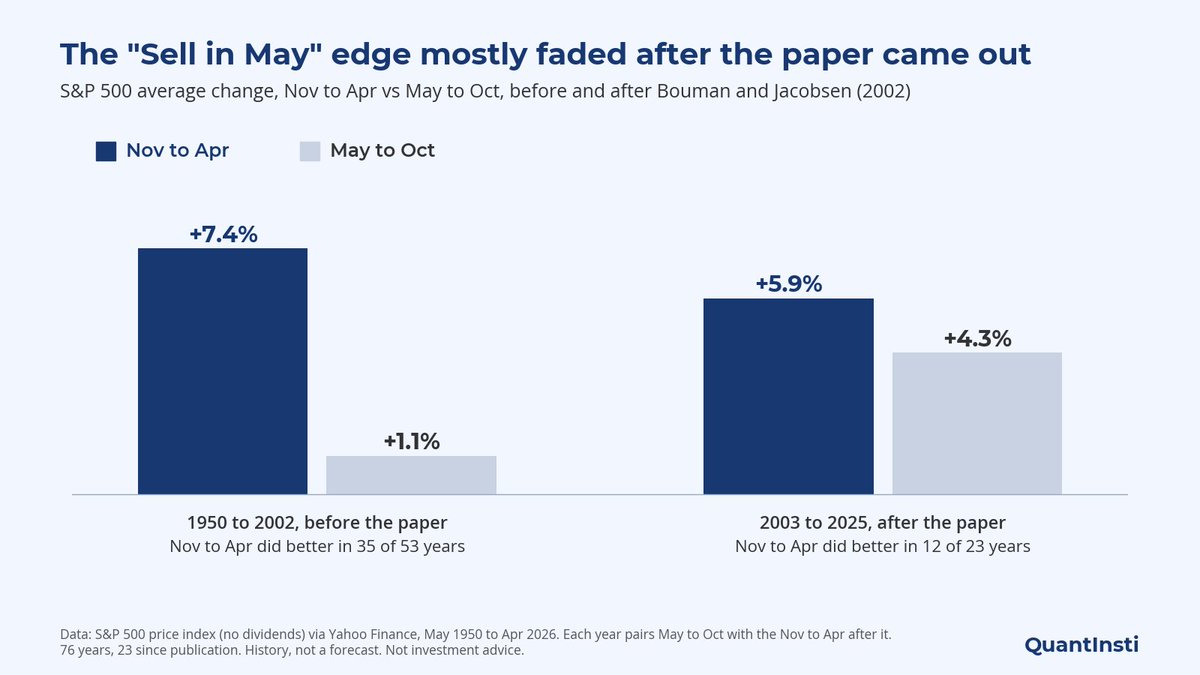
Method: S&P 500 price index (no dividends), month-end closes, May 1950 to Apr 2026. Each year pairs May to Oct with the Nov to Apr after it. Averages: +7.4% vs +1.1% to 2002, +5.9% vs +4.3% since. 23 years is a short sample. History, not a forecast. Not investment advice.
"Sell in May" mostly faded after the paper that made it famous.
Bouman and Jacobsen published the Halloween effect in 2002. S&P 500, 1950 to 2002: Nov to Apr beat May to Oct in 35 of 53 years. Since 2003: 12 of 23, a coin flip.
May to Oct still averaged +4.3% since 2003.
@JoachimMo1985 Does turnover jump inside that circle before the curve does? Messy stretches in momentum tend to be leadership flips: the book keeps getting rebuilt, pays the costs, and the trend never comes.
@fullportnik That low is measured against the entry, the gentle version. From an interim high inside the window, 13 of those runs pulled back over 5%; only 3 ever closed that far under the election-day close.
@graphbluff Filled-only markouts tend to run optimistic, because the fills you got are the ones nobody faster wanted. Log the misses too, against the mid you would have hit. In my experience that curve decays faster, so speed gets undersold.
@choffstein Fair, and 2022 is the test: TIP lost about 12% while IEF lost 15%, so the contractual leg protected the coupon, not the price. A trend overlay was short duration for most of that year, which is the part of an inflation shock TIPS can't contract away.
@MicNguyenn105 48% on the front expiry is an expected move of about 2.5% for the session, against roughly 2% further out. The gap is one day's news being paid for, and it goes once the close lands inside the band.
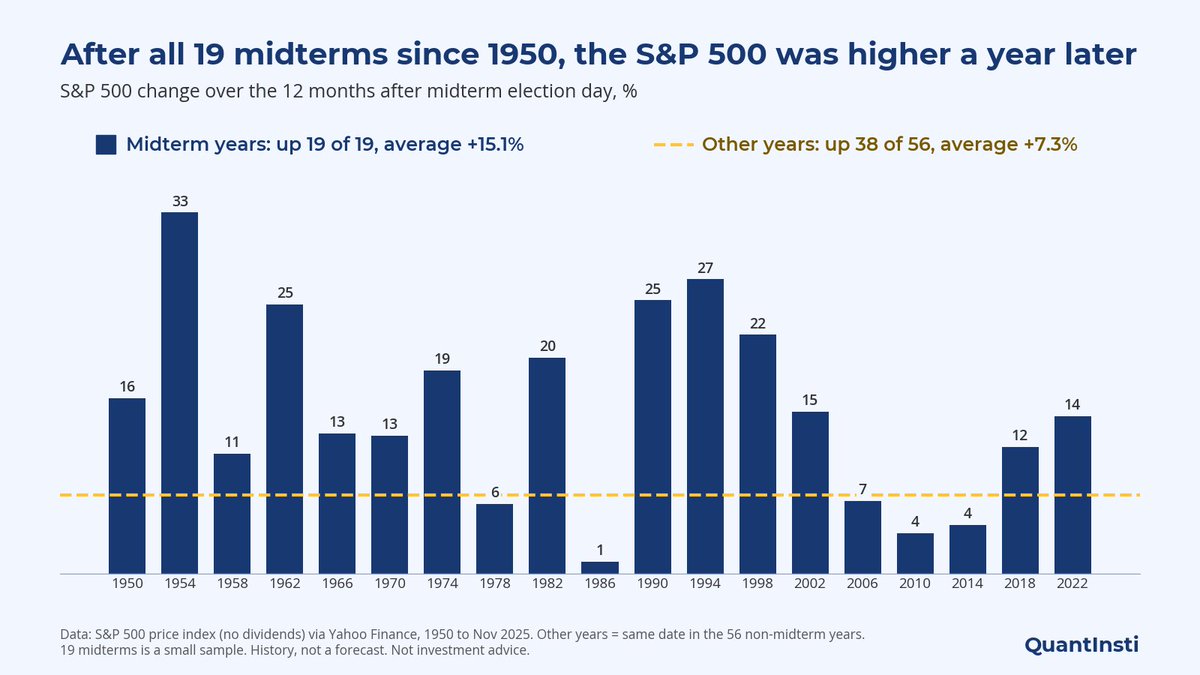
Method: S&P 500 price index (no dividends), close on election day to the close a year later, midterms 1950 to 2022. Other years: the same November date in the 56 non-midterm years, 1951 to 2024. Data: Yahoo Finance ^GSPC. History, not a forecast. Not investment advice.
The S&P 500 was higher a year after every US midterm election since 1950. All 19 times, average gain 15.1%.
The same date in other years: up 38 of 56, average 7.3%.
19 cases is a small sample, and part of the gap is the Nov to Apr season. A base rate, not a forecast.