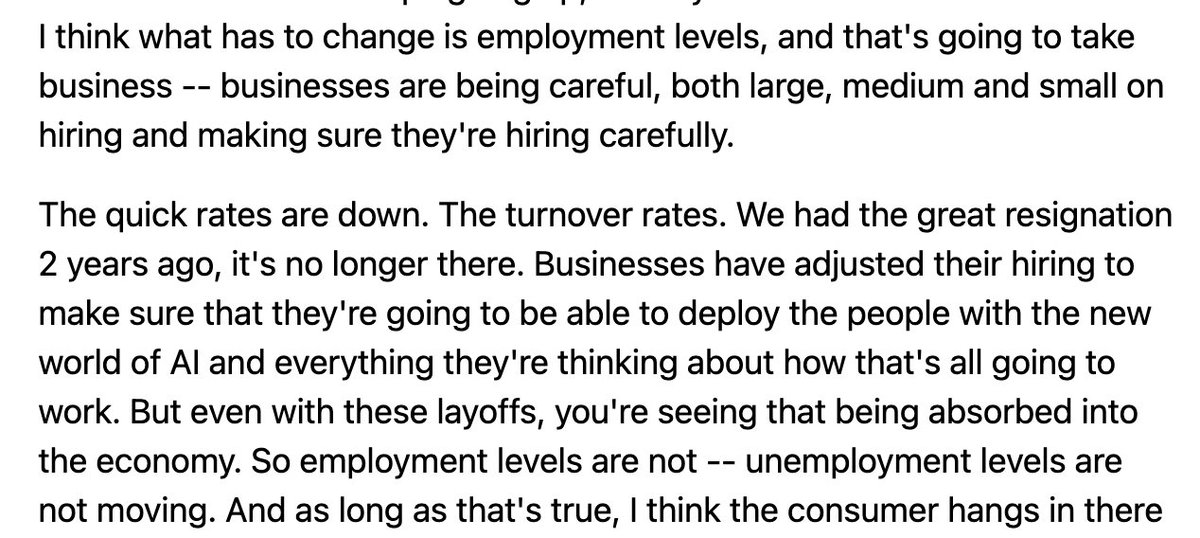
Moynihan makes case that past correlation between confidence data & spend has broken down. Now more linked to employment - certainly evident in past couple of years with horrible UMich vs consumer strength. Employment needs to crack for consumer to. $BAC $V $MA $XLF $XLY $XRT
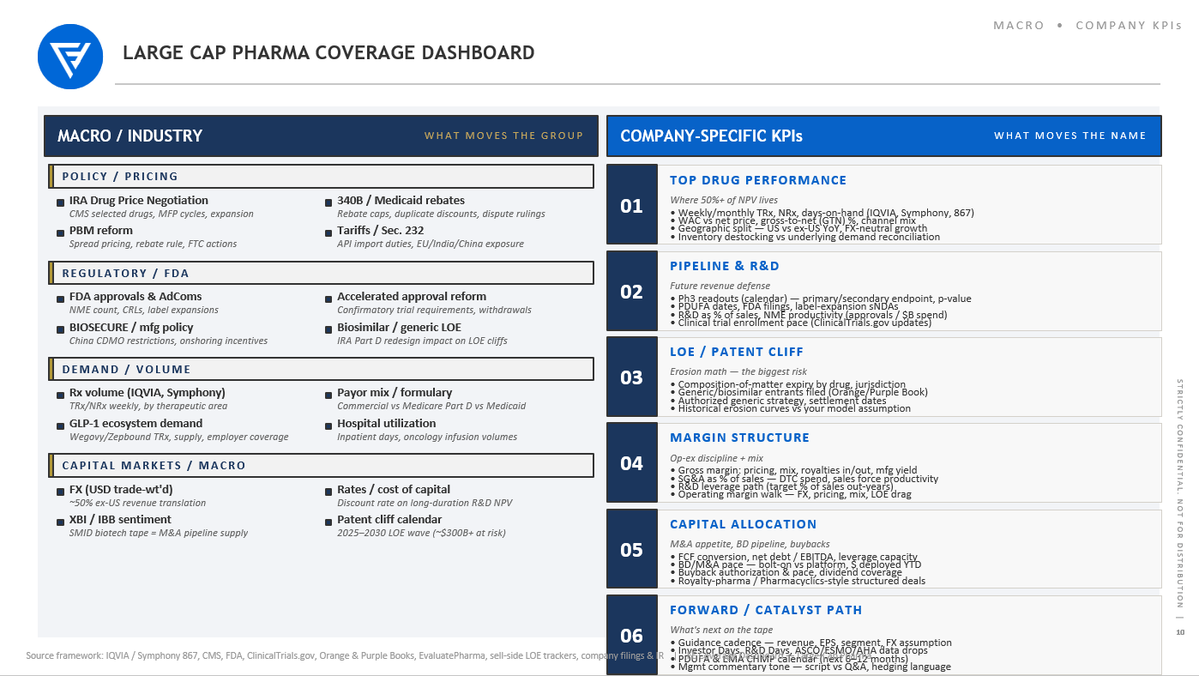
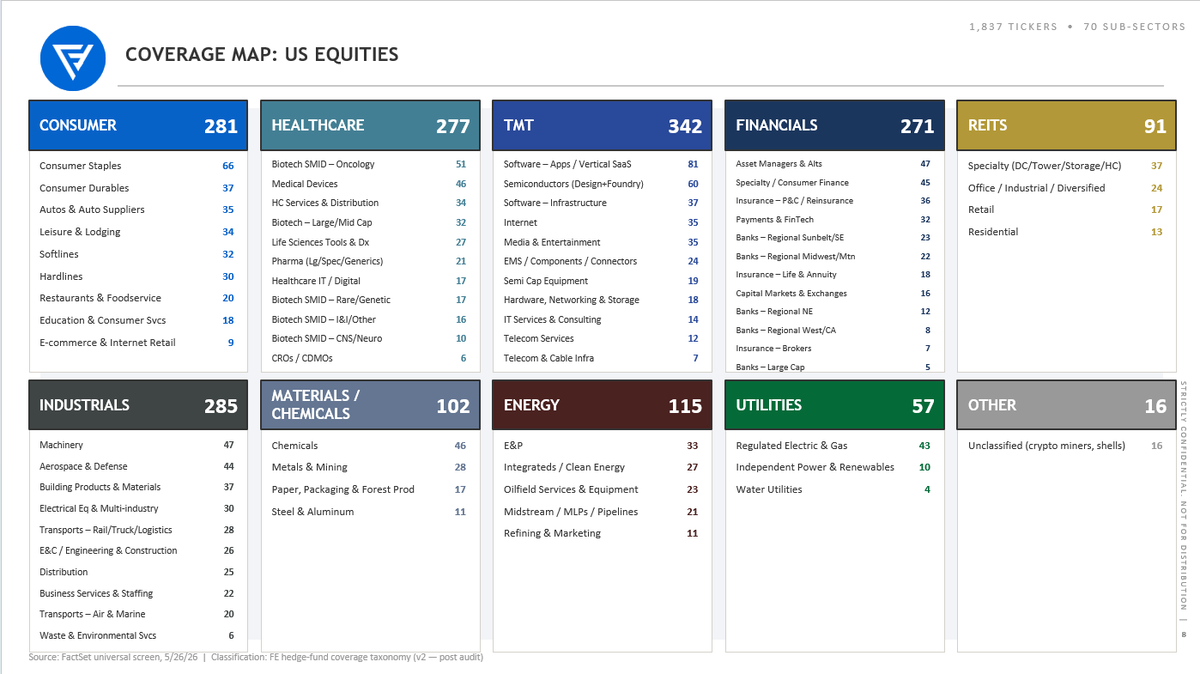
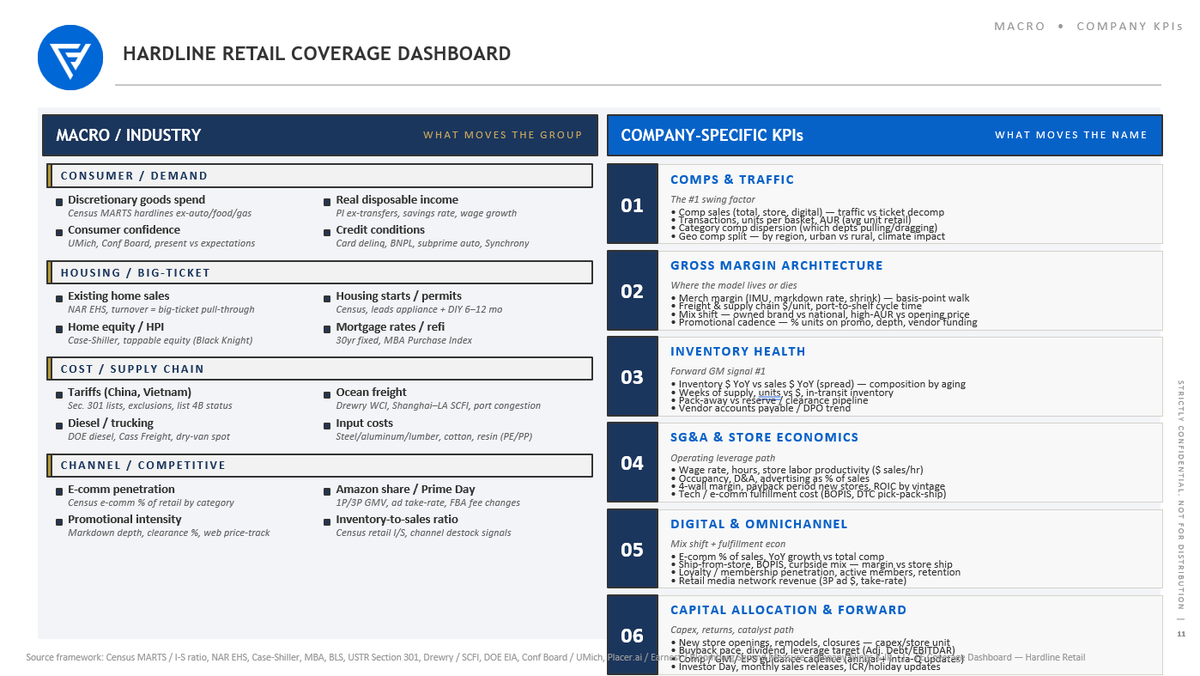
Sharing a few screenshots from one of the more ambitious projects I'm working on right now with respect to agents & investment process: creating coverage dashboard prototypes for all 70 US equity sub-sectors, breaking dashboards into "What Moves the Group" and "What Moves the Name".
I think most technologists don't quite comprehend the investment process differences between a SMID biotech pod analyst vs. a long only midstream MLP analyst vs. an Asian financials Tiger Cub analyst. Public equity investment process is highly heterogeneous and the combinatorial complexity (~a dozen different investors archetypes in ~70 different sub-sectors) hasn't lent itself to easy augmentation with chatbots. Mass customization from a pool of universal process primitives with Agents is a key unlock and I'm wondering how much pre-configuration will happen vs. a thousand flowers blooming from blank agentic workspaces...
My belief: if internal AI teams or vendors can pre-configure coverage dashboards to be immediately value added to the investment process, this forces the agentic "aha moment", accelerates diffusion of agents into investment process, and requires approximately zero time & focus from the investment team (the leverage happens on the back end). Also, if the user interface is configurable, the path to customization from this starting point is immensely easier than solving the blank page problem.
This is VERY conceptual on "what to build" and weak on "how to build", but I'm at the stage on some of this where I am beginning to explore both partnerships with builders and co-development with investment firms.
Please reach out via DM if this resonates.
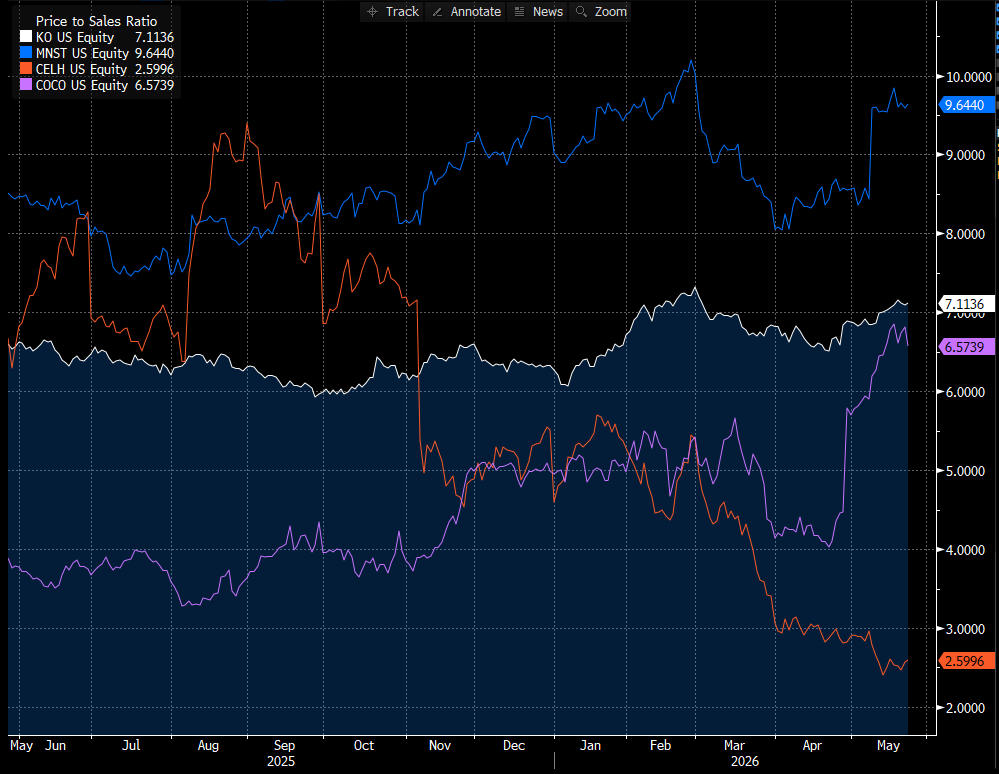
Restaurants Post-Mortem - Sorted by Revenue Outlook Changes
This one is probably a bit misleading as Cava + Dutch Bros are growing unit count the most (I think?), whereas Starbucks is consolidating stores. Interesting to see high growth name Wingstop at the very bottom.
$CAVA $BROS $LOCO $KRUS $RRGB $YUMC $WEN $DIN $CAKE $DRI $YUM $BLMN $QSR $EAT $SHAK $BJRI $CBRL $CMG $TXRH $FWRG $SG $PZZA $JACK $MCD $PTLO $DPZ $WING $PLAY $SBUX
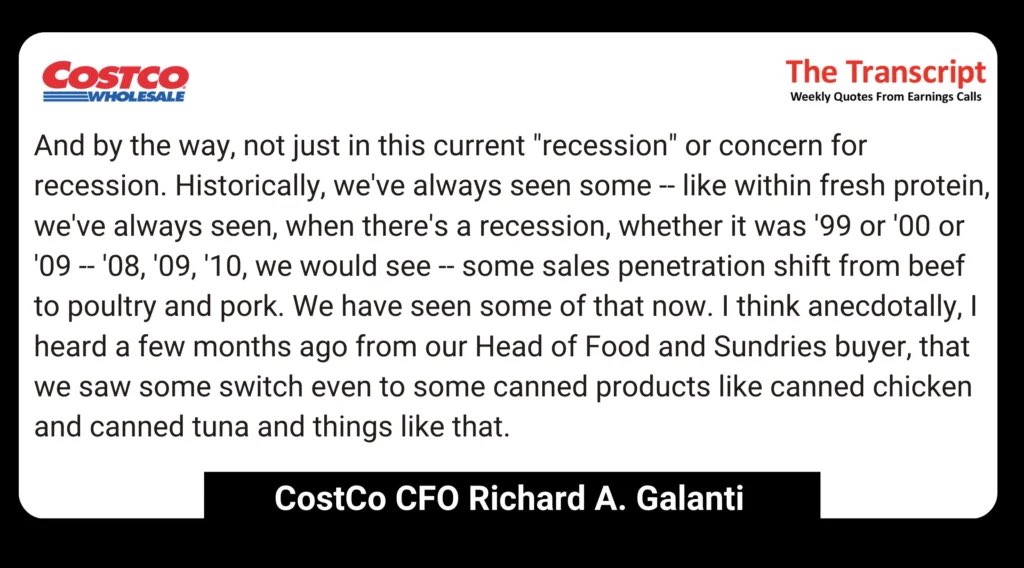
Costco spots a recession before economists do.
When members shift from beef to chicken, then to canned tuna, something in the economy is bending.
You don't need a model. You need a checkout counter and millions of members with long memories.
📷
When he started, Niccol de-emphasised Starbucks Rewards & it showed up in fewer accounts & lower balances loaded on cards between Oct 24-March 25. Now, members are up & card balances strong +6% vs +1% last Q. Loyalty may drive longer-legged recovery $SBUX $MCD $BROS $CMG
Upbeat LVMH call: US improvement included March. China best since 2023. Middle East -50% in March & at that pace would be 3% hit in full Q. Excitement over Anderson at Dior. Even at $LVMUY, top end doing best with LV weak on aspirational weakness & maybe ubiquity(?) $HESAY $CFRUY
I'm building out "AI-native" coverage on my old healthcare coverage (153 healthcare stocks ex-therapeutics that I covered institutionally for ~10 years). I am testing how close I can get to institutional-grade coverage while doing as little as possible manually: ramping research, building/updating models & building active coverage systems all in an agentic work platform.
TO BE CLEAR, the goal isn't to deploy capital and I have zero belief that I can build an alpha generating portfolio without deep focus & rigorous primary research.
However, I'm coming up with all sorts of ideas to both speed and deepen rigor on this process. It's been fun, at times frustrating, and at times mind blowing. But day by day I'm convinced that if I was back in the seat ramping coverage for real, high-stakes capital deployment, I would adopt many of these workflows.
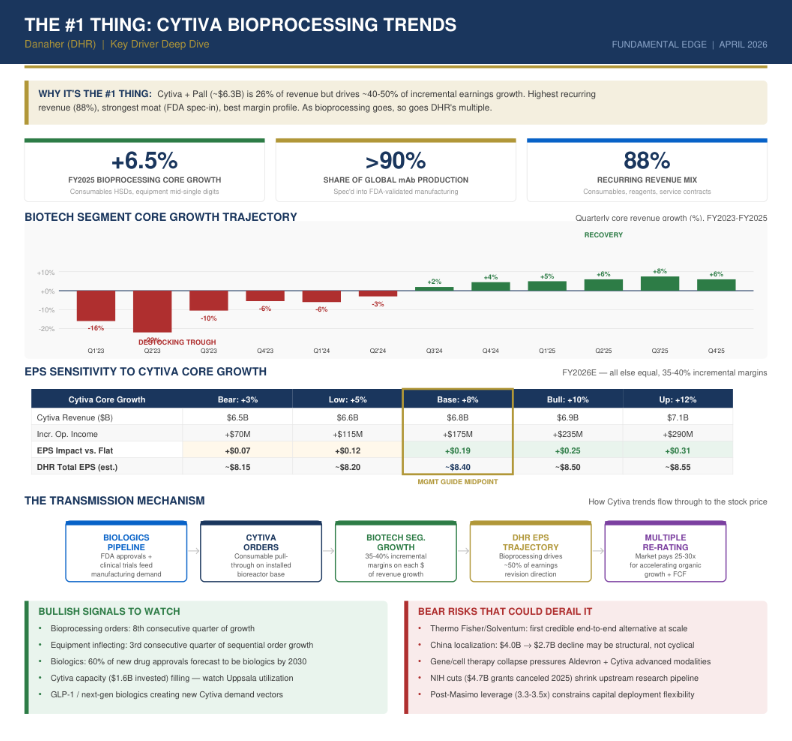
One I rather liked as a really nice triage & focus tool is a Skill I called "The #1 Thing", which is the most important fundamental metric or debate on a stock which is the key hinge point between the stock working or not. The idea is in re-embracing coverage, what is the #1 bet I would need to make on all 153 stocks to put them in the bucket of "potential long" or "potential short". This will help inform the custom agentic research process for each name.
I built this for DHR below, and I'm building this into a 153 page report (1 per name under coverage). This will help me understand, across my coverage, the active research I will need to deploy to build active, deep dive agentic research & the proper tracking systems for the #1 thing across my coverage. Effectively, it will help my systems "climb the right research mountains".
If you are interested, I will share a bit more on how I built this on our next open webinar next Thursday (will drop registration link in bio).
So you can plug CC/OC (Claude code / open claw) into bloomberg. This method lets you plug-in w/o paying for API access. Below's a dummy overview of the back-end flow.
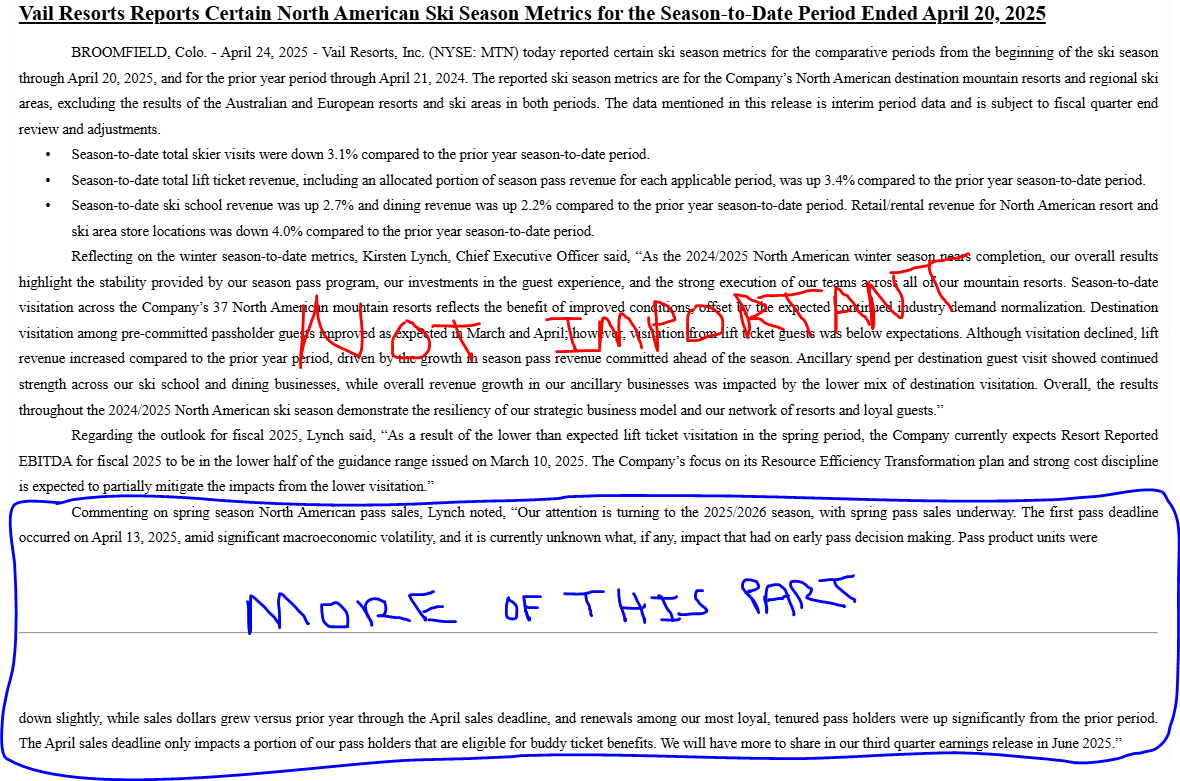
MTN
Vail typically provides an end of the season update in late April (as FY Q3 earnings aren't until early June)
Given it's:
- Katz's first April release as CEO since 2021
- This past season has been such a bust (weather) & is irrelevant for the stock
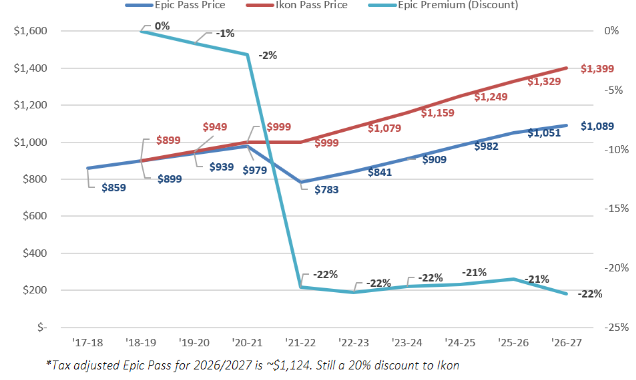
- The pass offerings for the 2026/2027 season have seen the most meaningful change in years (mostly the young adult pass, but also first full yr of Friend passes, + a slightly lower px hike)
& passes will have been on sale for ~7 weeks-
*If* early pass sales are promising (read: less awful than the 2025/2026 on-mountain data), why not provide a bit more color/commentary/numbers around units, comparison to prior years, what products are resonating, etc. etc.?
Turnarounds take time & seasonality makes progressive fixes even slower/harder to see. Added transparency & update frequency can offset this some.
It's also just a presser w/o a call, meaning it's hardly a new obligation (unlike a formal KPI) & is something that's easy to simply not publish in subsequent years if/when the stock's not so depressed (& there are not calls for a breakup/asset sales)
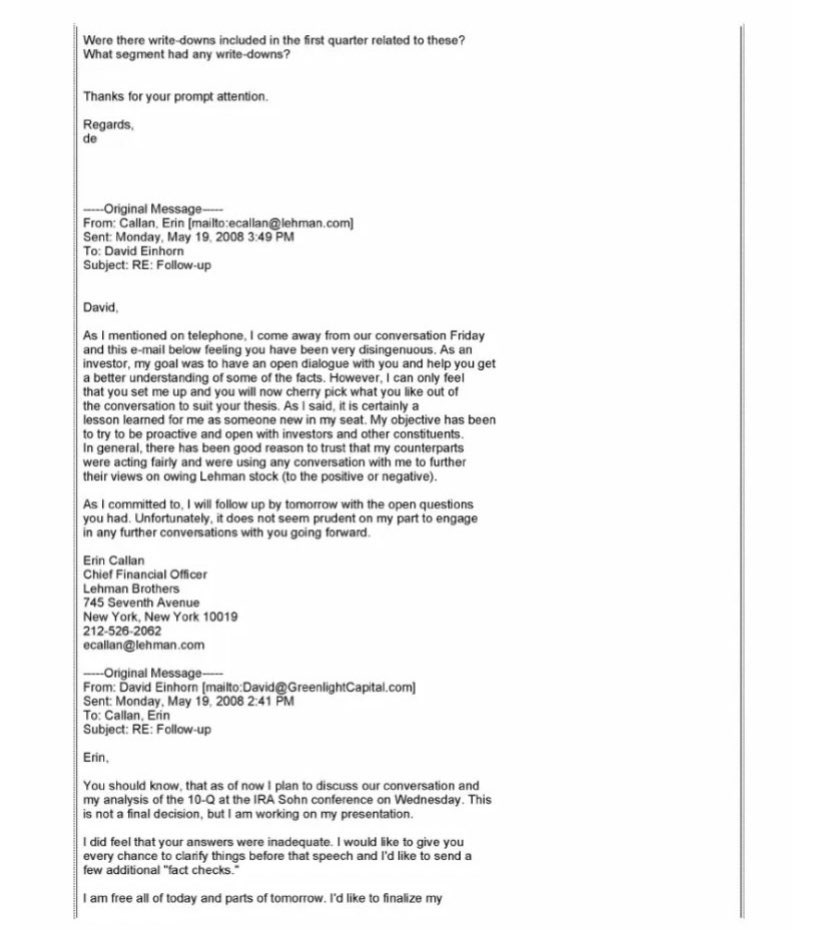
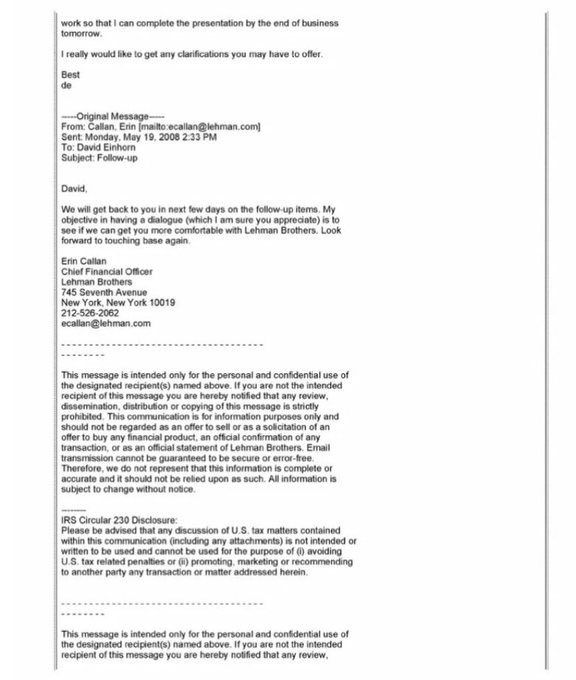
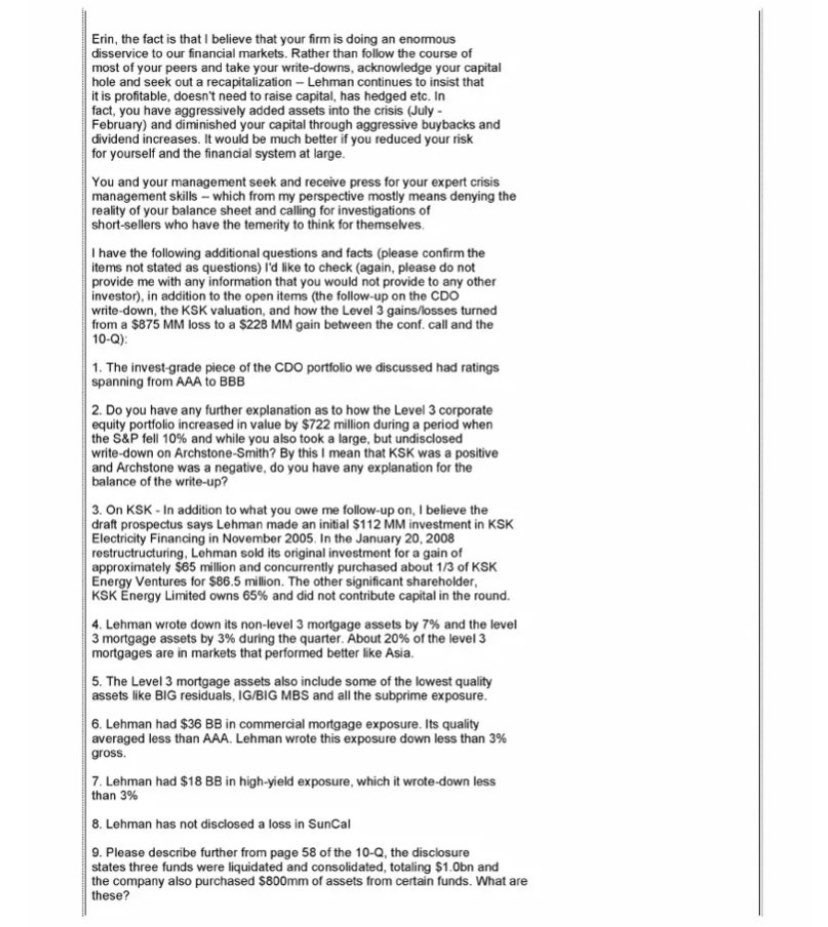
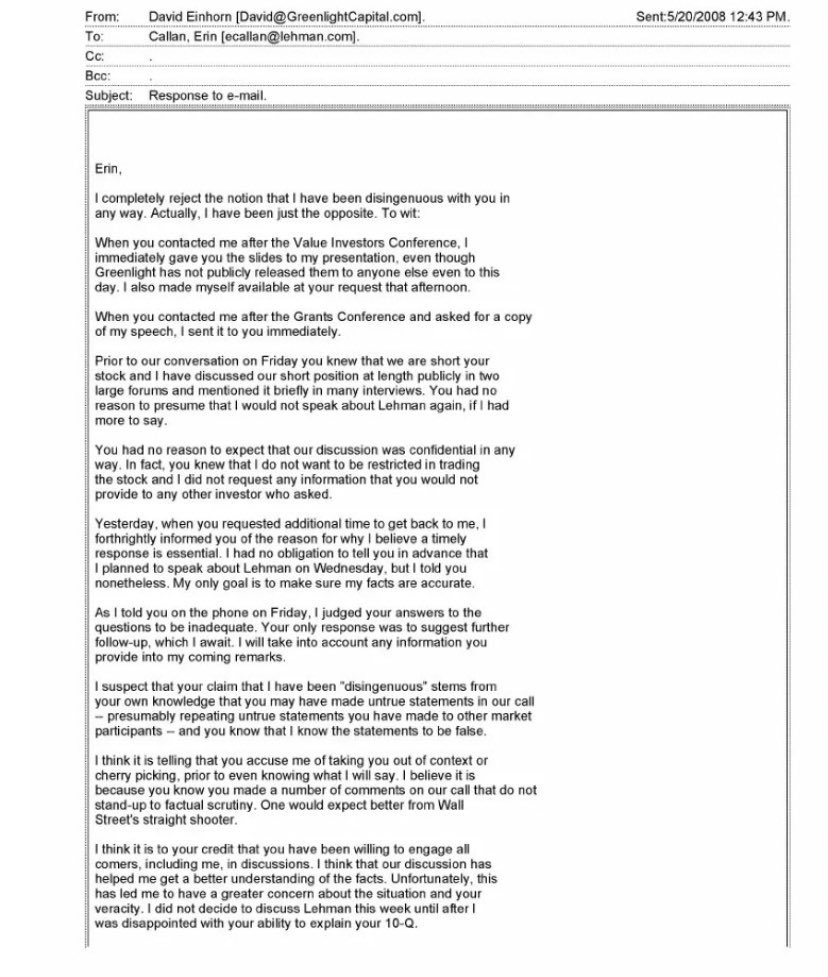
In 2007 , David Einhorn announced Lehman as a short at the Value Investors Conference
Here is his communication with Erin Callan , the then CFO at Lehman.
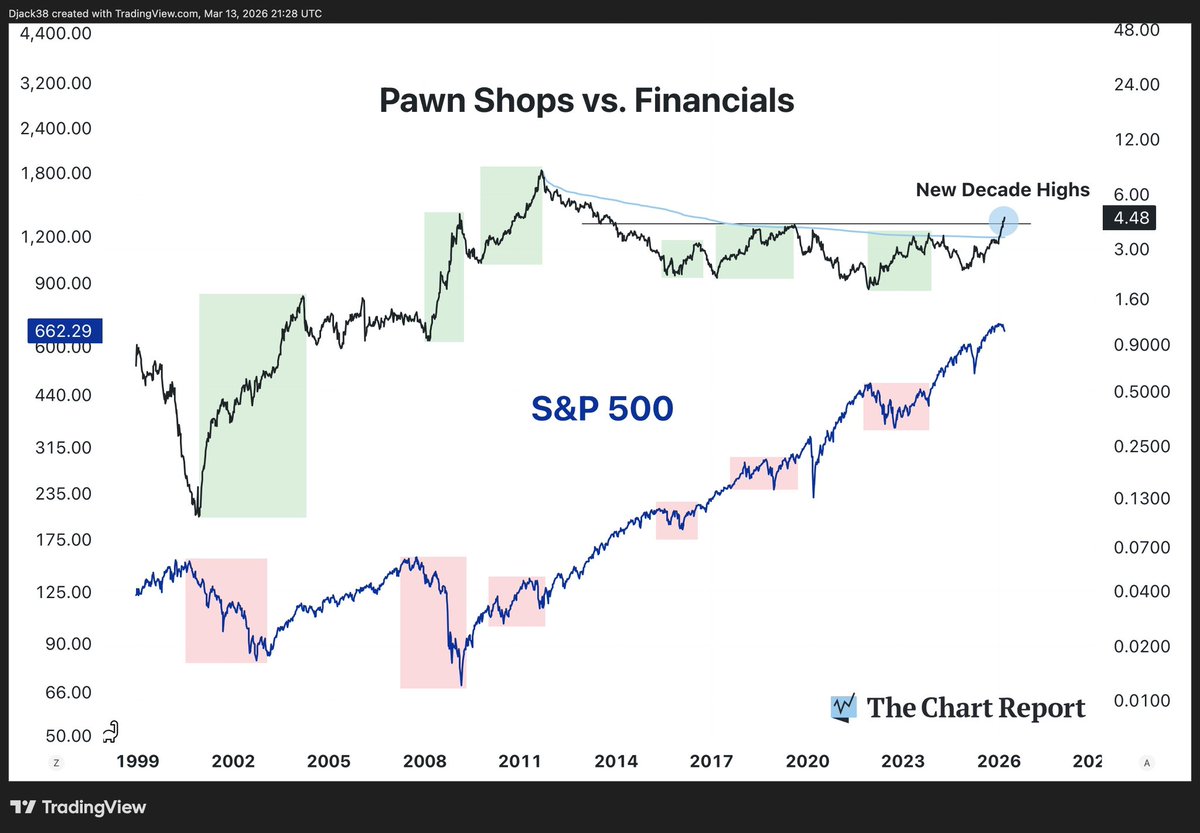
When pawn shops outperform financials, history shows the broader market environment tends to be messy.
Well, pawn shops have broken above their all-time high avwap and are making new decade highs relative to financials.
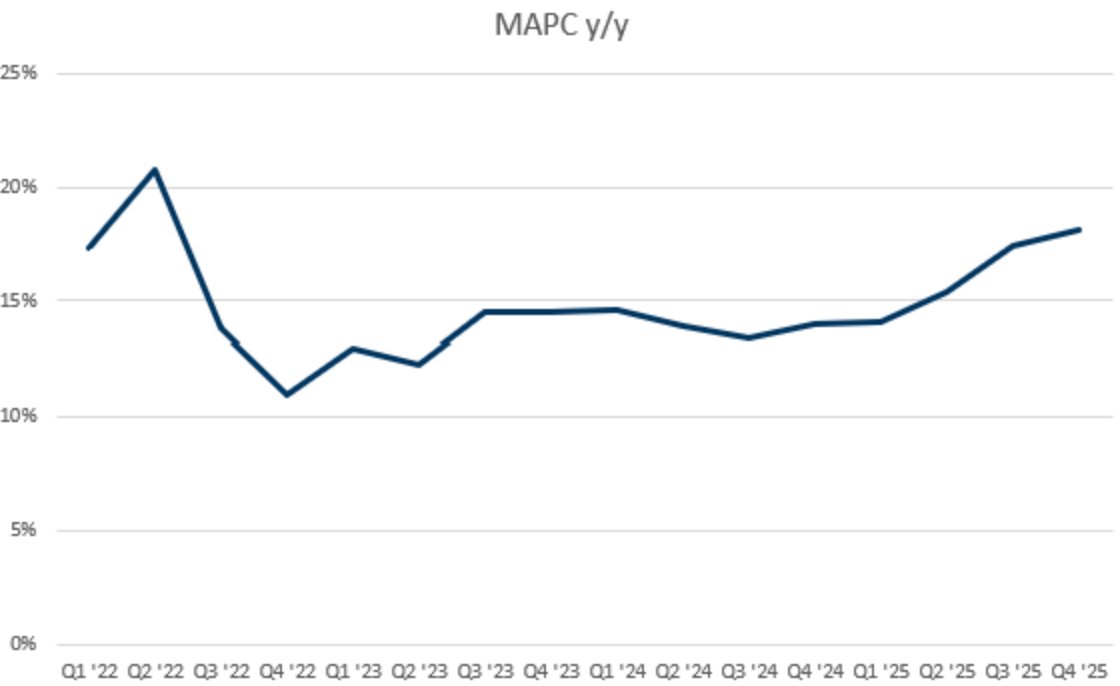
I own a material amount of $UBER, and if the wife thought she could stop hearing about it, she was WRONG. One of the first things that should jump out to you from 4Q results is that user counts were very strong. The first chart way down below is quarterly MAPC y/y, which the last several quarters has been accelerating. Not bad for a company at such massive scale and n.b. that most SS models assume MAPC growth rates decelerate, as that's a natural starting point assumption.
There are several squishy reasons one could imagine why MAPC might be outperforming. Generally speaking, two sided marketplaces benefit from liquidity so they often have accelerating returns to scale. Eats is a more luxury good so it should be later in its maturation curve. Int'l expansion. Millennials are fiscally irresponsible morons who never got drivers licenses. Etc. Given I'm a HF guy though, we'll use data.
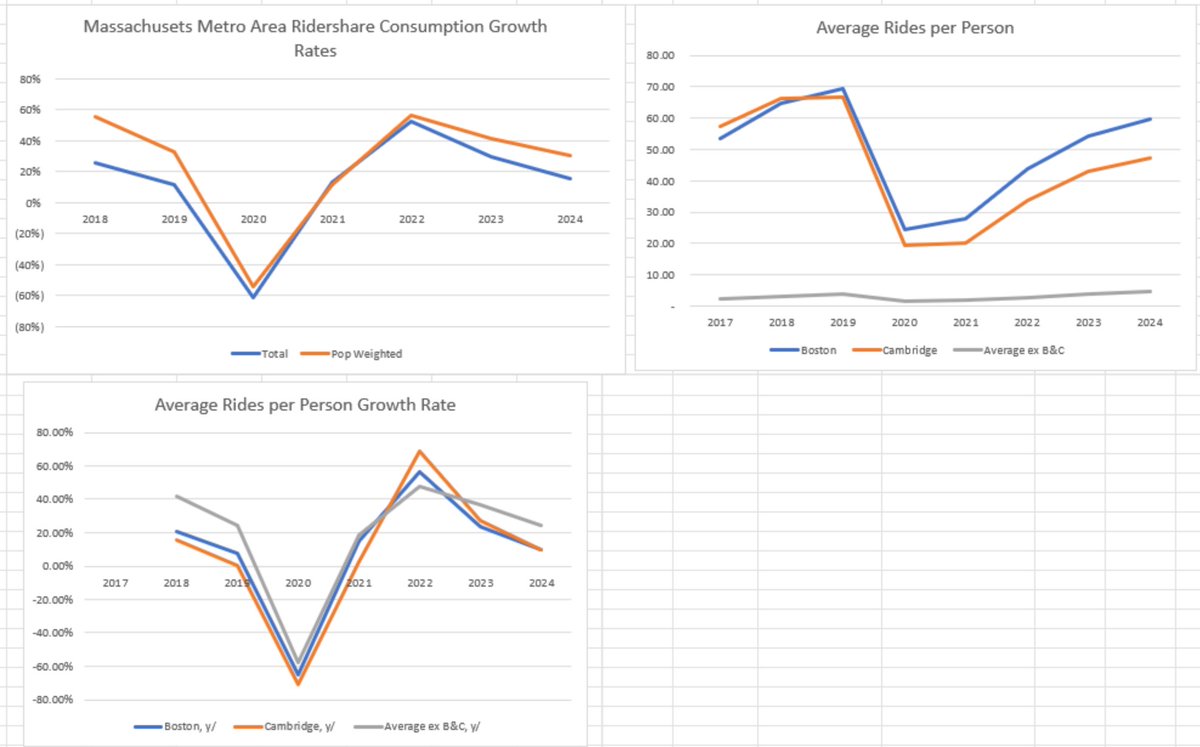
For this exploration we are going to use Massachusetts reported annual ride share data by metropolitan area, which is one of my favorite reported alt data sets I've ever seen. Just fantastic insights within it. Anyways, Massachusetts rideshare consumption rose 15% in 2024. It will not shock you to learn that many people in Massachusetts live in Boston. Boston + Cambridge are 11% of the population, and that excludes all the assoicated big suburbs like Brookline, Revere, Newton, etc all of which are ~1% each etc. It will also not shock you to learn that generally speaking, Boston is rich, and many of the out of the way parts of Masachusetts are shitholes.
If we simply decompose Massachusetts ride share consumption growth into Boston, Cambridge, and ex-B+C we see that B&C are growing ride share consumption around 10% per year. But the other regions are growing at 22%!!!! Including some real standouts. Tier 2 cities like Worcester and Lowell are growing 25% and 21% y/y. There is effectively a 12 point gap of outgrowth in the less dense areas.
We can then look at per person consumption. Boston contributes 59.6 rides per person per year. Cambridge contributes 47 rides per year. Meanwhile the average Massachusetts ex-B&C municipality contributes 4.7 rides per person per year. This is dragged down by a bunch of rural areas at ~0 per person, but the Tier 2 cities of Worcester and Lowell are at 11x and 3.7x per person per year respectively. So on an order of magnitude, ride share intensity is ~5-10x+ higher in the densest cities.
Meanwhile, per person consumption for Boston & Cambridge is growing around 9.5% (n.b. this approximates its total growth rate. This makes sense because intuitively no shit everyone in B&C has Uber installed on their phone). But the average per resident growth rate in ex-B&C areas is 24% (!!!). In our Tier 2 city examples of Worcester & Lowell it's 26% and 34%. Massachusetts regional populations are (probably) not growing 24% per year on average, so here we have our statistical indication that indeed a lot of people are still only starting to incorporate rideshare into their life in a meaningful way.
There are three primary takeaways here.
The first is that growth is effectively de-risked for the intermediate term. Waymo, Tesla, and friends could drive B&C growth to literally 0 and there would still be ~7% total growth for Massachusetts rides (51% of the total ride base growing at ~15% per year). Waymo, $TSLA, and friends are not going to drive B&C consumption to flat in 2026 given that the services don't exist yet and won't until late 2026 at the very earliest. So even in big, mature markets like Boston, double digit KPI growth is extremely likely. That's honestly amazing.
Secondly, the TAM is fucking huge. Unbelievably large. The vast majority of people in Massachusetts don't use ride share at anything approximating the usage of the urban centers, let alone the usage of a HF asshole in New York. AV will collapse a lot of urban adjacent ride share profiles towards the urban which alone is a massive usage expansion. And that's before we unlock material new use cases from AV (longer commutes, more travelign to the Cape, kids can travel unsupervised to friends', less drunk & high driving, etc).
Thirdly and perhaps most importantly, contrary to popular fears, Uber has time. The predominance of their growth is in the areas that are LEAST susceptible to immediate AV disruption by $GOOGL and TSLA. Google and TSLA very clearly in 2026 and 2027 will not and cannot reach the Worcestors and Lowells of the world, let alone the random suburbs on the Cape or Nantucket (growing 20% y/y) or even the big bulky Boston suburbs like Brookline (growing 12% y/y). Uber has many partners. LCID, May, Wayve, WeRide, Pony, NVDA, Waabi, STLA, Nuro, Motional. These are all names that are EXPLICITLY adding and going to add AVs to the Uber network.
Pick a timeline for when you believe Waymo or TSLA will be able to start meaningfully generalizing their fleets to the ex-B&C areas we've been discussing. 2027 at ealiest? 2028? 2029? Well then, as long as one or some of the above listed partners have started to scale their own AVs into the Uber network by that point, then Uber's AV internalized outlook is also extremely strong. Based on the realized progress and steps thus far, that's extremely likely. It's literally already happening. You can call a car via Avride in Dallas. May Mobility in Texas. WeRide in half the Mid East. Baidu too today. Wayve in London expected this spring. LCID allegedly going to onramp like 6k cars into the Uber network. By the time Waymo and TSLA start reaching the long tail of Uber growth & TAM expansion, all these partners will be competing too, and they'll be competing via the Uber network's liquidity.
We haven't discussed delivery at all here, but note it has a lot of the same characteristics in terms of growth that it is still a relatively a low penetration luxury good that benefits from rising marketplace two sided liquidity. And as it grows mind share it becomes stickier + perpetuates lifestyle changes that ingrain it further into consumption patterns
We also haven't discussed advertising which is 2bn sales growing 50% y/y (lol)
We also haven't discussed that Uber validly has a differentiated long term value prop via the complete integration of mobility + delivery + freight.
So we have a company that has derisked DD+ topline growth for at least two years, that trades at an ~6.5% forward FCF yield, that is buying back ~1% of its market cap per quarter, that has 9bn of investments held, that is ~0.5x levered, that has clear visibility into its TAM growing enormously, that grows EBITDA at almost 30% incremental margins, that has around 20% FCF margins, that has no Claude disruption risk, and that has a call option on being the absolute top winner in the space
Time to make some money!
Kering confirms sector wide luxury improvement, led by China. Gucci woes mean $PPRUY looks worse relative in US, Europe but other brands growing now. So far, LVMH is outlier on downside. $LVMUY $CFRUY $HESAY $BURBY $ZGN
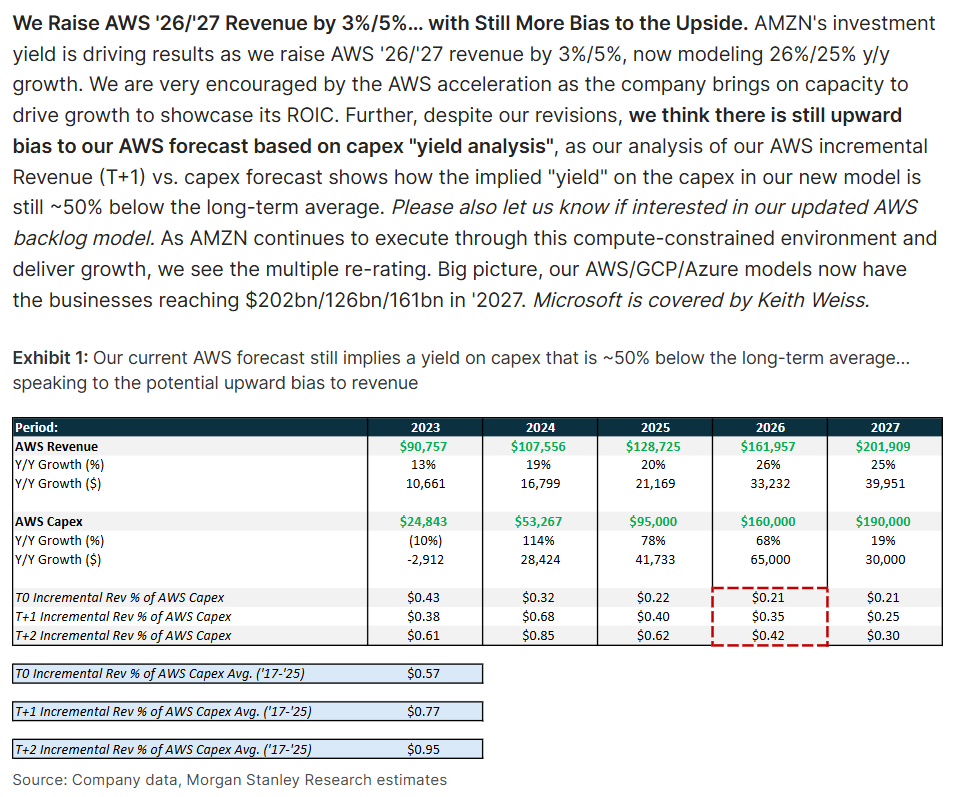
Morgan Stanley models
+26% $AMZN AWS growth for 2026 &
+25% for 2027
They are assuming very conservative 50% of historical ROIC on capex
lot of upside left on estimates
Our $DECK write-up presented to clients 12/1 and 12/30 (also mention $NKE):
DECK Write-Up
We are recommending a long position in DECK, makers of Hoka and Ugg shoes.
Hoka: channel inventory is tight and discounts are minimal compared to peers Nike and On
Running.
Ugg: new silhouettes like the Lowmel sneaker are in high demand with stock-outs reported
across wholesale and DTC channels, making promotions unnecessary. We are also
observing strong sell-through at new wholesale relationships such as Dick’s.
Given lack of promotions and high price-points for Ugg this holiday season, we think
analysts are modeling too severe a contraction in gross margin (250-300bps lower y/y)
Valuation provides a floor: the stock has de-rated from a peak valuation of 38x to 13.5x.
Based on our updated estimates, we believe the stock is trading at close to 12x, which is an
all-time low for DECK. Given where comparable specialty retailers are trading (though we
note few if any have margins close to DECK), we believe the stock should trade at 15x our
estimate for $7.25 or $108.75
Side-note: we are close to completing a proprietary running survey, but we wanted to share
some preliminary findings:
o Only 15% of runners that switched from Nike to Hoka are planning to or have tried
the new models from Nike. This compares to 40% of runners that switched from
Nike to On Running that would be interested in or have tried the new Nike running
models. We found this surprising given Nike’s long-standing position in the
“structure” category which appeals to older runners looking for stability and
cushioning.
o For runners completing between 50-100 miles per week, Asics was the most
popular brand. Of the runners in this cohort who said they switched from Nike to
another brand, only 5% were considering a return to Nike.
o The shift away from Nike to Adidas within the lifestyle category appears to be driving
interest in performance at Adidas. For respondents that voted Adidas as their
preferred lifestyle shoe, 40% owned or planned to purchase a performance shoe
from Adidas. This is up from 32% when we conducted this survey mid-year. We
don’t believe analysts are considering how the pullback in lifestyle by Nike could
create a headwind for performance running.
DECK: The Structural Shift away from Nike Structure, the all-season Ugg
Heady Creek recently performed its monthly athletic footwear, apparel, and athleisure survey. One
question we’ve been included in the survey has, over time, yielded answers that suggests previous
Nike Structure runners that moved to Hoka are less likely to switch back to Nike.
What the survey results show is that, over the course of the year, less Hoka runners were
considering going back to Nike’s Structure franchise. Hoka’s average age skews oldest across
Hoka, On, Nike and Adidas, which gives us confidence in the purchasing power of the average Hoka
runner.
Ugg has introduced a new model, the Lowmel, that is one of the best selling models ever
introduced by the brand. Most importantly, it is a sneaker silhouette and likely to be the first true allseason
shoe by Ugg. Below is a google trend graph, over the last 12 months, of “Lowmel” (blue) and
“Ugg boots” (red).