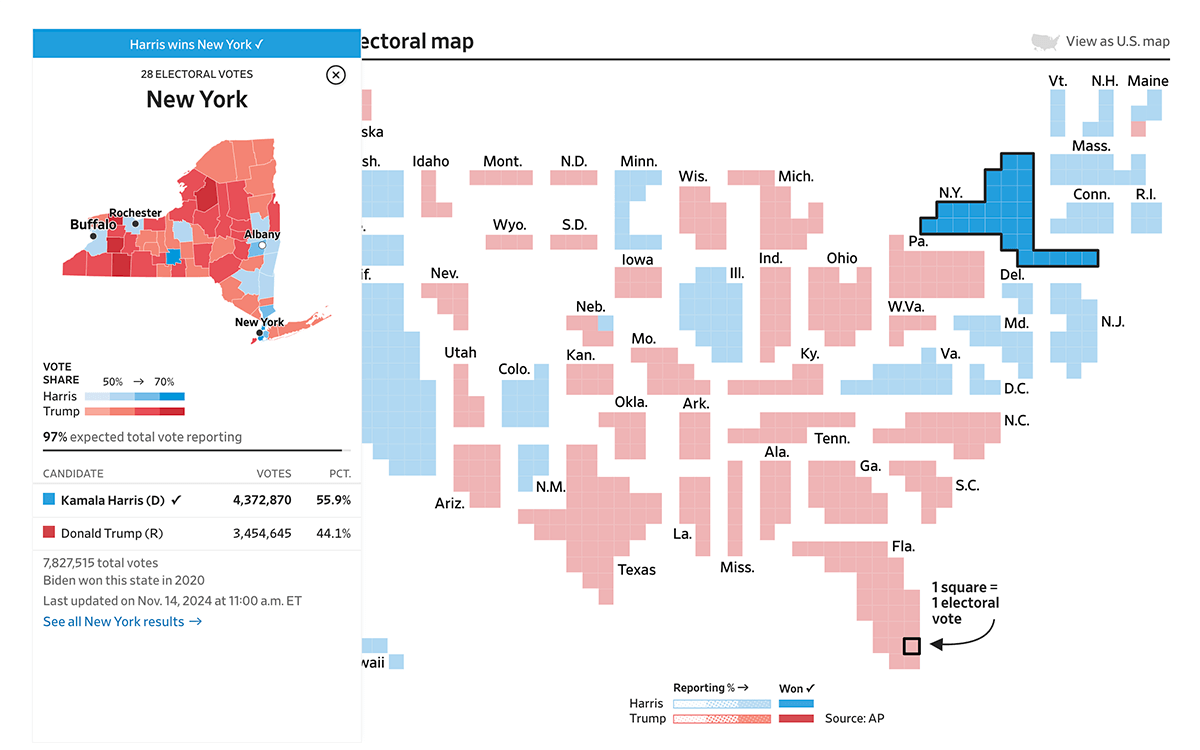
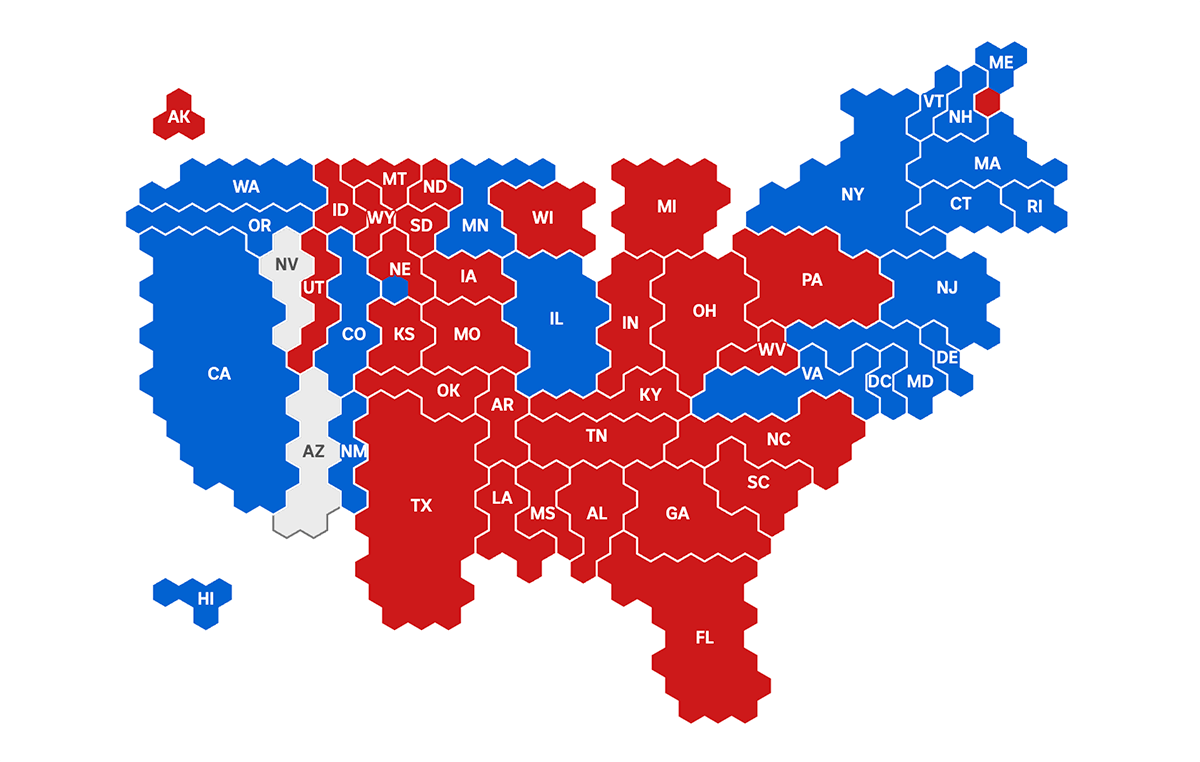
@EricPachman Great piece, one thing I might suggest for the labor force visualization tool have the ability to adjust the geographic representation of the US, to something akin to #4 or #17 from https://t.co/GBZxjgmzmg, in addition to a traditional map.
@choffstein Partially, depends on how much the price of property is the land vs improvements, and then some function of "if all of my neighbors get wiped out, what is the land cost now?".
@m3_melody As someone who was in the room w/Pimco in 2018 on the architectural side, I think the high end LA/Samo rental market then bears so little resemblance to the post covid world the project was delivered into, saying they should have known better is a bit of an oversimplification.
@jponsiglione@ModusEdge@DrJim_Walker@profplum99 The kicker for a lot of 200k+ people is child care. Easily fall between the cost of transportation and housing payments. Granted it doesn't last forever but it is a big cash flow challenge.
@GuyDealership Even Lexus' can be leased for ~1% APR (MF equivalent) with MSDs, and their days of supply are not screaming distress, then again the lease rates are no doubt helping move product.
@VladTheInflator This math is easiest to do on condos where one can compare recent rents vs recent sales. For example by me in Santa Monica w/20% down the equivalent monthly premium (P+I + Insurance + Taxes + HOA) is ~60% above what would be to rent...