@OSPSF@grok Hoskta hai Qatar naraz hai US ab U.S and Pakistan ka relationship ab we lost India or mineral ke deal k bad strong hogaya tu Donal Trump ne beja Hoga razo karo!
Fibonacci Retracement Explained:
In technical analysis a Fibonacci retracement is a trading methodology for determining high probability support and resistance levels on a chart. It uses the Fibonacci sequence and that is where its name comes from. A Fibonacci retracement uses the theory that price swings on charts will usually retrace and backfill a mathematical portion of a move, after this measured pullback the trend usually continues the move in the original direction.
A probable Fibonacci retracement level is quantified by taking two distant price points on a chart and dividing the vertical distance by using the key Fibonacci ratios. 0% is the starting point for the measurement of the retracement, and 100% is a total reversal back to the starting point of the move. Fibonacci levels are identified by measuring moves from the starting point of support or resistance.
Horizontal trend lines are drawn on the chart to identify the potential key support and resistance levels. The significant levels to look at are 61.8% 50%, 38.2%, and 23.6% for support or resistance.
A Fibonacci retracement is a very common technical tool that price action traders use to look for high probability price levels to enter trades, set stop losses in current trades, or set profit targets for winning trades.
The concept of looking at key retracement levels at possible price extensions is a method not only used with Fibonacci but also with many other methods like Elliott Wave theory, Wolfe Waves, and Gartley patterns. After an up or down swing in price the new price support and resistance levels can be seen showing up at the key retracement levels in these methods.
While moving averages can change as price moves the Fibonacci retracement levels are set prices. They are targets on the chart that stay the same. This simplifies the identification of signals and creates price levels that can be acted on immediately when reached. These levels are key reaction points on a chart and can lead to a binary action for traders as the there is either a breakout in price or it is rejected and holds as support or resistance.
The primary 0.618 Fibonacci retracement price level used by so many stock traders is approximately the ‘golden ratio’.
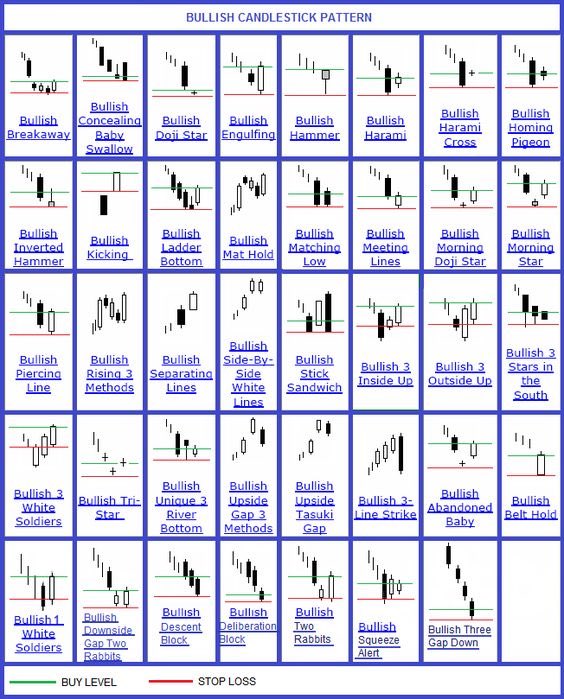
Bullish candlestick patterns on a chart visually show buying pressure. These patterns can show the possibility of a price reversal during a downtrend or the continuation of an uptrend already in place. There can be single bullish candles or bullish candlestick patterns containing multiple candles in row.
Here are some of the most popular bullish candlestick patterns:
•Hammer
•Inverted Hammer
•Dragonfly Doji
•Bullish Spinning Top
•Bullish Kicker
•Bullish Engulfing
•Bullish Harami
•Piercing Line
•Tweezer Bottom
•Morning Star
•Bullish Abandoned Baby
•Three White Soldiers
Bullish candlestick patterns visually show the success of buyers to take a price higher and buying take control of a chart for the timeframe of the price action. These are bullish signals that need confirmation with an upswing in price after the pattern forms.
The meaning and value of bullish candlesticks must be considered taking into the context of a chart pattern and their confluence with other signals. A bullish candlestick pattern that happens when a chart is oversold could signal a reversal of a downtrend. Bullish candles that happen late in an uptrend after a long term run in price after a chart is already overbought can have a lower probability of success.
Bullish candlestick patterns that have a confluence with other systematic buying signals increase the odds of a trades success.
Free Monster Guide to Candlestick Patterns by @Rayner_Teo
You'll learn how to better time your entries & exits. Also use them to see potential market turning points.
Download here, it's free $0👇
https://t.co/HMGTLwp8CE
#NTUpartner