Bear Market Trading Strategies
Bear market strategy refers to the techniques traders and investors use to trade the market during a bear run. They include entry, exit, trade management, and risk management strategies investors use to protect their assets and even make some profits during a bear market.
We backtest a bear market strategy in the stock market. The backtests below are done on S&P 500/SPY from its inception in 1993 until today. SPY is the oldest ETF still around and thus has a long time series to backtest on.
We have built a long AND short bear strategy that only trades when volatility picks up during a bear market. Both long and short have three parameters to enter a trade and just one parameter to define when to exit the trade. Long and short trades are the same for both market directions, but opposite values (of course).
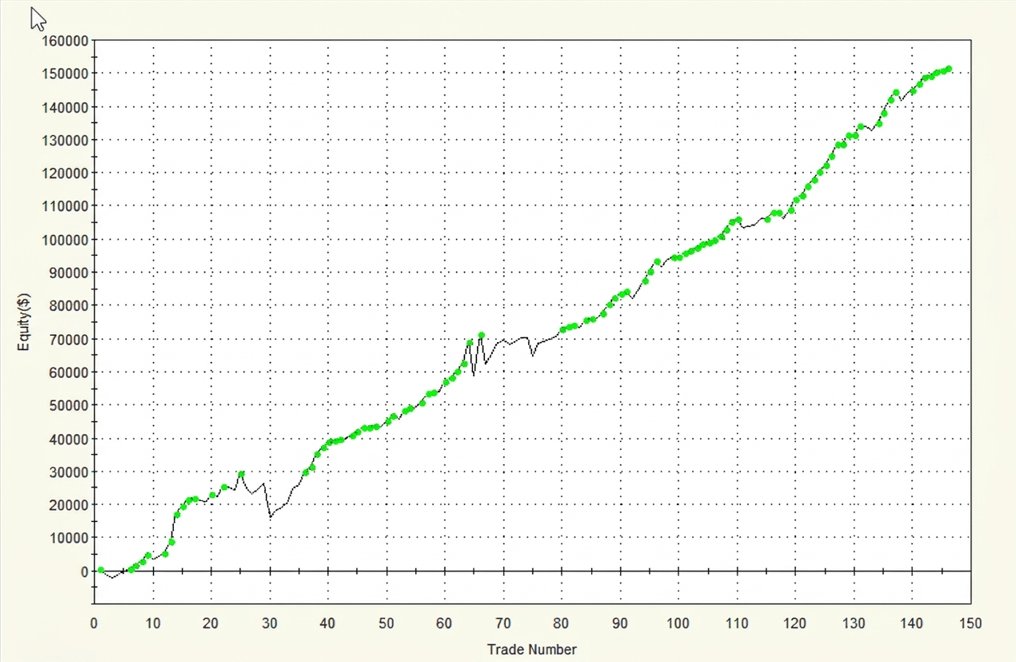
The equity curve of the long and short strategy looks like the image shown below.
Can the strategy be improved or made different? If you have any suggestions, please comment 👇
#TradingStrategies
My long mean reversion model (all rules shared) is making a new out-of-sample high.
+35% CAGR with a -10.6% drawdown over the period shown. And average capital use of only 15%.
This is a typical long mean reversion system trading Nasdaq 100 stocks. The same approach also works well on the S&P 500 universe.
Model results for the period shown:
• IBKR fees included
• CAGR: +35%
• Drawdown: -10.6%
• Sharpe ratio: 1.79
• Average capital use: 15%
That last number can create a temptation: make the system trade more.
Loosen the entries. Accept weaker setups. Keep more capital busy.
But every additional trade needs to earn its place. Increasing capital use only helps if those extra trades have an edge worth taking.
I prefer to let the model wait for its setups and combine it with other strategies, such as rotational momentum.
I share 100% of the rules, a detailed breakdown, and a free backtester so you can test variations yourself.
Claude CodeやCodexにデザイン性の高いWebサイトを一発で作らせたいときは、指示文の最後に以下を付けるとよい
「クオリティ基準としては awwwardsやwebby awards、FWAで賞を穫れるくらいのクオリティを目指して、セルフチェックでそのクオリティ基準になるまで自分でクオリティアップを繰り返して」
THE TURN OF THE MONTH TRADING STRATEGY (ULTIMO EFFECT) 📅
The turn-of-the-month strategy has performed well across many markets and frequently outperformed buy and hold despite its low market exposure.
We go long at the close on the fifth-last trading day of the month and exit after seven days, at the close of the third trading day of the following month.
The Trading Rules:
- Enter at the close on the fifth-last trading day of the month.
- Exit at the close on the third trading day of the new month.
The turn-of-the-month strategy has worked well for the S&P 500 since at least 1960. The equity curve is shown below.
Can the strategy be improved or modified? If you have any suggestions, please comment 👇
#tradingstrategies
CCI TRADING STRATEGY | 81% WIN RATE | 33 YEAR BACKTEST 📉
The Commodity Channel Index, better known as CCI, can be a useful trading indicator.
In this post, we explain how CCI works, build a simple trading strategy, and backtest it on the S&P 500 ETF SPY.
Does it work? In this historical test, CCI performed surprisingly well.
We backtested the strategy on SPY using daily data from February 1993 to September 2026.
The strategy is based on a simple mean reversion idea. When SPY becomes unusually weak compared with its recent price movement, we buy and wait for CCI to recover.
The trading rules are:
• Buy SPY at the close when CCI with a 17-day lookback falls below -180.
• Sell SPY at the close when CCI rises above -75.
The strategy is long only and holds one position at a time.
The backtest produced:
• 150 completed trades
• 80.7% winning trades
• Profit factor of 3.34
• Average gain of 1.04% per trade
• Maximum compounded trade-equity drawdown of approximately 13.2%
We also tested nearby CCI lookback periods to see whether the result depended entirely on one specific setting.
CCI(16) produced a profit factor of 2.99.
CCI(17) produced a profit factor of 3.34.
CCI(18) produced a profit factor of 2.61.
All three settings remained profitable. This is encouraging because the strategy did not immediately collapse when we changed the lookback by one day.
We also replaced the CCI exit with a simple five-day holding period. That version produced a profit factor of 2.28.
Finally, we divided the backtest into three market periods. The strategy remained profitable in all three.
The strongest period was 2016 to 2026, but we should not assume that this unusually strong performance will continue.
The high win rate is attractive, but it is not the only reason this strategy is interesting. Nearby settings worked, an alternative exit remained profitable, and the pattern appeared during different market periods.
The test includes 150 trades, excludes costs, and assumes closing-price execution. Intratrade drawdowns may have been larger, and although we manage risk through smaller positions rather than stop losses, live results may differ.
This is a historical tendency, not a forecast.
Can this CCI strategy be improved or modified? If you have any ideas, let us know in the comments 👇
#TradingStrategies
Opening Range Breakout Strategy (ORB) for Day Trading (5-Minute Backtest and System Analysis)
Unfortunately, opening range breakout trading strategies don’t work very well anymore. In this article, we do some backtests on trading the opening range breakouts on the S&P 500.
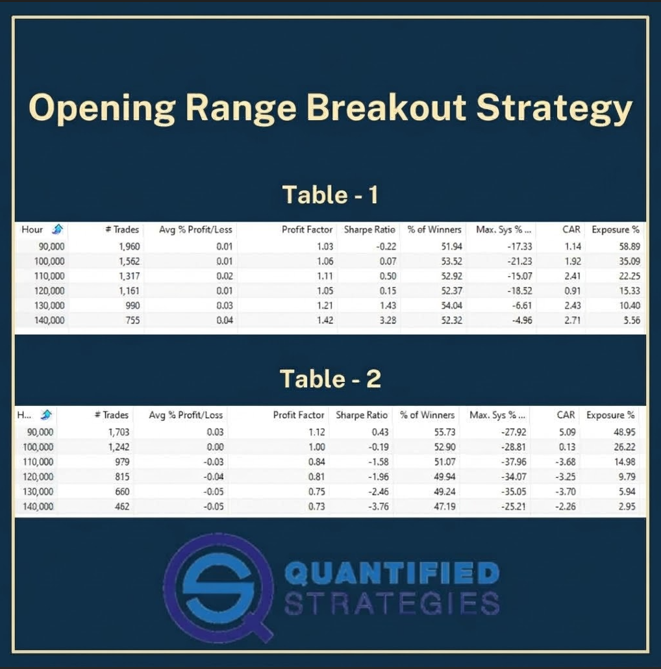
We buy when the price breaks above the highest price (Shown the image below table 1) within time interval x and we sell at the close of the day (1500 local time)
The table can be understood like this:
- Column one shows the time of day (this is Chicago time – not NY time). 90 000 equals 09.00 and 120 000 is 12.00.
- Row one contains the result when the S&P 500 breaks above the highest price from 0830 to 0900. It can enter at any time after 0900 until close at 1500.
- Row two contains the result when the S&P 500 breaks above the highest price from 0830 to 1000. It can enter at any time after 1000 until close at 1500.
- and so on…
As you can see the average gain per trade is minuscule: the best is 0.04% per trade, something that will certainly not make you famous or rich. Also worth noting is the relatively low success rate (win rate).
Let’s flip the strategy and buy when the price breaks below the lowest price (Shown the image below table 2) within time interval x (and sell at close).
Again, we sell at the close. But the result is even worse than buying a breakout to the upside.
Can the strategy be improved or made different? If you have any suggestions, please comment 👇
#tradingstrategies
CMO TRADING STRATEGY – 77% WIN RATE
(Backtest, Indicator, Rules and Settings):
The Chande Momentum Oscillator, or CMO, is a useful indicator that measures market momentum.
How do you trade with a CMO strategy?
We find the indicator useful for identifying short-term pullbacks in stock indices.
CMO moves between -100 and +100. It compares recent gains with recent losses. A low reading means selling pressure has been unusually strong.
We backtest the following CMO trading strategy on SPY:
• At today’s close, calculate the 11-day CMO.
• If CMO is below -45 and there is no open position, buy SPY at the next session’s open.
Sell SPY at the next session’s open when today’s close is above yesterday’s high.
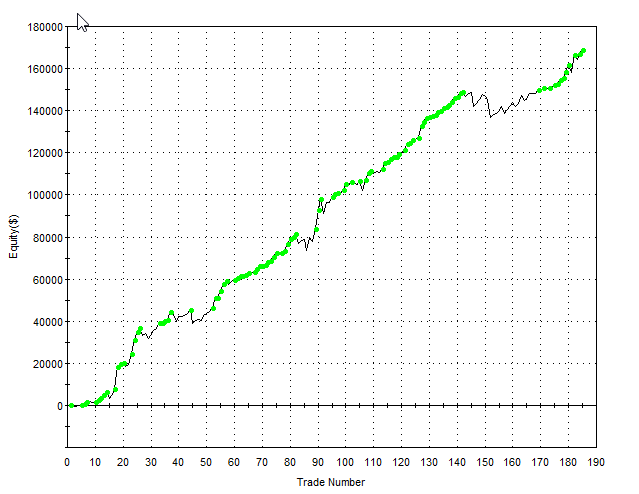
This is all there is to it. On SPY, the strategy generated 189 trades, a 76.7% win rate, and a profit factor of 2.87.
The equity curve below shows how the strategy performed from 1993 until today.
#TradingStrategy
Bollinger Band Squeeze Strategy Explained – Backtest And Performance:
The Bollinger Band Squeeze strategy is about going in the same direction as the breakout after a period of low volatility. The assumption is that the breakout sets the tone of the action over the following days (or weeks – depending on the time frame).
We use the following rules to make a strategy:
* We use weekly bars (it seems to work better than daily)
* We use 10-week data
* We create a volatility band (10 weeks) that is the difference between the upper and lower Bollinger Bands
* We create a 10-bar RSI value for the volatility bands
The buy and sell signals read like this:
* The RSI of the volatility bands must be lower than 45
* The close (of the asset) must set a new 5-day high
* We sell after 20 weeks
Below is shown the performance on Pepsi (PEP).
Can the strategy be improved or made different? If you have any suggestions, please comment 👇
In the latest episode of The End Game, @profplum99 — Founder of Tier1 Alpha Asset Management, the first “passive-aware” asset manager — breaks down how mechanical passive flows fundamentally drive modern markets.
This core principle aligns perfectly with our recent research piece on the topic. While Mike explains the structural mechanics shaping today’s markets and how “passive” flows leave footprints on prices, our article provides a concrete, actionable trading application of this idea.
I strongly suggest listening to this episode first and then reading our research piece on how to exploit these flows.
🎧 Podcast: https://t.co/jCropgE8WR
📖 Our Research: https://t.co/kPBcuMIWdE
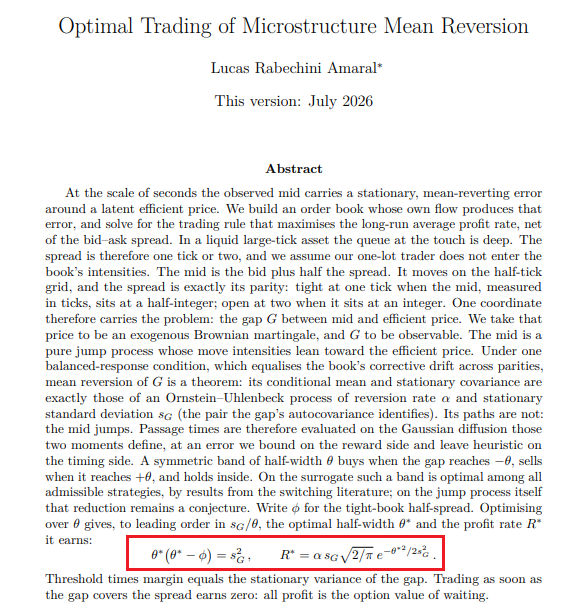
Wall Street's most valuable equation in microstructure trading:
θ*(θ* − ϕ) = s²G
The entire edge comes from the option value of patience.
Bookmark this (26 page pdf):
Can Investors Profit From Rebalancing Flows?
The idea that meaningful amounts of capital are continuously moving in and out of asset classes due to technical rules has long attracted academic attention.
Today, drawing on the valuable work of Harvey, Mazzoleni, and Melone in their 2025 paper, The Unintended Consequences of Rebalancing, we present a trading strategy built around their findings.
Our empirical results are strong: between November 2002 and August 2026, the strategy delivered a 7.3% CAGR with a Sharpe ratio of 1.05 (net of costs), while maintaining an average gross exposure of just 26.8%.
If you want to explore how predictable institutional flows can be turned into systematic trading signals, this piece is for you.
More details in the first comment below.👇