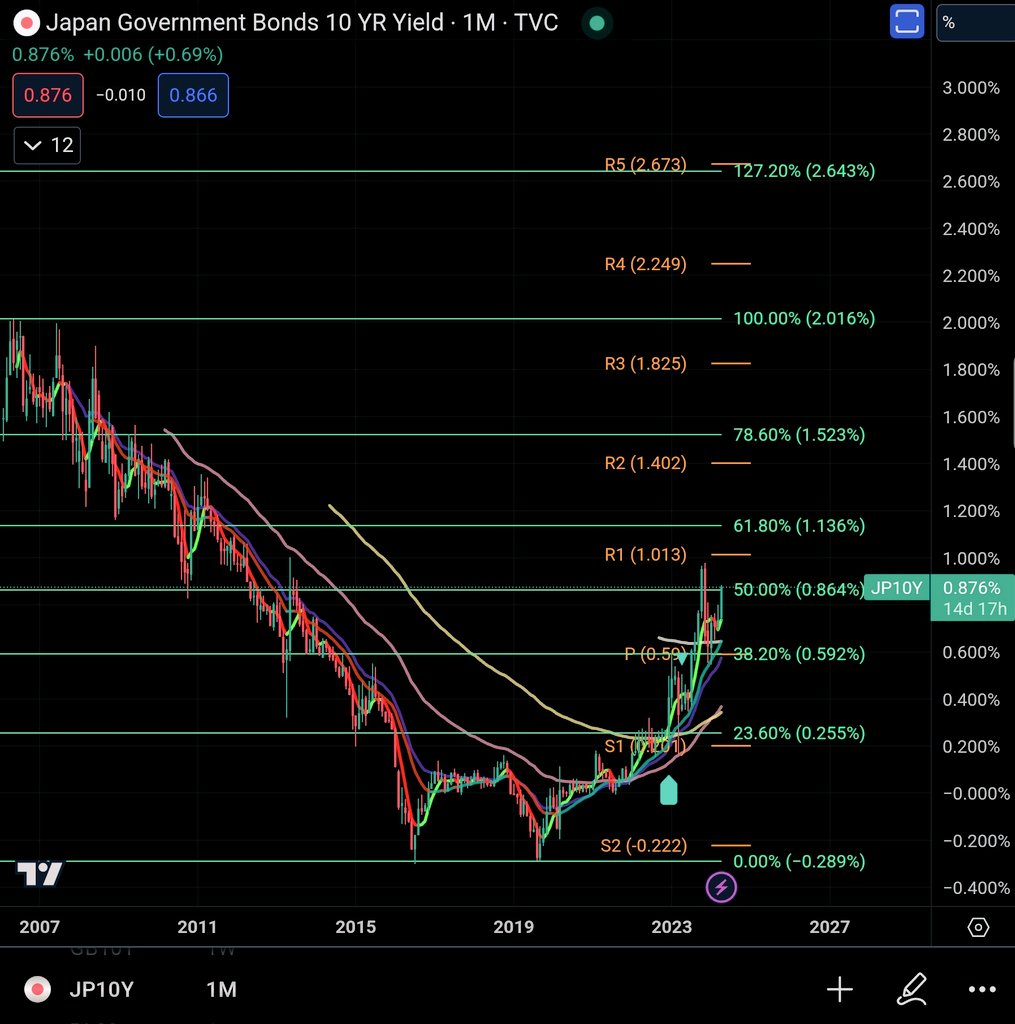
@Barchart Well you might ask where this go look at 10yr JGB... for now another 80 bp from there , look back at history on Australian rate when the peg break...
One might ask how far was this event from bottom of 08 crash
Very early — roughly 19–20 months before the equity-market bottom, with most of the decline still ahead.
The Citadel/Sowood event occurred over the weekend of 28–29 July 2007 (announced 30 July woooow such a coincidence ). The S&P 500 closed at approximately 1,474 that day.
The official S&P 500 peak of the cycle came later, on 9 October 2007 at 1,565.15 (still ~6% higher).
The closing bottom of the Global Financial Crisis was on 9 March 2009 at 676.53.
From the late-July 2007 level, the index ultimately fell another ~54%. The full peak-to-trough decline was about 56–57%. Stocks first recovered to new highs in the intervening months before the major sell-off accelerated in 2008.
In short, the Sowood liquidation was an early credit-market warning shot during the emerging subprime/liquidity stresses of summer 2007. Equity prices were still near cycle highs, and the deep phase of the crash (and the ultimate bottom) lay well ahead.
The arrow marks the zone where the Anthropic Fable 5 news hit the tape. The timing is striking: right after that headline, the candles flipped green and the market caught a bid.
I am not saying this was the only driver, but the chart makes it look like the Al narrative was strong enough to compete with the Trump/ Įran/Hormuz escalation headlines.
Interesting tape. Worth watching whether this was just a squeeze or the beginning of another Al-led risk-on leg.
Saturday May 9, 2026: Cpycat had its first real paying customer go end-to-end (waitlist → payment → clone creation → chat → voice → video). Started May 25 March. Six weeks of bugs, regressions, and learning. Today: clean production, professional workflow, working email pipeline, two PRs shipped via the proper GitHub flow. First customer is my wife. Onward.
@Barchart Well you might ask where this go look at 10yr JGB... for now another 80 bp from there , look back at history on Australian rate when the peg break...
@Barchart Well you might ask where this go look at 10yr JGB... for now another 80 bp from there , look back at history on Australian rate when the peg break...
@Barchart Well you might ask where this go look at 10yr JGB... for now another 80 bp from there , look back at history on Australian rate when the peg break...
@Barchart Well you might ask where this go look at 10yr JGB... for now another 80 bp from there , look back at history on Australian rate when the peg break...
@Barchart Well you might ask where this go look at 10yr JGB... for now another 80 bp from there , look back at history on Australian rate when the peg break...
@Barchart Well you might ask where this go look at 10yr JGB... for now another 80 bp from there , look back at history on Australian rate when the peg break...
@Barchart Well you might ask where this go look at 10yr JGB... for now another 80 bp from there , look back at history on Australian rate when the peg break...
@Barchart Well you might ask where this go look at 10yr JGB... for now another 80 bp from there , look back at history on Australian rate when the peg break...
@Barchart Well you might ask where this go look at 10yr JGB... for now another 80 bp from there , look back at history on Australian rate when the peg break...
@Barchart Well you might ask where this go look at 10yr JGB... for now another 80 bp from there , look back at history on Australian rate when the peg break...
@Barchart Well you might ask where this go look at 10yr JGB... for now another 80 bp from there , look back at history on Australian rate when the peg break...