Low-carbon electricity sources grew faster than demand in 2025, pushing fossil fuels into decline—
Solar and wind energy have grown quickly in recent years, but global electricity demand has grown faster. So while their share of electricity generation kept rising, it wasn't enough to push fossil fuels into absolute decline.
But in 2025, that changed. According to Ember's Global Electricity Review, low-carbon electricity sources grew faster than demand, pushing some fossil fuels out of the mix.
Global electricity generation increased by around 850 terawatt-hours (TWh) from 2024 to 2025.
As you can see in the chart, solar and wind accounted for nearly all of this growth. While the world still burned slightly more gas, this was more than offset by a decline in coal and oil.
To reduce carbon emissions, fossil fuel use needs to keep falling in absolute terms — not just in the power sector but also in other energy and industrial sectors.
(This Data Insight was written by @_HannahRitchie and Pablo Rosado.)
📊 Explore updated data on self-reported life satisfaction around the world from the 2026 World Happiness Report (@HappinessRpt)—
How satisfied are people with their lives? Are they getting more satisfied over time, or less? How does this vary across cultures and life circumstances?
The World Happiness Report (WHR) is one of the key sources we have for answering these questions. Based on the Gallup World Poll, the WHR has published data on life satisfaction since 2012 and covers more than 140 countries worldwide.
Our colleague Tuna Acisu just updated our charts with the latest data (through 2025) from the 2026 edition of the report, released today.
The WHR is a partnership of Gallup, the Oxford Wellbeing Research Centre, the UN Sustainable Development Solutions Network, and the WHR’s Editorial Board.
A diverse range of mammals once roamed the planet. This changed dramatically with the arrival of humans, who have become the dominant species through our own population, as well as the animals we breed and raise for food.
What is the distribution of the global mammal kingdom today?
The chart shows a breakdown of land and marine mammals in terms of biomass — the total weight of all animals of a given species. Each square represents one percent of the world’s mammal biomass.
The dominance of humans is clear. We account for more than one-third of mammal biomass. Our biomass is more than seven times greater than all wild mammals combined.
Our livestock and pets, which are primarily cattle, account for 59%.
That leaves just 5% as wild mammals, which includes thousands of different species, from elephants and deer to lions and whales.
Beyond the totals for humans, livestock, and wild animals, there are a few striking comparisons that we found surprising. Farmed pigs weigh as much as all of the world’s whales, orcas, sea otters, seals, and dolphins combined. All the dogs in the world, including pets and feral dogs, weigh as much as all wild mammals on land.
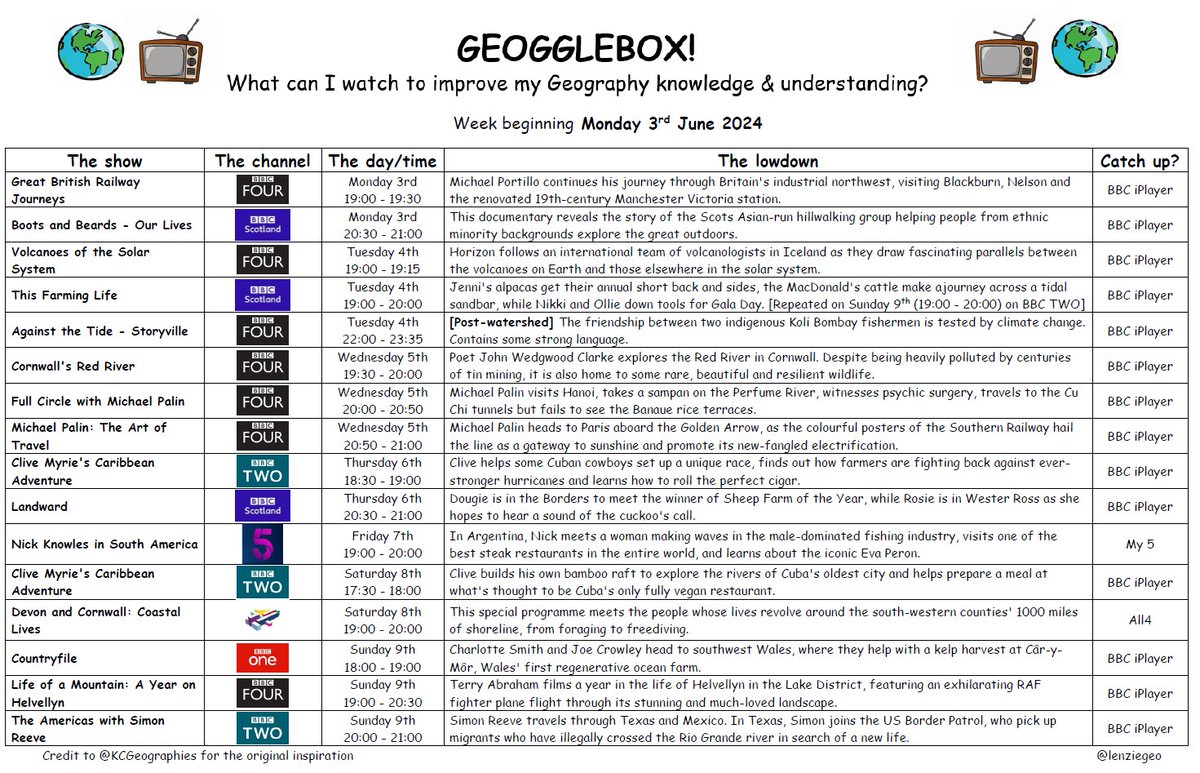
Illness and technical difficulties have curtailed #geogglebox for the last couple of weeks. But it's back with a nice little sprinkling Christmassy geography to watch this week. JC
Sure, you might know the world's largest hydroelectric dam (Three Gorges Dam in China) but do you know the other four in the top 5 ranking? Source: https://t.co/SwuC1rJg9h
Just Wow - the rainfall totals for Sunday and Monday were biblical - over 2 month's worth of rain in parts of the S Midlands, smashing records that have stood since the 19th century at some stations.
#geographyteachers this graphic illustrates China’s widening sphere of influence in the world through the diversification of its exports - good for #globalsystems & changing patterns of globalisation