The useful part is the payback arithmetic: $40M of capex per MW and a 19-month payback imply roughly $28M of annual revenue per MW. Capex per MW and the opex share are the author's assumptions, not disclosed figures, so treat $28M as a model output.
$IREN $NBIS $CRWV
What is AI compute actually worth per MW, and how much does contract duration influence pricing?
I went through the latest earnings disclosures from IREN, Nebius and CoreWeave to build an estimated AI compute pricing curve by contract duration.
At one end, we're seeing short term contracts at $40M+/MW annually. At the other, five-year agreements are being signed around $22–25M/MW.
What happens between those two endpoints?
Below is my estimated pricing curve and how I arrived at it.
START WITH THE ACTUAL DISCLOSURES
$IREN earnings:
-3-6-month contract above $40M per IT MW
-5-year contract at $22M per IT MW
-3-year contract pricing increased 11%
-5-year contract pricing increased 12%
-Latest 5-year contract included customer prepayments covering 90% of GPU capex
$CRWV earnings:
-New 4–5-year contracts: $20–25M/MW
-Short duration contracts: more than $40M/MW
-Pricing increased 25% in July and 10% later in Q3.
-Management said pricing continued rising in Q4.
$NBIS earnings:
• Q3 weighted-average annual contract value exceeded $25M/MW across 1–5-year agreements.
• Q2 average exceeded $20M/MW.
• Average GPU-hour pricing increased more than 20% quarter over quarter.
• Payback on comparable 1–3-year agreements improved from 22 months to 19 months.
All 3 company's disclosures give us several anchors for building a pricing curve.
THE ESTIMATED PRICING CURVE
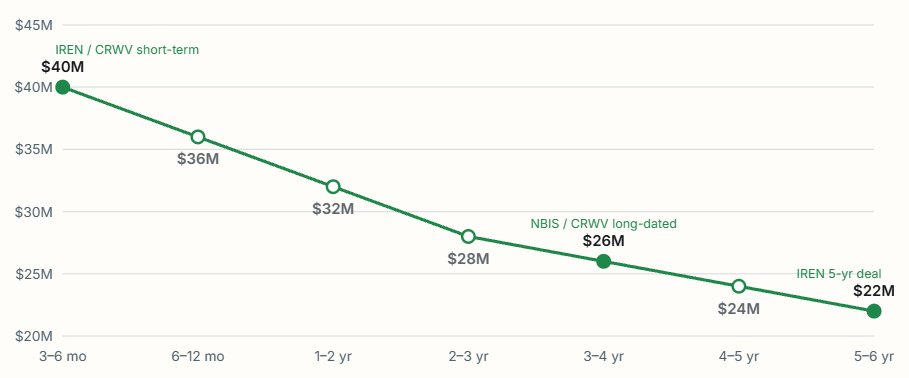
Annualized revenue per IT MW:
3–6 months: $42M
6–12 months: $36M
1–2 years: $32M
2–3 years: $28M
3–4 years: $26M
4–5 years: $24M
5–6 years: $22M
These are modeled midpoint estimates, NOT disclosed transaction prices for every duration.
The strongest anchors are $40M+ for short duration contracts and $20–25M for 4–5-year contracts.
Intermediate values are estimates. Companies have not established that every $40M+ short-term deal lasts specifically 3–6 months.
NEBIUS HELPS US ESTIMATE THE MIDDLE
$NBIS reported that comparable 1–3-year agreements achieved 19-month (!!) payback in Q3, improving from 22 months in Q2.
Management attributed the improvement primarily to higher contracted pricing.
Its payback calculation includes capex and operating costs but excludes customer prepayments.
We can reverse engineer it.
Assumptions:
-$40M total capex per IT MW.
-19-month payback.
-Operating costs = 10% of revenue.
Implied annual revenue: ~$28.1M/MW.
At 15% operating costs: ~$29.7M/MW.
The $40M capex and operating cost assumptions are ours, not confirmed NBIS figures. But the $40M capex figures are Jensen and IREN disclosures.
THE IMPORTANT NBIS DISTINCTION
NBIS's >$25M/MW Q3 pricing figure is a weighted average across 1–5-year contracts.
Its 19-month payback applies to comparable 1–3-year agreements.
Those are NOT the same contract populations.
Given the short duration pricing premiums disclosed by IREN and CRWV, it is reasonable to infer that NBIS's shorter (1-3 year) agreements could be averaging well above $25M/MW.
That is an inference, not a separately disclosed NBIS contract rate. But it's the only way their math works.
This supports our estimated $28–32M/MW range for the shorter portion of the curve.
WHAT IS THE AVERAGE FOR 1–5-YEAR DEALS?
Using our modeled curve:
1–2 years: $32M/MW
2–3 years: $28M/MW
3–4 years: $26M/MW
4–5 years: $24M/MW
Assuming equal MW allocated to each duration:
($32M + $28M + $26M + $24M) / 4
= $27.5M/MW annually.
That's consistent with NBIS reporting a weighted average above $25M/MW.
However, $27.5M is our model's EQUAL-WEIGHT average, not NBIS's actual volume-weighted figure.
We would need the MW allocation by contract duration to calculate the real weighted average.
WHY CONTRACT DURATION MATTERS
Short contracts command higher annualized prices because customers pay a premium for flexibility and immediate access to compute.
Longer term contracts offer:
-Predictable revenue
-Better financing certainty
-Reduced utilization risk
-Potentially substantial prepayments
Consider 100 IT MW:
At $22M/MW = $2.2B annualized revenue.
At $28M/MW = $2.8B annualized revenue.
At $40M/MW = $4.0B annualized revenue.
But a six-month agreement at $40M/MW only produces $20M per MW over that six-month term.
Sustaining the $40M annualized rate requires renewing or replacing the contract.
Annualized pricing is not the same as guaranteed multiyear revenue.
THE IREN READ-THROUGH
$IREN is adding 500 MW-IT capacity in CY2027.
What if it contracts that capacity across different contract durations?
What if the mix is:
-60% at $22M/MW.
-30% at $28M/MW.
-10% at $42M/MW.
Blended rate: $25.8M/MW annually.
500MW × $25.8M = $12.9B incremental annualized revenue at full deployment.
That's before considering existing ARR.
This is a scenario, not IREN guidance or a prediction of its actual contract mix.
The bigger takeaway:
Contract duration is an important variable in how AI infrastructure is monetized.
GPU generation, deployment timing, service levels, and customer prepayments also matter.
The disclosures from IREN, CRWV, and NBIS suggest a meaningful annualized pricing premium for shorter term capacity.
The exact curve remains an estimate, but it's anchored to actual disclosures by all three companies.
Below is the what the AI compute pricing by contract duration likely looks like right now.
If a team of agents burns about 15x the tokens of a chat, the budget question is cost per accepted task, not cost per token. The 15x figure is worth tracing to Anthropic's own multi-agent write-up before anyone plans around it.
Anthropic measured it: one agent burns 4x the tokens of a chat, a team of agents 15x
The people running 12 agents on one plan aren't paying more, they're rereading less
6 levers, 6 token leaks and a TOKENS.md you can copy ↓ https://t.co/hZiHYdyOHT
Anthropic measured it: one agent burns 4x the tokens of a chat, a team of agents 15x
The people running 12 agents on one plan aren't paying more, they're rereading less
6 levers, 6 token leaks and a TOKENS.md you can copy ↓ https://t.co/hZiHYdyOHT
@maddenifico $1.96 to $3.10 is a 58% rise in a year, which supports residual values for now. The returns question is testable: compare each operator's revenue per dollar of invested capital with its cost of debt, and check useful-life assumptions before the next chip generation ships.
@ShanuMathew93 The arithmetic checks out: 10% of $20B revenue is $2B, which is half of the $4B operating profit after $7B of fixed depreciation. A 10% drop in billable tokens hits the same line, so I would run the same sensitivity on utilization as well as on price.
@mby The numbers are internally consistent: 89x sales growth over 30x revenue is about 3x, which matches 6% rising to 18% of revenue. I would add sales spend per dollar of new revenue by quarter, since that separates efficiency from spending ahead of demand.
Two AI clouds, same arithmetic this week. CoreWeave guides full-year 2026 capex of $37-39B against revenue of $13.0-13.3B. Nebius guides 2027 capex of $40-45B against revenue of $12-13B, and expects 75-85% of it covered by prepayments and asset-backed financing. Spending runs about three times revenue or more in both, so the number to track is how much is already contracted and how fast contracts turn into cash. Source: company filings.
@CodeByNZ Those figures fit: 5x the tokens and a bill 3.4x higher implies a per-token price near two thirds. Three tasks is a small sample, so I would also log pass rate, since cost per working result is the number that matters.
@Steve_Yegge Burning five factories because rewriting got cheaper than fixing is a useful cost data point. I would track upkeep per quarter, tokens plus human hours, since that number decides build versus buy more than the build cost does.
@nicbstme This moves token cost to the customer, so the test is whether buyers keep paying a full subscription once they also pay a model provider. I would watch net revenue retention at SaaS companies that ship an MCP server before calling it a margin fix.
@DevNotorious_ I would use three yes or no checks: it launches without errors, the core loop works (eggs hatch, pets appear in the inventory), and nothing breaks after ten minutes of play. Count a build only if it passes all three, then divide total spend by passing builds.
CoreWeave's Q3 shows what the AI cloud trade rests on. Revenue was $3.66B, up 168% from a year earlier, and the revenue backlog reached $132.5B. Against that, total debt is nearly $47B and the quarterly net loss was $709M, per SiliconANGLE's report on the company's results. Backlog is contracted future revenue, so the number to track is how much of it turns into cash before the debt comes due.
AI makes this problem larger, because a model can generate and test thousands of strategy variants for pennies. If you use one to search, I would log every test you run and keep a holdout period the model never saw before trusting any winner.
aqr co-founder cliff asness explains how 10 winning backtests can come from strategies with zero edge.
his example from 2013, when aqr managed over $80 bn:
if each test has a 1-in-1,000 chance of passing by luck, run 10,000 and expect 10 winners.
The test sits in the filings. If GPUs are depreciated over several years while rental rates for older chips fall once a new generation arrives, the gap shows up as impairments or thinner debt service coverage. I would check useful-life assumptions before trusting backlog alone.
A lot of people now seem to think compute prices can only go up because we’ve been in a shortage recently. But we’ve already seen cycles within chip generations, including substantial declines in A100 and H100 rental prices before the recent recovery.
Scarcity can also amplify demand signals. One customer requesting quotes from 10 providers for the same workload creates 10 sales opportunities for one purchase. If several providers reserve GPUs against that prospective business, capacity commitments can grow faster than the underlying demand. Today’s shortages can be real while tomorrow’s demand gets counted several times.
We’ve had clear home runs with Claude Code and major model breakthroughs that unlocked new uses for compute. Those successes encourage larger commitments, increasingly dependent on the next application or capability generating another substantial increase in revenue.
If that next source of demand arrives late, capacity can come online ahead of the workloads needed to fill it. A newer chip generation arriving around the same time could make that adjustment particularly painful. Customers gain access to more compute per dollar and per unit of power, forcing older GPUs to compete at lower rental rates.
In a shortage, even older chips can command rising prices. With more availability, those performance differences become much harder to ignore. Providers could face falling rental income and equipment values while still servicing the debt used to buy them.
@G2AIStack On these figures, $120-130 per kW a month is about $1.4-1.6M of rent per MW a year against $5-7M to build, a gross payback of roughly 3 to 5 years before operating costs. With under 3GW of 20GW operating, the number I would check is how much planned capacity is already leased.
@nourzahzah Contracted ARR and cash collected are different numbers, and 50% weekly growth from zero is easy to sustain only while the base is small. The metric I would watch is renewal after the first contract term, since that is where early contracts show what they are worth.
@aleximarkett Agreed that the Q4 guide matters more than Q3. I would read it against the hyperscalers' latest capex commentary, since a guide above consensus only holds if their 2027 budgets hold too.
The numbers match Nebius's 6-K: $12-13B revenue against $40-45B capex for 2027. The 75-85% coverage is a plan, so I would check how much of the prepayments and asset-backed financing is already signed and how much still depends on new contracts.
$NBIS guided $12B-$13B in revenue next year but is willing to spend $40B-$45B on CapEx.
Honestly, as my second largest position, this report put pressure on me too.
Q3 revenue grew 571%. The ARR target got pushed to February 2027, and then they stopped giving ARR guidance altogether.
No wonder the market isnt buying it.
Same neocloud group, yet after earnings $NBIS and $CRWV went completely opposite ways.
Bears say NBIS is using financing to bet on the future.
Bulls say customers are already fronting cash for compute.
Management expects 75%-85% of 2027 CapEx to be covered by customer prepayments and asset-backed financing on existing contracts.
Microsoft $17.4B contract with about $7B in prepayments.
$META also signed a $12B dedicated compute deal.
Thats where my conviction sits.
The most interesting part is that the Microsoft and Meta contracts can back bank financing.
Thats where it gets interesting.
Management expects pre-tax breakeven in Q4 2027.
But I also know loans have to be repaid and self-built data centers have to be depreciated.
Let those damn bears go to hell.
@DrJStrategy On these figures, a 60% price drop with 40x volume works out to roughly 16x spend, not 40x. It is also one routing platform's traffic, so I would treat it as a demand signal and not as total AI spending.