On probability: in weather forecasting, a rain probability of 50% does not indicate that it's a coin flip whether it rains or now. It is interpreted as a 100% chance of rain, but only 50% of a specific area gets it. The same logic should be applied to stock seasonality analysis
If the current cyclical bull market ends up “blowing off” with an AI-driven melt-up, then it’s worth pondering what this would mean for the secular bull market. By my count (with which most technicians disagree), the current secular regime began in 2009 and is now 16 years old. That’s pretty close to the past two secular bull markets (1982-2000 and 1949-1968), with the caveat that this is hardly an exact science with a tiny sample size.
The chart below shows the secular waves and market cycles expressed as sine curves. We can see that we are in the 5th cyclical bull market within this secular wave. That’s exactly the pattern for the 1982-2000 wave and pretty close to the 1949-1968 wave. It’s something to keep in mind as we enter year 4 of this 5th market cycle since 2009.
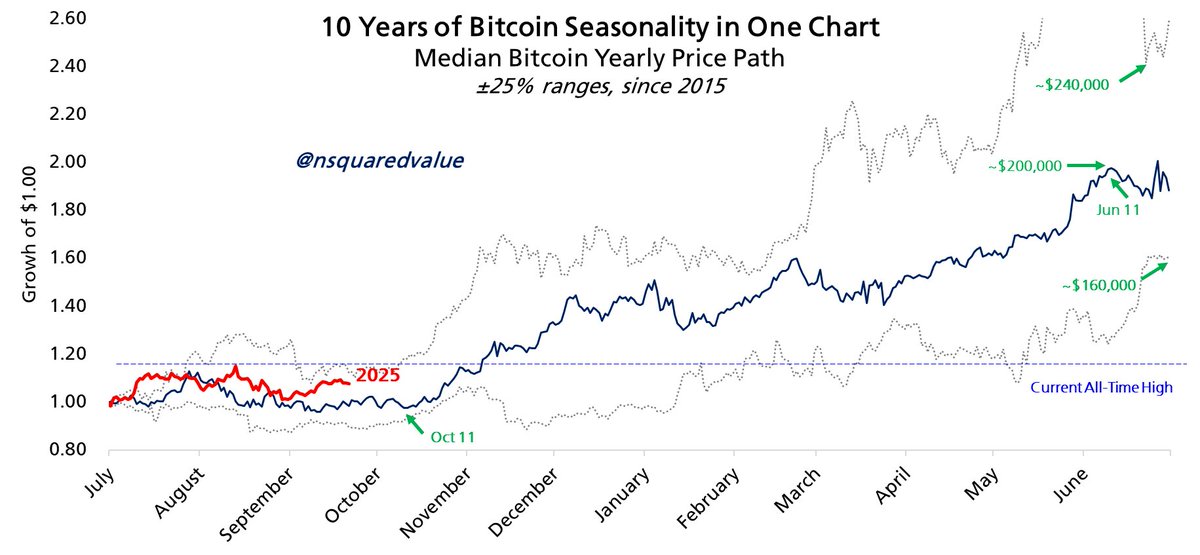
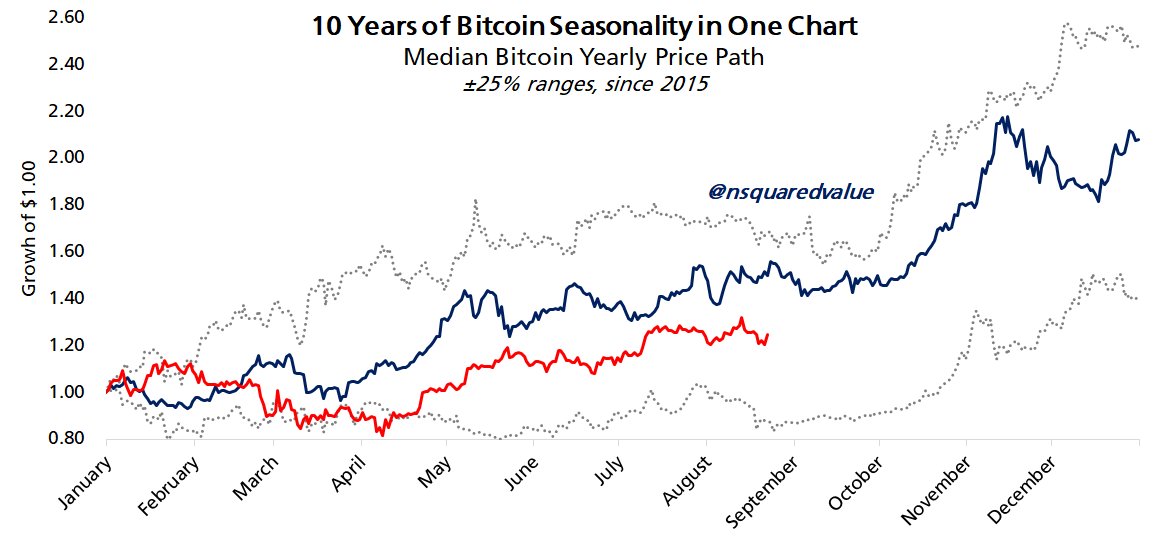
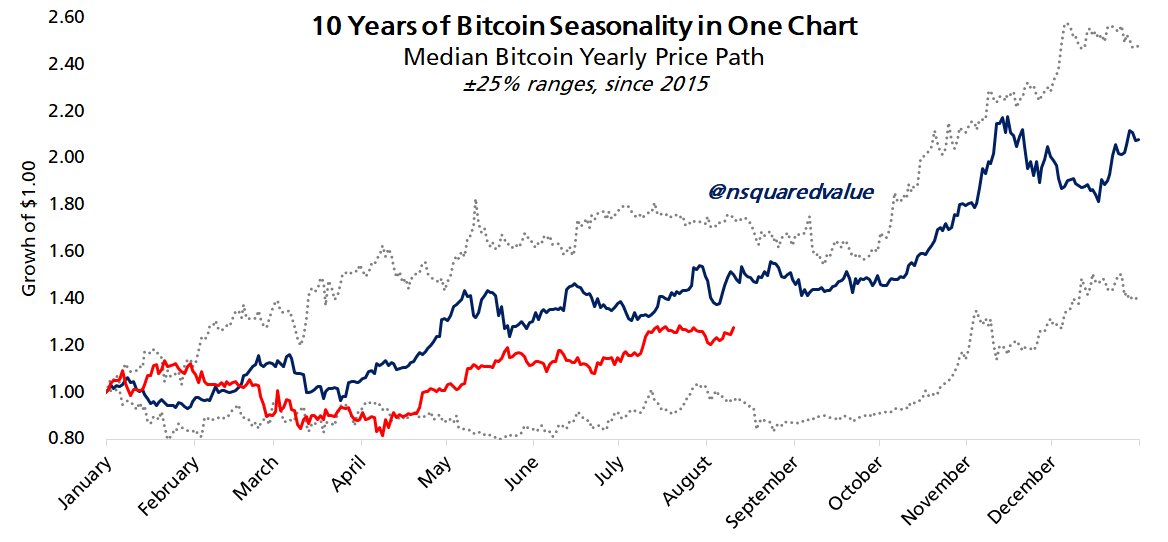
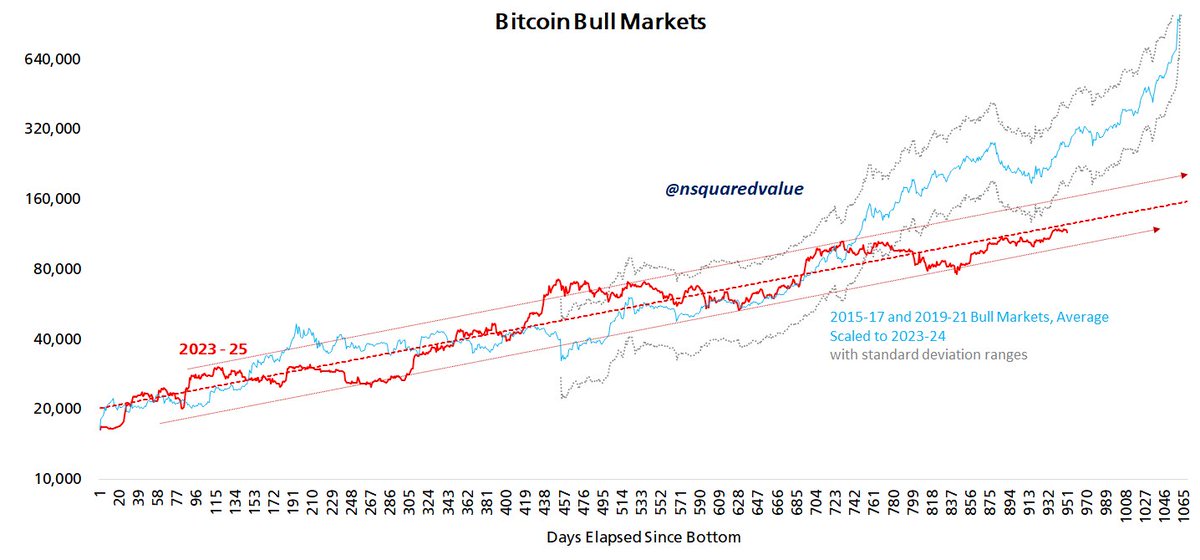
There is a 50% (or better) chance that Bitcoin will be $200,000 by June.
This chart takes the annual seasonal pattern and shifts it 6 months to better illustrate the bull market periods.
Bitcoin's bull market runs from Oct 11 to Jun 11.
$200k by June is an average monthly return of about 7%, about 120% annualized.
50% or better chance of a new all-time high in early November.
α
The U.S., China, and Japan all have stock markets at record highs.
At the same time, their economies face weak growth, layoffs, property crises, and stagnant wages.
Markets are soaring while households struggle. What’s driving this split?
(a thread)
90/90 days were quite rare in '80s and '90s, but we've clearly seen more of them since the GFC.
Bottom line, the action Friday has to be filed away as another reason we are still in a major bull market. Any weakness should be fairly contained and would be an opportunity.
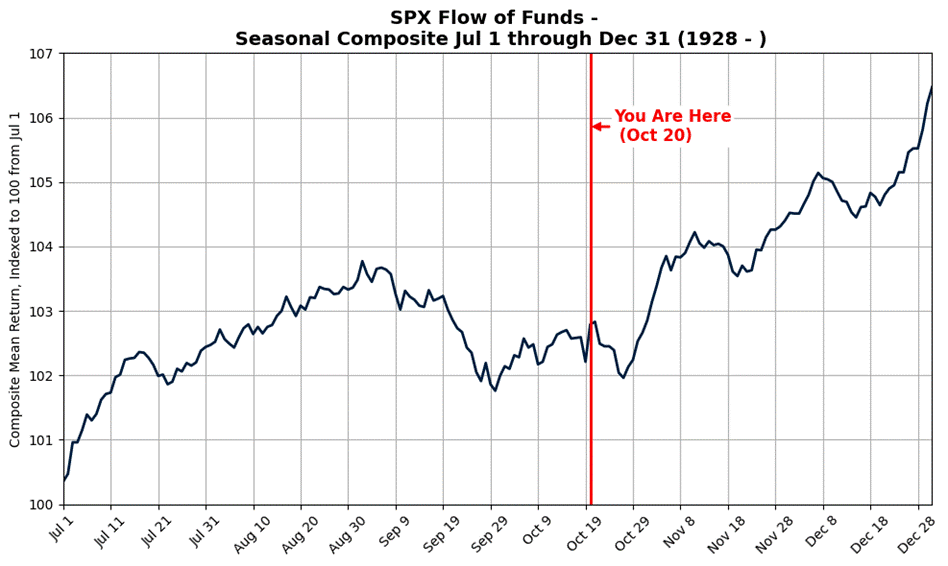
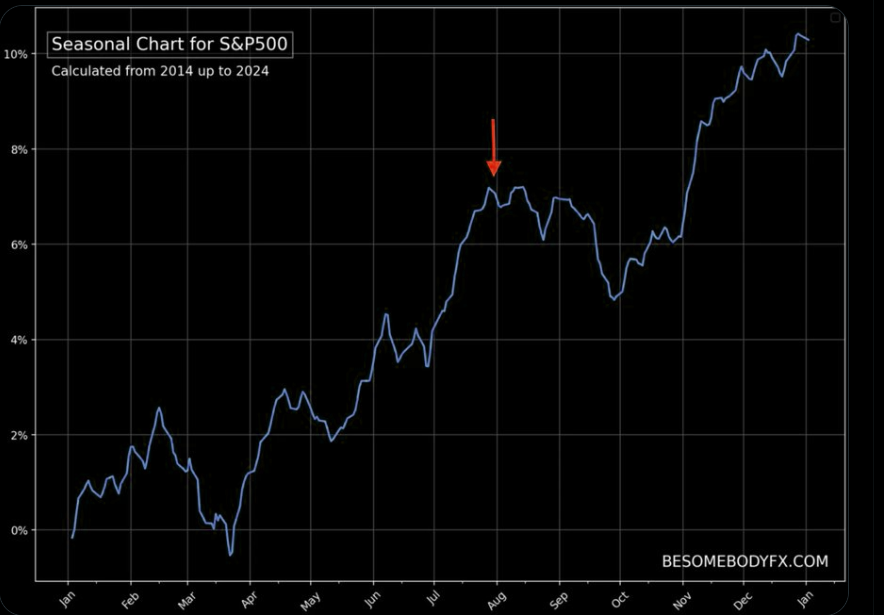
Post-election years tend to peak right about now and bottom in late October.
No, this doesn't mean it has to happen this time, but some seasonal turbulence would be perfectly normal.
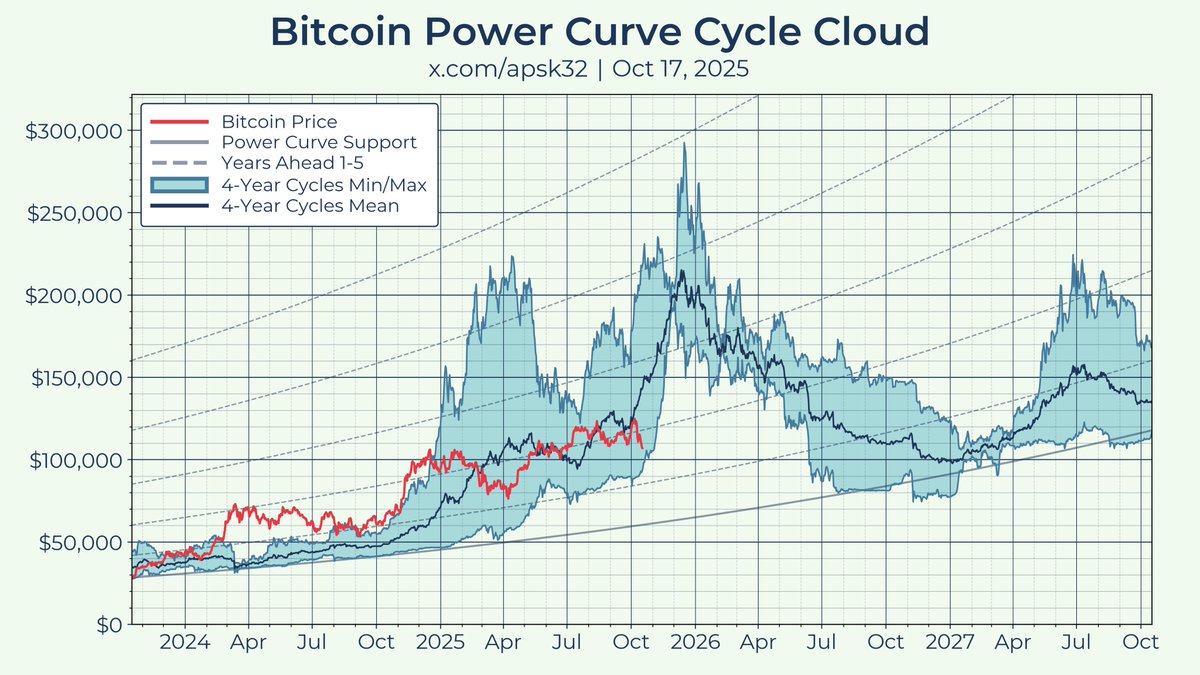
Due the Power Law Exponential Decay we can expect a top for Bitcoin arcound the 160k if this cycle stays normal.
Great tool to use as another confluence combined with the Power Law Exponential Decay Oscillator.
Once we reach 80%+ this will count as another selling signal for me