Welcome to Vachellia Equity Research.
I’m Guy. 👋 I am an applied statistician (PhD), scientific researcher, and passionate long-term investor based in South Africa.
I try to leverage my research background to bridge the gap between rigorous academic finance research and fundamental, long-term investing.
🛠️ Model Portfolios Under Construction
I am actively building quantitative screening frameworks to uncover high-quality businesses across US, international, and emerging markets.
These investment strategies are currently being developed as model portfolios, estimated to go live in late 2026:
US Only:
- 1. Dividend Champions (30-50 equities, blended high yield and dividend growth)
- 2. Dividend Growth Portfolio (30-50 equities)
- 3. High Yield Portfolio (30-50 equities, target yield ~ 3.5-4.0%)
Global (US + EMEA + Emerging Markets):
- 1. Dividend Champions (30-50 equities, blended high yield and dividend growth)
- 2. Dividend Growth Portfolio (30-50 equities)
- 3. High Yield Portfolio (30-50 equities, target yield ~ 3.5-4.0%)
Lastly, I am also putting the final touches on my actively-managed dividend fund: A fully transparent, factor-screened portfolio focused on consistent cash flows, balance sheet quality, and appropriate intrinsic valuation.
Whether you're a keen investor, dividend junkie or just love nerdy finance math, I am really glad to have you here. 🙏
S&P Global, Inc. ( $SPGI ) is another high-quality "compounder" that has fallen on hard times over the last 5 years, and is currently experiencing a 30% drawdown since its all-time high of $548 in August 2025. 📉
I passed $SPGI through my screener to see if this drawdown is worth considering further or not.
1. Balance Sheet Quality
The company has a solid balance sheet, albeit the balance sheet is significantly worse off since the IHS Markit acquisition in 2021/2022.
They hold $11.4 billion in net debt ($15.6 billion in total debt; short-term debt + long-term debt + long-term operating leases) against $6.1 billion in free cash flow to firm (FCFF). This represents a 1.9x net debt / FCFF ratio (MRQ), or 2.1x over the last 3 years, both of which are well below my threshold of 5x.
Similarly, both on an earnings (15.6x) and FCFF basis (21.4x), $SPGI has high interest coverage ratios, well above the typical 8-12x ratio typically used to determine well-covered debt servicing capacity.
All of their debt is fixed-rate, which I view positively given a possible rising rates environment in the US in the bear future.
$SPGI has 50% of their debt maturing in the next 5 years, with FY2027 notably seeing $1.2 billion (13% of total debt) and FY2029 seeing $2.7 billion (20% of total debt) mature.
The current weighted average cost of debt is approximately 2.3-2.5%, while the company is issuing 5.05% senior notes (maturing in 2029) and 5.45% senior notes (maturing in 2031).
As such, I expect interest expense to increase quite significantly over the next few years, particularly when the larger tranches of 2027 and 2029 maturities roll-over into higher interest rate debt.
The balance sheet looks well positioned to handle the likely higher cost of debt on the horizon, with a sufficient buffer to service their debt obligations, even at higher rates.
2. Return on Capital
$SPGI's mean return on invested capital (ROIC) over the last 5 years is approximately 17.2%, and only ~10% over the TTM. ROIC is significantly skewed for $SPGI post IHS-merger in 2022, with the company taking on over $30 billion in Goodwill ($3.5 billion in 2022 > $34.5 billion in 2023).
At face-value, $SPGI has not been generating returns on capital to cover their cost of capital (9.3%) since the acquisition. As above, due to the Goodwill recognition, I think it is a mistake to reject $SPGI due to what appears to be poor return on capital.
I would like to give management the benefit of the doubt here, and I would track ROIC over the next 8-12 quarters to assess whether ROIC increases over time as the integration and synergies of the acquisition take effect.
Particularly, given that since September 2023, ROIC has increased linearly quarter-over-quarter from a low of 5.3% to 10% (TTM). I expect we will see ROIC continue to climb in coming years as the businesses continues to recognise synergies from the acquisition.
The caveat being that management do need to be held accountable and judged on their acquisitions, and in my opinion, $SPGI have deployed capital relatively poorly over the last 5 years, particularly for IHS.
3. Cash Generation
Over the TTM, $SPGI generated $5.7 billion in cash from operating activities (OCF) and $5.5 billion in free cash flow, representing a -0.5% and +1.2% change year-over-year, on only only $239 million in stock-based compensation (SBC). Therefore, cash generation is not significantly hampered by SBC, and net OCF and FCF are adjusted down to $5.5 and $5.2 billion, respectively.
These cash flows were generated on an adjusted free cash flow margin of 38.5% in FY2025, which is at the top-end of their 10-yr range of 30-42%.
Cash flow margins are incredibly strong for $SPGI, and are testament to their asset-light, and highly-efficient business model.
4. Dividend Growth
They currently pay a $3.83 per share dividend, with an indicated yield of ~ 0.73%.
Over both the last 10-yr period, the dividend per share (DPS) has growth by an average of 11.2% per annum, albeit the growth rate has slowed to 7.5% over the last 5 years. Both growth rates are above my threshold of 7% per annum.
5. Dividend Safety
The dividend appears to be very safe, with a net income payout ratio of 26.2% (TTM) and an adjusted FCFF payout ratio of 19.8% (TTM). Similarly, over the past 5 years, the two payout ratios have averaged 31% and 24%, respectively. Notably, both payout ratios have remained relatively flat and consistent over the last 10 years
As such, I view the dividend as being very safe and well-covered by both earnings and FCFF, with ample room to grow the dividend at 7-10% over the next few years.
6. Earnings
$SPGI has grown diluted earnings per share (EPS) at an incredible rate of 9% and 13% over the last 5-yr and 10-yr period.
Notably, this is largely due to net income growth (16-18% CAGR per annum over the last 10 years), not due to significant reduction of their diluted share count through buybacks.
In fact, diluted shares outstanding are currently higher TTM at 299 million than 5 years ago at 242 million, due to the issuance of shares for the IHS acquisition in 2021/2022. Nevertheless, post-acquisition, $SPGI have began repurchasing shares, retiring about 7 million shares per annum in 2024 and 2025, alone.
I like to see EPS growth outpace DPS, as an indicator that the they will likely continue to grow their dividend significantly over the next few years.
7. Valuation
My base case DCF for $SPGI assumes that FCFF will grow at 9.5% per annum for the next 5 years, and grow down to a terminal growth rate of 2.5% in year 10. Weighted average cost of capital (WACC) equals 9.36% (probably a bit too conservative).
I adjust equity for:
(+) Cash and Cash-Equivalents: $4.1 billion
(+) Equity Investments: $613 million
(-) Short-Term Debt: $2.5 billion
(-) Long-Term Debt: $12.5 billion
(-) Long-Term Operating Leases: $$452 million
(-) Minority Interests: $5.1 billion
Under these assumptions, I estimate a fair value for $SPGI @ $374 per share, representing a price/fair value (P/FVE) of 1.08x. This indicates that the shares are approximately fairly valued.
Under my conservative case, I assume that FCFF will grow at 6.5% per annum for the next 5 years, in-line with recent revenue growth trends. Under these assumptions, I estimate a fair value for $SPGI @ $310 per share, representing a price/fair value (P/FVE) of 1.30x. This indicates that the shares are slightly overvalued.
On a simpler note, $SPGI trades at a 24.5x trailing earnings multiple, and 22.5x forward multiple. While both multiples are well below its historical multiple, it is by no means an absolute bargain here.
8. Summary
$SPGI passes 9/9 of the my quality screening criteria. ✅
The fundamentals of the business look strong. Not as strong as they possibly were pre-IHS acquisition, in my opinion.
However, despite the 30% drawdown the stock is currently experiencing, the valuation is not that attractive. Yes, shares are fairly valued under my base case assumptions ($374 per share P/FVE). However, under the conservative case, shares are still priced at a premium. Moreover, the current market-implied FCFF growth is about 10.5%, which indicates the market is still pricing in double-digit cash flow generation in coming years.
Personally, I would like to see shares trade around $335 per share, representing a 10% margin-of-safety on my base case valuation, before I would consider initiating a position in $SPGI for the Vachellia Equity Research Dividend Champions Fund. 👍
A very attractive entry price for me would be $300 per share, which I admit is very unlikely. This would provide a 20% margin-of-safety on my base case, and is below my conservative case fair-value estimate.
Does $SPGI look like a good investment at these levels? 🤔
Pro Medicus ( ASX: $PME ) has some of the best fundamentals in the business (albeit some significant accruals), but is currently in a 50% drawdown. 📉
Is it cheap? Even after the current drawdown, $PME still trades at 62x earnings and 86x forward earnings, according to analyst expectations.
Full quality screen and valuation coming next week. 🇦🇺
Yesterday, I put $INTU through my simple 9-metric screener and it passed with flying colors. ✅
The business fundamentals are strong: the balance sheet is sound, debt is manageable, returns on capital are suitable (and increasing) and dividend and earnings are growing healthily and well supported by a growing business.
$INTU looks like a compelling opportunity based on the financials. Today, I have been working through whether the current valuation is attractive. 👇
I built two free cash flow DCF's (FCFF-based) and two dividend discount models, both under my base case and a conservative case scenario.
My base case DCF assumes that FCFF grows by 12% over the next 5 years and then grows down to 2.5% terminal growth rate by year 10. The 12% CAGR represents 60% of the historical 10-yr FCFF growth rate, which I believe is quite conservative. I assume a weighted average cost of capital (WACC) of 9.32%. This produces a fair value estimate of $502 per share, and P/FVE of 0.57x.
Similarly, the conservative case DCF assumes that FCFF grows at 8.1% CAGR over the next 5 years (50% of 10-yr historical revenue growth rate). Again, this seems very conservative. This produces a fair value estimate of $405 per share, and P/FVE of 0.71x.
If we flip the calculation to calculate the current market-implied FCFF growth rate over the next 10 years, I estimate an implied 1.5% FCFF CAGR, relative to a 19-20% CAGR over the last 10 years.
We can also value $INTU using a two-stage dividend discount model. This is not a particularly appropriate model for the company as the payout ratio is very low (~30-35%). However, I like to use the DDM as a floor for the valuation.
The base case DDM assumes a year 1-5 dividend CAGR of 12% (80% of the 10-yr historical 15% CAGR), growing down to 8% by year 10, and then a terminal growth rate of 2.5% and a 10.28% cost of equity. The forecast assumes diluted share counts remain flat (277m) and net income payout ratios remain consistent (30-34%). This produces a fair value for the dividend of $140 per share. This implies that approximately 50% of the current share price is backed by the dividend.
Under the conservative case DDM, I assumed that the dividend CAGR in year 1-5 was 9.0% (60% of the 10-yr historical 15% CAGR). This produces a fair value for the dividend of $111 per share. Again, this implies that 39% of the current share price is backed by the dividend.
We can also look at valuation on a relative basis looking at price-earnings. $INTU trades at 17.5x trailing 12-month PE and 12.0x next 12-month PE.
Irrespective of which method I use to value $INTU, I find the valuation very compelling.
The FCFF models indicate that the company is 30-50% undervalued. The dividend accounts for 40-50% of the current share price and the market is currently implying FCFF growth of approximately 1.5% for the next decade (relative to ~20% CAGR over the last decade).
As such, I have decided to initiate a position in $INTU, which is the first position in the Vachellia Equity Dividend Champions Fund. 🏆
I bought $1k (1% position size) @ $269.11 on 30th September = 3.7159 shares.
I am looking to build this position over the next year to ~4% of the portfolio, if the fundamentals and valuation hold up. 🙌
@swshern@PulDeTrigger Thanks, Azrul. $SPGI screening will be coming out later today or tomorrow. 🙌
I have been a long-term shareholder of $SPGI and it looks interesting here sub $400, again.
$MSCI is one of the highest-quality businesses on earth. The stock has moved sideways for 5 years due to inflated premiums being paid for the stock 2020-2022.
I passed $MSCI through my screener this morning and it passed on 9/9 criteria. ✅️
1. The balance sheet is solid. $MSCI hold a fairly substantial amount of debt for what is supposed to be an asset-light business, with net debt to FCFF (net of stock-based compensation) currently at 3x. They have been taking on debt to repurchase shares (we have seen this before haven't we $FICO!!!).
Thankfully, interest coverage is appropriate at 8.1x adjusted FCFF. While there is a significant debt load, the business has ample cash to service the interest expense on this debt, and a buffer should rates continue to climb.
2. Return on capital is excellent at 31.7% return on invested capital averaged over the last 5 years. This gives a ROIC:cost of capital ratio well above 3x, indicating they generate significant value for each dollar of capital invested into the business. Not shown below is their return on incrementally invested capital (ROIIC) is even higher (~41%), which indicates that recently deployed capital is even more effective at creating value.
3. $MSCI's FCFF margin is 50.6%, net of stock-based compensation. This is incredible cash generation, indicating that for every $1 of revenue generated, $0.50 cents of cash is generated, even after accounting for SBC. I would posit there are not many businesses that post higher FCFF margins than $MSCI.
4. They pay an actively growing and well-supported dividend, with a current indicated yield of 1.27%.
The dividend has grown incredibly fast at over 20% CAGR over the last 5 and 10 years.
5. The dividend has plenty of room to grow with the current net income payout ratio at 43% and FCFF payout ratio even lower around 33%.
Moreover, diluted EPS is growing well at 17-22% CAGR over the last 5 and 10 years, respectively.
Notably, EPS growth is slightly < dividend growth so I would expect to see div growth rates slow slightly going forward (or payout ratios to increase).
The business looks incredibly strong according to my very simple screen. However, the valuation is not that appealing, despite share price hardly moving for 5 years.
Under my base case scenario of 13.3% FCFF growth over the next 5 years, and then growing down to 2.5% growth by year 10, shares are perfectly valued with a fair value estimate of $533 per share vs current share price of $535 (P/FVE = 1.00x).
Under a more conservative scenario of 10.9% FCFF growth over the next 5 years, shares are slightly overvalued but still fairly priced with a fair value estimate of $459 per share (P/FVE = 1.17x).
$MSCI is undoubtedly an incredible business, arguably one of the best businesses on earth. While the shares are now fairly valued, after trading at a significant premium to fair value over the last 5 years, I am still waiting for an appropriate margin-of-safety before initiating a position.
Personally, I would like a 10% margin of safety on my base case to initiate a position (<$480 per share). If we see a 10% margin-of-safety on my conservative case, I would consider a full overweight position (<$420).
What do you think about $MSCI? Are you buying here? If not, what is an attractive level? 🙌
@nanalyzetweets@grok Fair enough. I guess my opinion is also largely biased but my absolute aversion to retail.
The world needs oil. Always has. In my small-fry brain, I don't see the world needing branded apparel.
Yesterday, I put $INTU through my simple 9-metric screener and it passed with flying colors. ✅
The business fundamentals are strong: the balance sheet is sound, debt is manageable, returns on capital are suitable (and increasing) and dividend and earnings are growing healthily and well supported by a growing business.
$INTU looks like a compelling opportunity based on the financials. Today, I have been working through whether the current valuation is attractive. 👇
I built two free cash flow DCF's (FCFF-based) and two dividend discount models, both under my base case and a conservative case scenario.
My base case DCF assumes that FCFF grows by 12% over the next 5 years and then grows down to 2.5% terminal growth rate by year 10. The 12% CAGR represents 60% of the historical 10-yr FCFF growth rate, which I believe is quite conservative. I assume a weighted average cost of capital (WACC) of 9.32%. This produces a fair value estimate of $502 per share, and P/FVE of 0.57x.
Similarly, the conservative case DCF assumes that FCFF grows at 8.1% CAGR over the next 5 years (50% of 10-yr historical revenue growth rate). Again, this seems very conservative. This produces a fair value estimate of $405 per share, and P/FVE of 0.71x.
If we flip the calculation to calculate the current market-implied FCFF growth rate over the next 10 years, I estimate an implied 1.5% FCFF CAGR, relative to a 19-20% CAGR over the last 10 years.
We can also value $INTU using a two-stage dividend discount model. This is not a particularly appropriate model for the company as the payout ratio is very low (~30-35%). However, I like to use the DDM as a floor for the valuation.
The base case DDM assumes a year 1-5 dividend CAGR of 12% (80% of the 10-yr historical 15% CAGR), growing down to 8% by year 10, and then a terminal growth rate of 2.5% and a 10.28% cost of equity. The forecast assumes diluted share counts remain flat (277m) and net income payout ratios remain consistent (30-34%). This produces a fair value for the dividend of $140 per share. This implies that approximately 50% of the current share price is backed by the dividend.
Under the conservative case DDM, I assumed that the dividend CAGR in year 1-5 was 9.0% (60% of the 10-yr historical 15% CAGR). This produces a fair value for the dividend of $111 per share. Again, this implies that 39% of the current share price is backed by the dividend.
We can also look at valuation on a relative basis looking at price-earnings. $INTU trades at 17.5x trailing 12-month PE and 12.0x next 12-month PE.
Irrespective of which method I use to value $INTU, I find the valuation very compelling.
The FCFF models indicate that the company is 30-50% undervalued. The dividend accounts for 40-50% of the current share price and the market is currently implying FCFF growth of approximately 1.5% for the next decade (relative to ~20% CAGR over the last decade).
As such, I have decided to initiate a position in $INTU, which is the first position in the Vachellia Equity Dividend Champions Fund. 🏆
I bought $1k (1% position size) @ $269.11 on 30th September = 3.7159 shares.
I am looking to build this position over the next year to ~4% of the portfolio, if the fundamentals and valuation hold up. 🙌
Intuit ( $INTU ) is one of the worst performers in the S&P500 year-to-date, down over 60% in 2026. 📉
$INTU has been an incredible business for many years, so I thought it was time to pass it through my screener to see if this drawdown is worth considering further or not.
1. Balance Sheet Quality
$INTU has a strong balance sheet.
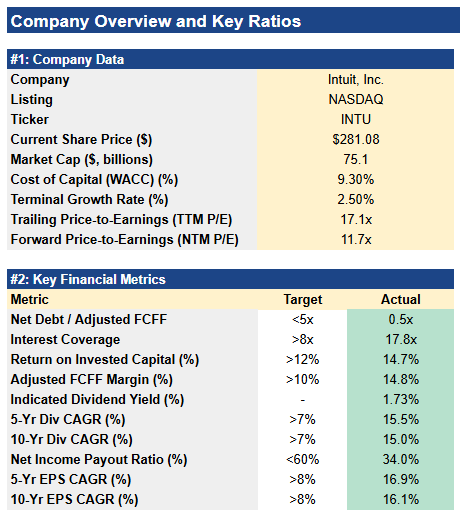
They hold $1.1 billion in net debt ($8.3 billion in total debt; short-term debt + long-term debt + long-term operating leases) against $5.2 billion in free cash flow to firm (FCFF). This represents a 0.2x net debt / FCFF ratio (MRQ), or 0.5x over the last 3 years, both of which are well below my threshold of 5x.
Similarly, both on an earnings (17.8x) and FCFF basis (20.4x), $INTU has high interest coverage ratios, well above the typical 8-12x ratio typically used to determine well-covered debt servicing capacity.
Approximately, 88% ($6.75 billion) of total debt is fixed-rate, with the remaining 12% ($0.92 billion) being variable-rate debt. In a a possible rising rates environment, $INTU clearly has room to service their variable-rate debt.
More importantly, $INTU has about 54% of their debt maturing in the next 5 years, with FY2027 notably seeing $1.2 billion (15.6% of total debt) mature.
As such, the high interest coverage ratios are really important as interest expense will increase significantly when this debt matures and gets rolled over into higher interest rate debt.
For example, their current weighted-average cost of debt is approximately 3.6% - 4.3%, while recent senior notes issued in June 2026 were offered with 4.950% and 5.50% coupon rates.
I think $INTU has a balance sheet that is well placed to endure what I expect to be a tough few years ahead of higher interest rates.
2. Return on Capital
$INTU's mean return on invested capital (ROIC) over the last 5 years is approximately 14.2%, and 19.6% over the TTM. While these numbers are depressed compared to their pre-2021 MailChimp acquisition (30-50% ROIC), they still generate returns on capital in excess of their weighted average cost of capital (WACC) of 9.30%. This indicates that capital deployed back into the business is value accretive.
A positive trend is seeing ROIC increase incrementally year-over-year since 2021, increasing from a low of 11.0% in 2023 to 19.6% (TTM), as they integrate their acquisitions into the business.
3. Cash Generation
$INTU is generating substantial cash flows. In FY26, they generated $8.8 billion in cash from operating activities and $8.6 billion in free cash flow, representing 41% increases year-over-year.
However, they also paid just over $2.0 billion in stock-based compensation in FY2026. Once we net this out, and adjust to FCFF, the generated approximately $6.8 billion.
These cash flows were generated on an adjusted FCFF margin of 14.8% in FY2026, their highest margin post-2021 integration, and trending upwards like ROIC.
I expect to see FCFF margins return to the 18-20% levels over the next few years as the business streamlines operations further.
4. Dividend Growth
$INTU currently pays a $4.26 per share dividend, with an indicated dividend yield of ~ 1.73%.
Over both the last 5-yr and 10-yr periods, the dividend per share (DPS) has growth by an average of 15% per annum. This is well above my threshold of 7% per annum, and represents an excellent, consistent and growing dividend.
5. Dividend Safety
The dividend appears to be very safe, with a net income payout ratio of 29.5% (TTM) and an adjusted FCFF payout ratio of 42.5% (TTM). Similarly, over the past 5 years, the two payout ratios have averaged 34% and 58%, respectively.
Notably, the net income payout ratio has remained relatively flat and consistent over the last 10 years in the 30-35% range. On the other hand, the FCFF payout ratio has increased slightly, albeit this is largely due to two irregular spikes of 78% and 80% in 2022 and 2024. These spikes were primarily due to significant increases in stock-based compensation in FY22 and FY24, relative to the preceding FY21 and FY23.
Irrespective, $INTU's dividend appears to be relatively safe and well-covered by both earnings and FCFF. The consistency of the payout ratio over time, in my opinion, is a very good sign of dividend safety and consistency, which is a priority.
6. Earnings
Much like their dividend, $INTU has grown diluted earnings per share (EPS) at an incredible rate of 16-17% over the last 5-yr and 10-yr period.
Notably, this is largely due to net income growth (17% CAGR per annum over the last 10 years), not due to significant reduction of their diluted share count through buybacks. In fact, diluted shares outstanding are currently higher TTM at 277 million than 10 years ago at 265 million, albeit over FY2026 they did retire ~ 6 million rates.
EPS is one of the best predictors of business growth, all else being equal, and the fact that $INTU have growth EPS at such a high and consistent rate over the last 10 years is testament to their business model.
Ideally, I would like to see EPS growth > DPS growth, otherwise the payout ratio starts to increase over time. Thankfully, $INTU's EPS growth per annum is about 1% > than DPS growth, so I would expect to see them continue to grow their dividend significantly over the next few years.
7. Summary
$INTU passes 9/9 of the quality screening criteria. ✅ It is important to acknowledge that these criteria are largely backwards-looking. However, despite the current 60% drawdown, the fundamentals of the business still look very strong.
The fundamentals are largely the product of high efficiency and consistency. Earnings and dividend growth has been consistently high (>15% per annum) for a decade, which produces a high-quality dividend with lots of room for further growth.
Moreover, the balance sheet is strong, with approximately 1 years worth of cash from operating activity / FCF in gross debt ($8 billion), and just over $1 billion in net debt. Interest expense is well covered by earnings and cash flow, with a substantial buffer to handle a possible higher interest rate going forward and a significant roll-over of 54% of existing debt into more expensive debt over the next 5 years.
Personally, I think $INTU looks like a compelling opportunity based on the above. Follow to make sure you don't miss a follow-up post where I will share my thoughts on the current valuation for $INTU under my base case and conservative case assumptions using both a (1) two-stage dividend discount model (DDM) and (2) a FCFF discounted cash flow model (DCF). 👍
Let me know your thoughts on $INTU? Does the company look like a good investment at these levels? 🤔
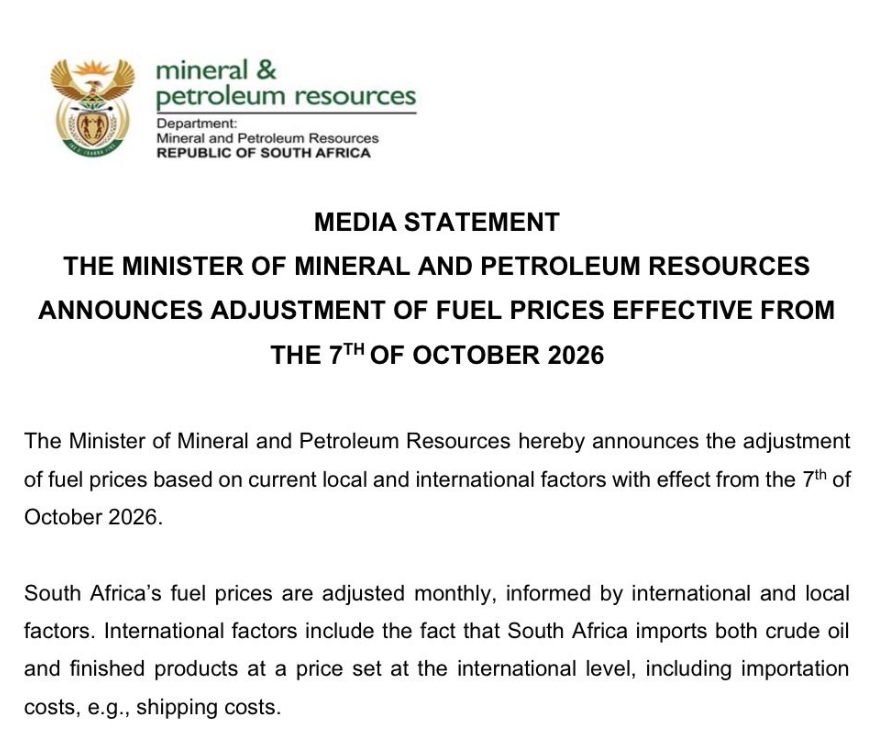
⛽ Fuel prices increase from 7 October 2026.
Petrol 93 increases by R3.12/l,
Petrol 95 increases by R3.33/l.
Diesel increases by R2.84/l to R3.24/l, depending on the grade.
The adjustments are based on changes in international oil prices, petroleum product prices and other local pricing factors.
🔗See the full statement for all fuel price adjustments. https://t.co/7xv2YY4Z1c
#GovZAUpdates #FuelPriceAdjustments #FuelIncrease
🎧 Reit balance sheets strongest in a decade
° Independent analyst @jmoyaha_ on Sappi’s struggles with its proposed graphic paper JV, plus Sanlam’s move to buy Santam.
° Ian Anderson from Merchant West Investments unpacks September’s Reit returns, driven by strong dividend increases from a number of recent results.
° Alan Quinn from https://t.co/sQ98PFsE59 on how high fuel prices are changing consumer buying habits when shopping for a car.
https://t.co/XosA49NPEX
@ariaradnia Yes. The fundamentals look strong - balance sheet is durable, growth is strong and consistent, dividend provides a floor on valuation. 👍
https://t.co/XBpLhi1w6c
Intuit ( $INTU ) is one of the worst performers in the S&P500 year-to-date, down over 60% in 2026. 📉
$INTU has been an incredible business for many years, so I thought it was time to pass it through my screener to see if this drawdown is worth considering further or not.
1. Balance Sheet Quality
$INTU has a strong balance sheet.
They hold $1.1 billion in net debt ($8.3 billion in total debt; short-term debt + long-term debt + long-term operating leases) against $5.2 billion in free cash flow to firm (FCFF). This represents a 0.2x net debt / FCFF ratio (MRQ), or 0.5x over the last 3 years, both of which are well below my threshold of 5x.
Similarly, both on an earnings (17.8x) and FCFF basis (20.4x), $INTU has high interest coverage ratios, well above the typical 8-12x ratio typically used to determine well-covered debt servicing capacity.
Approximately, 88% ($6.75 billion) of total debt is fixed-rate, with the remaining 12% ($0.92 billion) being variable-rate debt. In a a possible rising rates environment, $INTU clearly has room to service their variable-rate debt.
More importantly, $INTU has about 54% of their debt maturing in the next 5 years, with FY2027 notably seeing $1.2 billion (15.6% of total debt) mature.
As such, the high interest coverage ratios are really important as interest expense will increase significantly when this debt matures and gets rolled over into higher interest rate debt.
For example, their current weighted-average cost of debt is approximately 3.6% - 4.3%, while recent senior notes issued in June 2026 were offered with 4.950% and 5.50% coupon rates.
I think $INTU has a balance sheet that is well placed to endure what I expect to be a tough few years ahead of higher interest rates.
2. Return on Capital
$INTU's mean return on invested capital (ROIC) over the last 5 years is approximately 14.2%, and 19.6% over the TTM. While these numbers are depressed compared to their pre-2021 MailChimp acquisition (30-50% ROIC), they still generate returns on capital in excess of their weighted average cost of capital (WACC) of 9.30%. This indicates that capital deployed back into the business is value accretive.
A positive trend is seeing ROIC increase incrementally year-over-year since 2021, increasing from a low of 11.0% in 2023 to 19.6% (TTM), as they integrate their acquisitions into the business.
3. Cash Generation
$INTU is generating substantial cash flows. In FY26, they generated $8.8 billion in cash from operating activities and $8.6 billion in free cash flow, representing 41% increases year-over-year.
However, they also paid just over $2.0 billion in stock-based compensation in FY2026. Once we net this out, and adjust to FCFF, the generated approximately $6.8 billion.
These cash flows were generated on an adjusted FCFF margin of 14.8% in FY2026, their highest margin post-2021 integration, and trending upwards like ROIC.
I expect to see FCFF margins return to the 18-20% levels over the next few years as the business streamlines operations further.
4. Dividend Growth
$INTU currently pays a $4.26 per share dividend, with an indicated dividend yield of ~ 1.73%.
Over both the last 5-yr and 10-yr periods, the dividend per share (DPS) has growth by an average of 15% per annum. This is well above my threshold of 7% per annum, and represents an excellent, consistent and growing dividend.
5. Dividend Safety
The dividend appears to be very safe, with a net income payout ratio of 29.5% (TTM) and an adjusted FCFF payout ratio of 42.5% (TTM). Similarly, over the past 5 years, the two payout ratios have averaged 34% and 58%, respectively.
Notably, the net income payout ratio has remained relatively flat and consistent over the last 10 years in the 30-35% range. On the other hand, the FCFF payout ratio has increased slightly, albeit this is largely due to two irregular spikes of 78% and 80% in 2022 and 2024. These spikes were primarily due to significant increases in stock-based compensation in FY22 and FY24, relative to the preceding FY21 and FY23.
Irrespective, $INTU's dividend appears to be relatively safe and well-covered by both earnings and FCFF. The consistency of the payout ratio over time, in my opinion, is a very good sign of dividend safety and consistency, which is a priority.
6. Earnings
Much like their dividend, $INTU has grown diluted earnings per share (EPS) at an incredible rate of 16-17% over the last 5-yr and 10-yr period.
Notably, this is largely due to net income growth (17% CAGR per annum over the last 10 years), not due to significant reduction of their diluted share count through buybacks. In fact, diluted shares outstanding are currently higher TTM at 277 million than 10 years ago at 265 million, albeit over FY2026 they did retire ~ 6 million rates.
EPS is one of the best predictors of business growth, all else being equal, and the fact that $INTU have growth EPS at such a high and consistent rate over the last 10 years is testament to their business model.
Ideally, I would like to see EPS growth > DPS growth, otherwise the payout ratio starts to increase over time. Thankfully, $INTU's EPS growth per annum is about 1% > than DPS growth, so I would expect to see them continue to grow their dividend significantly over the next few years.
7. Summary
$INTU passes 9/9 of the quality screening criteria. ✅ It is important to acknowledge that these criteria are largely backwards-looking. However, despite the current 60% drawdown, the fundamentals of the business still look very strong.
The fundamentals are largely the product of high efficiency and consistency. Earnings and dividend growth has been consistently high (>15% per annum) for a decade, which produces a high-quality dividend with lots of room for further growth.
Moreover, the balance sheet is strong, with approximately 1 years worth of cash from operating activity / FCF in gross debt ($8 billion), and just over $1 billion in net debt. Interest expense is well covered by earnings and cash flow, with a substantial buffer to handle a possible higher interest rate going forward and a significant roll-over of 54% of existing debt into more expensive debt over the next 5 years.
Personally, I think $INTU looks like a compelling opportunity based on the above. Follow to make sure you don't miss a follow-up post where I will share my thoughts on the current valuation for $INTU under my base case and conservative case assumptions using both a (1) two-stage dividend discount model (DDM) and (2) a FCFF discounted cash flow model (DCF). 👍
Let me know your thoughts on $INTU? Does the company look like a good investment at these levels? 🤔
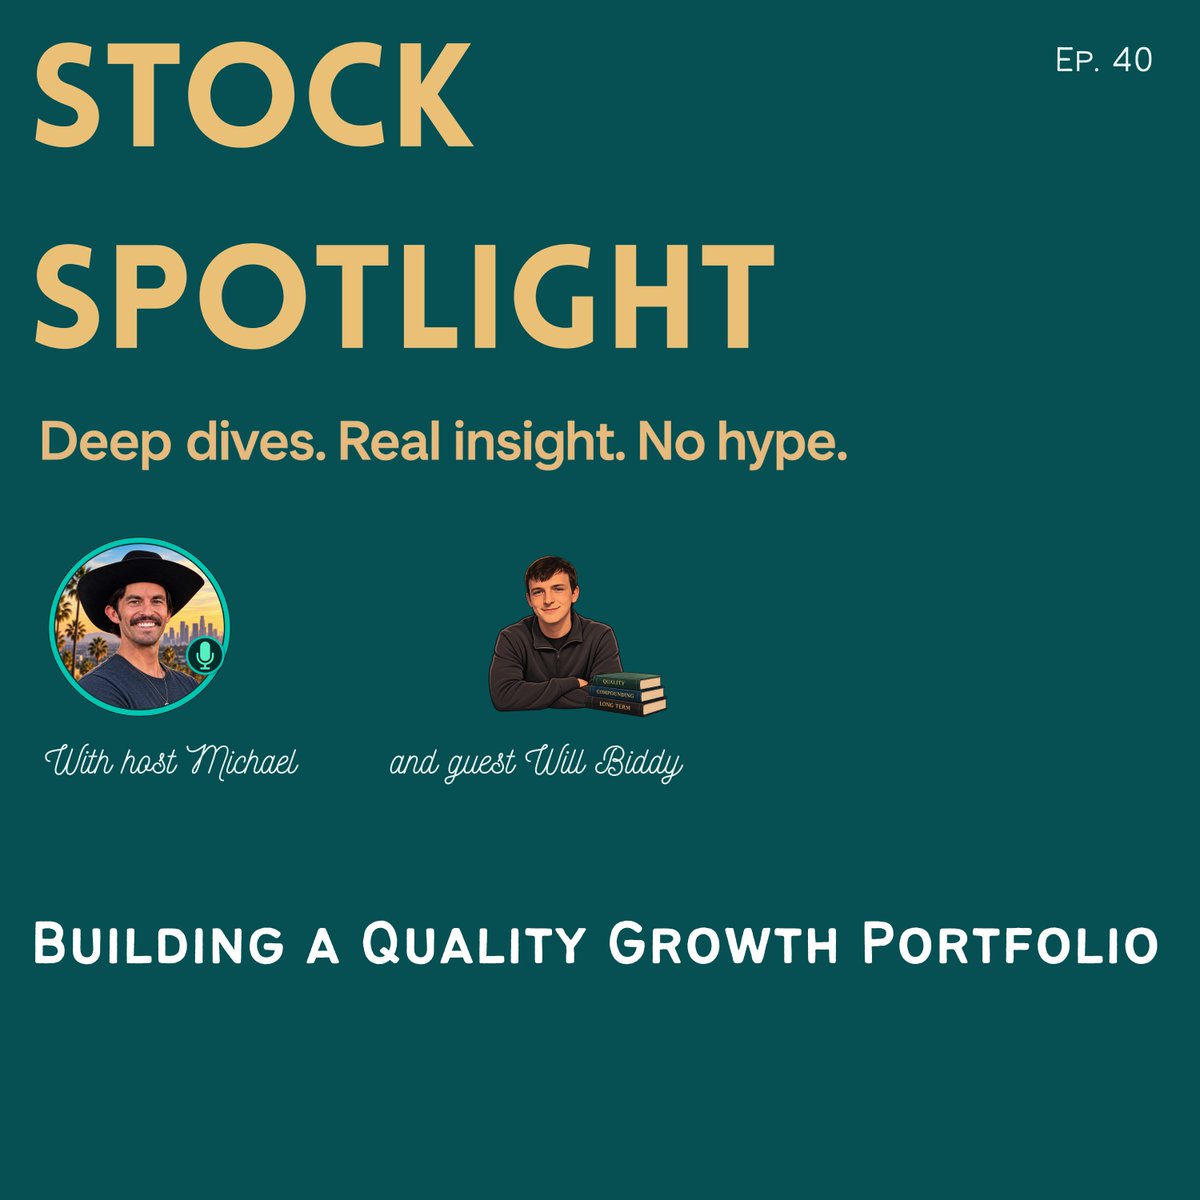
🎙️ New Stock Spotlight episode is live!
Building a Quality Growth Portfolio with Will Biddy
I sat down with @WillBiddy_ to talk about how we find companies we want to own, what we’re willing to pay and how we manage our portfolios.
A few things we got into:
• What makes a business “world class”
• How much valuation matters when you love the business
• Sizing positions, adding and deciding when to sell
• Our theses for $TOST and $ISRG
• What Will has learned along the way
I’ve enjoyed following Will’s research and portfolio updates on X, so it was fun to hear more about his background and compare notes.
Spotify: https://t.co/8aO56kmcWL
Apple Podcasts: https://t.co/oGw0AzooRe
YouTube: https://t.co/pROUFNHONC
Intuit ( $INTU ) is one of the worst performers in the S&P500 year-to-date, down over 60% in 2026. 📉
$INTU has been an incredible business for many years, so I thought it was time to pass it through my screener to see if this drawdown is worth considering further or not.
1. Balance Sheet Quality
$INTU has a strong balance sheet.
They hold $1.1 billion in net debt ($8.3 billion in total debt; short-term debt + long-term debt + long-term operating leases) against $5.2 billion in free cash flow to firm (FCFF). This represents a 0.2x net debt / FCFF ratio (MRQ), or 0.5x over the last 3 years, both of which are well below my threshold of 5x.
Similarly, both on an earnings (17.8x) and FCFF basis (20.4x), $INTU has high interest coverage ratios, well above the typical 8-12x ratio typically used to determine well-covered debt servicing capacity.
Approximately, 88% ($6.75 billion) of total debt is fixed-rate, with the remaining 12% ($0.92 billion) being variable-rate debt. In a a possible rising rates environment, $INTU clearly has room to service their variable-rate debt.
More importantly, $INTU has about 54% of their debt maturing in the next 5 years, with FY2027 notably seeing $1.2 billion (15.6% of total debt) mature.
As such, the high interest coverage ratios are really important as interest expense will increase significantly when this debt matures and gets rolled over into higher interest rate debt.
For example, their current weighted-average cost of debt is approximately 3.6% - 4.3%, while recent senior notes issued in June 2026 were offered with 4.950% and 5.50% coupon rates.
I think $INTU has a balance sheet that is well placed to endure what I expect to be a tough few years ahead of higher interest rates.
2. Return on Capital
$INTU's mean return on invested capital (ROIC) over the last 5 years is approximately 14.2%, and 19.6% over the TTM. While these numbers are depressed compared to their pre-2021 MailChimp acquisition (30-50% ROIC), they still generate returns on capital in excess of their weighted average cost of capital (WACC) of 9.30%. This indicates that capital deployed back into the business is value accretive.
A positive trend is seeing ROIC increase incrementally year-over-year since 2021, increasing from a low of 11.0% in 2023 to 19.6% (TTM), as they integrate their acquisitions into the business.
3. Cash Generation
$INTU is generating substantial cash flows. In FY26, they generated $8.8 billion in cash from operating activities and $8.6 billion in free cash flow, representing 41% increases year-over-year.
However, they also paid just over $2.0 billion in stock-based compensation in FY2026. Once we net this out, and adjust to FCFF, the generated approximately $6.8 billion.
These cash flows were generated on an adjusted FCFF margin of 14.8% in FY2026, their highest margin post-2021 integration, and trending upwards like ROIC.
I expect to see FCFF margins return to the 18-20% levels over the next few years as the business streamlines operations further.
4. Dividend Growth
$INTU currently pays a $4.26 per share dividend, with an indicated dividend yield of ~ 1.73%.
Over both the last 5-yr and 10-yr periods, the dividend per share (DPS) has growth by an average of 15% per annum. This is well above my threshold of 7% per annum, and represents an excellent, consistent and growing dividend.
5. Dividend Safety
The dividend appears to be very safe, with a net income payout ratio of 29.5% (TTM) and an adjusted FCFF payout ratio of 42.5% (TTM). Similarly, over the past 5 years, the two payout ratios have averaged 34% and 58%, respectively.
Notably, the net income payout ratio has remained relatively flat and consistent over the last 10 years in the 30-35% range. On the other hand, the FCFF payout ratio has increased slightly, albeit this is largely due to two irregular spikes of 78% and 80% in 2022 and 2024. These spikes were primarily due to significant increases in stock-based compensation in FY22 and FY24, relative to the preceding FY21 and FY23.
Irrespective, $INTU's dividend appears to be relatively safe and well-covered by both earnings and FCFF. The consistency of the payout ratio over time, in my opinion, is a very good sign of dividend safety and consistency, which is a priority.
6. Earnings
Much like their dividend, $INTU has grown diluted earnings per share (EPS) at an incredible rate of 16-17% over the last 5-yr and 10-yr period.
Notably, this is largely due to net income growth (17% CAGR per annum over the last 10 years), not due to significant reduction of their diluted share count through buybacks. In fact, diluted shares outstanding are currently higher TTM at 277 million than 10 years ago at 265 million, albeit over FY2026 they did retire ~ 6 million rates.
EPS is one of the best predictors of business growth, all else being equal, and the fact that $INTU have growth EPS at such a high and consistent rate over the last 10 years is testament to their business model.
Ideally, I would like to see EPS growth > DPS growth, otherwise the payout ratio starts to increase over time. Thankfully, $INTU's EPS growth per annum is about 1% > than DPS growth, so I would expect to see them continue to grow their dividend significantly over the next few years.
7. Summary
$INTU passes 9/9 of the quality screening criteria. ✅ It is important to acknowledge that these criteria are largely backwards-looking. However, despite the current 60% drawdown, the fundamentals of the business still look very strong.
The fundamentals are largely the product of high efficiency and consistency. Earnings and dividend growth has been consistently high (>15% per annum) for a decade, which produces a high-quality dividend with lots of room for further growth.
Moreover, the balance sheet is strong, with approximately 1 years worth of cash from operating activity / FCF in gross debt ($8 billion), and just over $1 billion in net debt. Interest expense is well covered by earnings and cash flow, with a substantial buffer to handle a possible higher interest rate going forward and a significant roll-over of 54% of existing debt into more expensive debt over the next 5 years.
Personally, I think $INTU looks like a compelling opportunity based on the above. Follow to make sure you don't miss a follow-up post where I will share my thoughts on the current valuation for $INTU under my base case and conservative case assumptions using both a (1) two-stage dividend discount model (DDM) and (2) a FCFF discounted cash flow model (DCF). 👍
Let me know your thoughts on $INTU? Does the company look like a good investment at these levels? 🤔
AI will replace jobs for a while. Future earnings are massively overstated. Hyperscaler and AI-related debt on and off balance sheet are finally priced in, companies cannot make anywhere near ROE required to cover CapEx build out, big market correction. Hopefully, companies then start re-hiring competent humans (this last point is probably wishful thinking) and jobs land up okay.
If you found my quality and valuation screen summary for $MSCI below interesting and informative, stay tuned for the rest of this week. 👇
I will be screening the following companies this week 🗓:
- Intuit ( $INTU )
- S&P Global ( $SPGI )
- Linde plc ( $LIN )
And maybe 1 or 2 others, if anyone would like to put forward a company they would like to see screened? 🙌
A quick reminder: my quality and valuation screen is intended as an efficient initial evaluation of company fundamentals to determine whether I believe the company is worth performing more detailed research as a possible investment. It is NOT intended to be a fully comprehensive analysis or a tool for me to make my investment decisions. 👍
$MSCI is one of the highest-quality businesses on earth. The stock has moved sideways for 5 years due to inflated premiums being paid for the stock 2020-2022.
I passed $MSCI through my screener this morning and it passed on 9/9 criteria. ✅️
1. The balance sheet is solid. $MSCI hold a fairly substantial amount of debt for what is supposed to be an asset-light business, with net debt to FCFF (net of stock-based compensation) currently at 3x. They have been taking on debt to repurchase shares (we have seen this before haven't we $FICO!!!).
Thankfully, interest coverage is appropriate at 8.1x adjusted FCFF. While there is a significant debt load, the business has ample cash to service the interest expense on this debt, and a buffer should rates continue to climb.
2. Return on capital is excellent at 31.7% return on invested capital averaged over the last 5 years. This gives a ROIC:cost of capital ratio well above 3x, indicating they generate significant value for each dollar of capital invested into the business. Not shown below is their return on incrementally invested capital (ROIIC) is even higher (~41%), which indicates that recently deployed capital is even more effective at creating value.
3. $MSCI's FCFF margin is 50.6%, net of stock-based compensation. This is incredible cash generation, indicating that for every $1 of revenue generated, $0.50 cents of cash is generated, even after accounting for SBC. I would posit there are not many businesses that post higher FCFF margins than $MSCI.
4. They pay an actively growing and well-supported dividend, with a current indicated yield of 1.27%.
The dividend has grown incredibly fast at over 20% CAGR over the last 5 and 10 years.
5. The dividend has plenty of room to grow with the current net income payout ratio at 43% and FCFF payout ratio even lower around 33%.
Moreover, diluted EPS is growing well at 17-22% CAGR over the last 5 and 10 years, respectively.
Notably, EPS growth is slightly < dividend growth so I would expect to see div growth rates slow slightly going forward (or payout ratios to increase).
The business looks incredibly strong according to my very simple screen. However, the valuation is not that appealing, despite share price hardly moving for 5 years.
Under my base case scenario of 13.3% FCFF growth over the next 5 years, and then growing down to 2.5% growth by year 10, shares are perfectly valued with a fair value estimate of $533 per share vs current share price of $535 (P/FVE = 1.00x).
Under a more conservative scenario of 10.9% FCFF growth over the next 5 years, shares are slightly overvalued but still fairly priced with a fair value estimate of $459 per share (P/FVE = 1.17x).
$MSCI is undoubtedly an incredible business, arguably one of the best businesses on earth. While the shares are now fairly valued, after trading at a significant premium to fair value over the last 5 years, I am still waiting for an appropriate margin-of-safety before initiating a position.
Personally, I would like a 10% margin of safety on my base case to initiate a position (<$480 per share). If we see a 10% margin-of-safety on my conservative case, I would consider a full overweight position (<$420).
What do you think about $MSCI? Are you buying here? If not, what is an attractive level? 🙌
@j_enz Thanks for the kind words. 🙌
I agree all round. Love the fact that management are personally buying loads of shares, too. Skin in the game. 👍
$SPGI, $MSCI, $MCO and $FICO have been incredible tests for shareholders the last few years, indeed.
Valuation really matters.