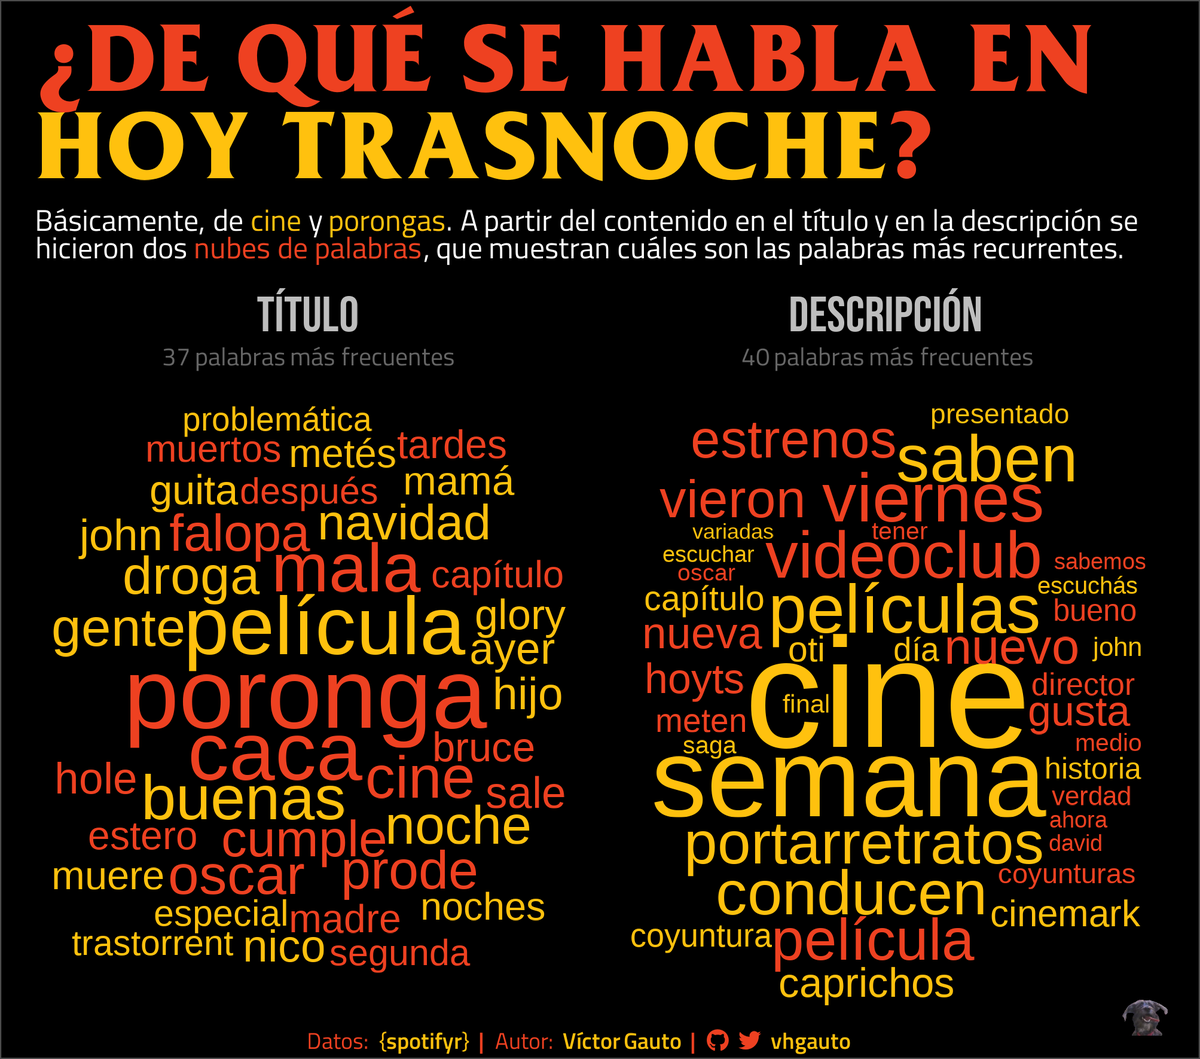
Hice algunos análisis de datos del único podcast del mundo, #HoyTrasnoche. Saqué la info de Spotify e hice varios gráficos.
@postafm
Acá podemos ver de qué cosas se hablan en el podcast a partir de nubes de palabras.
#RStats
Mutating joins in R
A mutating join adds columns to one data set (ie, mutates it) using variables from a secondary set. By far the most common and important is left_join, my focus here.
https://t.co/pqpmTHCnNM
Quarto 2: Parsing and Source Maps
Why Quarto 2 ships its own Markdown parser: actionable syntax errors, source locations that survive the entire processing pipeline, and a syntax we can hold stable for the project’s lifespan
https://t.co/asMVOdsCZI
Async & Parallel R with {mirai} | Charlie Gao | Data Science Lab
On this call, Libby Heeren is joined by Charlie Gao, who walks through async and parallel programming using the mirai package for R. Charlie is the author of {mirai} and {mori}!
https://t.co/j8Z5j7VY5w
Doing crazy things with your legends in ggplot2 (CC421)
Pat shows how to create legend subsections and assign multiple plotting symbols and colors to the same category.
https://t.co/9Xo7UjZV4F
Tidying data with pivot_longer
If you're working with data, you will encounter wide sets. Here's how to tidy them in preparation for wrangling, visualization, and modeling.
https://t.co/YmNUedBEpl
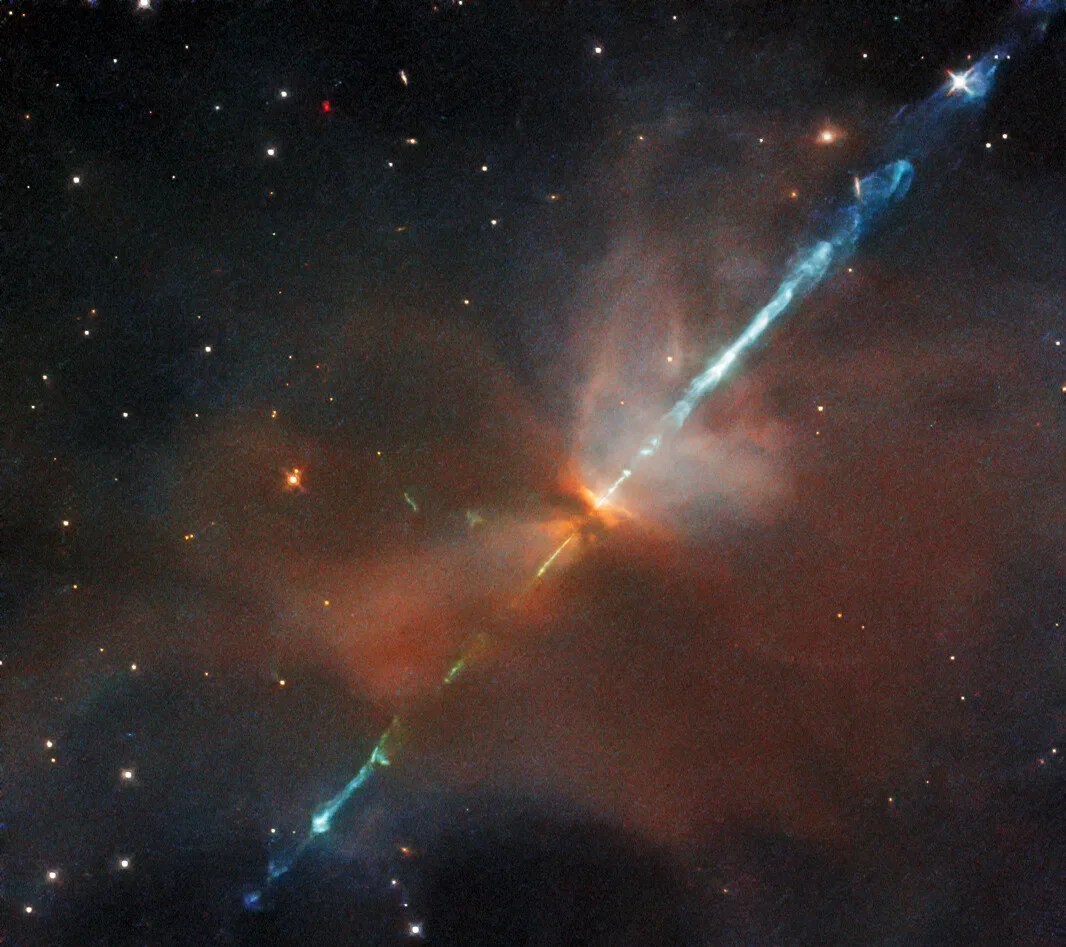
The force awakens in newborn stars.
Hubble captured some cosmic "lightsabers" far, far away. These are actually young stellar jets, colliding at fast speeds with nearby gas and dust.
Happy Star Wars Day from the Hubble team!
I've made a super-simple website, where you can check which cities lay on the same parallel (and also the mirrored parallel on other hemisphere).
You can expect the same sunlight hours (longer nights, shorter days, etc) and similar sun power there.
https://t.co/MKCOz2vCBt
Speed up data analysis in R with the package suite fastverse. It unites several high-performance R packages for fast data manipulation, transformation, and computation, helping you build efficient workflows with minimal dependencies.
Perfect for:
✔️ Working with large or complex datasets that require speed and efficiency
✔️ Creating lightweight, performance-oriented R pipelines
✔️ Managing a custom collection of optimized R packages in one place
✔️ Projects where compiled code performance (C/C++) makes a real difference
Learn more on GitHub: https://t.co/KLNkSYwAoY
For more on statistics, data science, R, and Python, subscribe to my newsletter. Take a look here for more details: https://t.co/ktUcWo9XpO
#Rpackage #coding #R #database #Data #RStats #datascienceenthusiast
🎯 [TIP de R - RECURSO 📚] ¿Querés crear mapas interactivos sin depender de servidores externos?
{freestiler} es un motor de vector tiles para R que convierte datos espaciales en archivos PMTiles listos para servir desde cualquier lado.
freestiler te permite transformar objetos `sf`, archivos en disco o queries de DuckDB en un único archivo `.pmtiles` sin necesidad de instalar dependencias externas. El motor está escrito en Rust y corre in-process, lo que lo hace súper rápido y eficiente. Soporta dos formatos: MapLibre Tiles (MLT), un formato columnar de nueva generación que es el default, y Mapbox Vector Tiles (MVT), el formato protobuf ampliamente soportado.
Lo mejor es que todo funciona con una sola salida: un archivo `.pmtiles` que podés servir desde cualquier servidor estático. Ideal si trabajás con datos geoespaciales grandes y querés evitar la complejidad de infraestructuras complicadas.
✔️ Beneficios:
✔️ **Sin dependencias extra**: Todo integrado en R, escrito en Rust y corre en el mismo proceso
✔️ **Flexible con tus datos**: Funciona con sf objects, archivos en disco o queries de DuckDB
✔️ **Portabilidad total**: Un archivo `.pmtiles` que servís desde cualquier lugar sin infraestructura pesada
🔥 Tip: Combiná freestiler con Shiny o Quarto para crear dashboards geoespaciales que escalen sin quebraderos de cabeza.
↪ https://t.co/GGzbet0G1N
✍🏽 @kyle_e_walker
¿Ya trabajás con datos geoespaciales en R? ¿Qué herramientas usás actualmente para visualizarlos?
#RStats #RStatsES #Rtips #DataScience
📖 Published!
fastbioclim: An R package for creating custom-time bioclimatic and derived environmental summary variables🖥️
fastbioclim enhances the quality of environmental data for more temporally accurate ecological and biogeographical studies🌍
🔎 https://t.co/GKC7MH1uNi
🥳Presento mi paquete de R, synopR, para decodificar mensajes SYNOP. También permite descargar datos meteorológicos desde Ogimet (toma los SYNOP y devuelve un data frame con los datos decodificados).
https://t.co/RCsX22FSWV
Welcome home Reid, Victor, Christina, and Jeremy! 🫶
The Artemis II astronauts have splashed down at 8:07pm ET (0007 UTC April 11), bringing their historic 10-day mission around the Moon to an end.
🛰 🌛 ¿Ciencia argentina en misión a la Luna? Tenemos 😎
🚀#ATENEA es un satélite hecho por 7 instituciones del sist científico y universitario 🇦🇷 que viajó en la misión #Artemis2 de la NASA
🧩Te contamos cómo se hizo el rompecabezas satelital (seguinos en ig: @cienciaparaque_)
We see our home planet as a whole, lit up in spectacular blues and browns. A green aurora even lights up the atmosphere. That's us, together, watching as our astronauts make their journey to the Moon.


![estacion_erre's tweet photo. 🎯 [TIP de R - RECURSO 📚] ¿Querés crear mapas interactivos sin depender de servidores externos?
{freestiler} es un motor de vector tiles para R que convierte datos espaciales en archivos PMTiles listos para servir desde cualquier lado.
freestiler te permite transformar objetos `sf`, archivos en disco o queries de DuckDB en un único archivo `.pmtiles` sin necesidad de instalar dependencias externas. El motor está escrito en Rust y corre in-process, lo que lo hace súper rápido y eficiente. Soporta dos formatos: MapLibre Tiles (MLT), un formato columnar de nueva generación que es el default, y Mapbox Vector Tiles (MVT), el formato protobuf ampliamente soportado.
Lo mejor es que todo funciona con una sola salida: un archivo `.pmtiles` que podés servir desde cualquier servidor estático. Ideal si trabajás con datos geoespaciales grandes y querés evitar la complejidad de infraestructuras complicadas.
✔️ Beneficios:
✔️ **Sin dependencias extra**: Todo integrado en R, escrito en Rust y corre en el mismo proceso
✔️ **Flexible con tus datos**: Funciona con sf objects, archivos en disco o queries de DuckDB
✔️ **Portabilidad total**: Un archivo `.pmtiles` que servís desde cualquier lugar sin infraestructura pesada
🔥 Tip: Combiná freestiler con Shiny o Quarto para crear dashboards geoespaciales que escalen sin quebraderos de cabeza.
↪ https://t.co/GGzbet0G1N
✍🏽 @kyle_e_walker
¿Ya trabajás con datos geoespaciales en R? ¿Qué herramientas usás actualmente para visualizarlos?
#RStats #RStatsES #Rtips #DataScience](https://pbs.twimg.com/media/HFnqLF1WMAAKfty.jpg)
![estacion_erre's tweet photo. 🎯 [TIP de R - RECURSO 📚] ¿Querés crear mapas interactivos sin depender de servidores externos?
{freestiler} es un motor de vector tiles para R que convierte datos espaciales en archivos PMTiles listos para servir desde cualquier lado.
freestiler te permite transformar objetos `sf`, archivos en disco o queries de DuckDB en un único archivo `.pmtiles` sin necesidad de instalar dependencias externas. El motor está escrito en Rust y corre in-process, lo que lo hace súper rápido y eficiente. Soporta dos formatos: MapLibre Tiles (MLT), un formato columnar de nueva generación que es el default, y Mapbox Vector Tiles (MVT), el formato protobuf ampliamente soportado.
Lo mejor es que todo funciona con una sola salida: un archivo `.pmtiles` que podés servir desde cualquier servidor estático. Ideal si trabajás con datos geoespaciales grandes y querés evitar la complejidad de infraestructuras complicadas.
✔️ Beneficios:
✔️ **Sin dependencias extra**: Todo integrado en R, escrito en Rust y corre en el mismo proceso
✔️ **Flexible con tus datos**: Funciona con sf objects, archivos en disco o queries de DuckDB
✔️ **Portabilidad total**: Un archivo `.pmtiles` que servís desde cualquier lugar sin infraestructura pesada
🔥 Tip: Combiná freestiler con Shiny o Quarto para crear dashboards geoespaciales que escalen sin quebraderos de cabeza.
↪ https://t.co/GGzbet0G1N
✍🏽 @kyle_e_walker
¿Ya trabajás con datos geoespaciales en R? ¿Qué herramientas usás actualmente para visualizarlos?
#RStats #RStatsES #Rtips #DataScience](https://pbs.twimg.com/media/HFnqLF0W4AAtL-w.jpg)


![estacion_erre's tweet photo. 🎯 [TIP de R - RECURSO 📚] ¿Querés crear mapas interactivos sin depender de servidores externos?
{freestiler} es un motor de vector tiles para R que convierte datos espaciales en archivos PMTiles listos para servir desde cualquier lado.
freestiler te permite transformar objetos `sf`, archivos en disco o queries de DuckDB en un único archivo `.pmtiles` sin necesidad de instalar dependencias externas. El motor está escrito en Rust y corre in-process, lo que lo hace súper rápido y eficiente. Soporta dos formatos: MapLibre Tiles (MLT), un formato columnar de nueva generación que es el default, y Mapbox Vector Tiles (MVT), el formato protobuf ampliamente soportado.
Lo mejor es que todo funciona con una sola salida: un archivo `.pmtiles` que podés servir desde cualquier servidor estático. Ideal si trabajás con datos geoespaciales grandes y querés evitar la complejidad de infraestructuras complicadas.
✔️ Beneficios:
✔️ **Sin dependencias extra**: Todo integrado en R, escrito en Rust y corre en el mismo proceso
✔️ **Flexible con tus datos**: Funciona con sf objects, archivos en disco o queries de DuckDB
✔️ **Portabilidad total**: Un archivo `.pmtiles` que servís desde cualquier lugar sin infraestructura pesada
🔥 Tip: Combiná freestiler con Shiny o Quarto para crear dashboards geoespaciales que escalen sin quebraderos de cabeza.
↪ https://t.co/GGzbet0G1N
✍🏽 @kyle_e_walker
¿Ya trabajás con datos geoespaciales en R? ¿Qué herramientas usás actualmente para visualizarlos?
#RStats #RStatsES #Rtips #DataScience](https://pbs.twimg.com/media/HFnqLGOakAE8esi.jpg)


