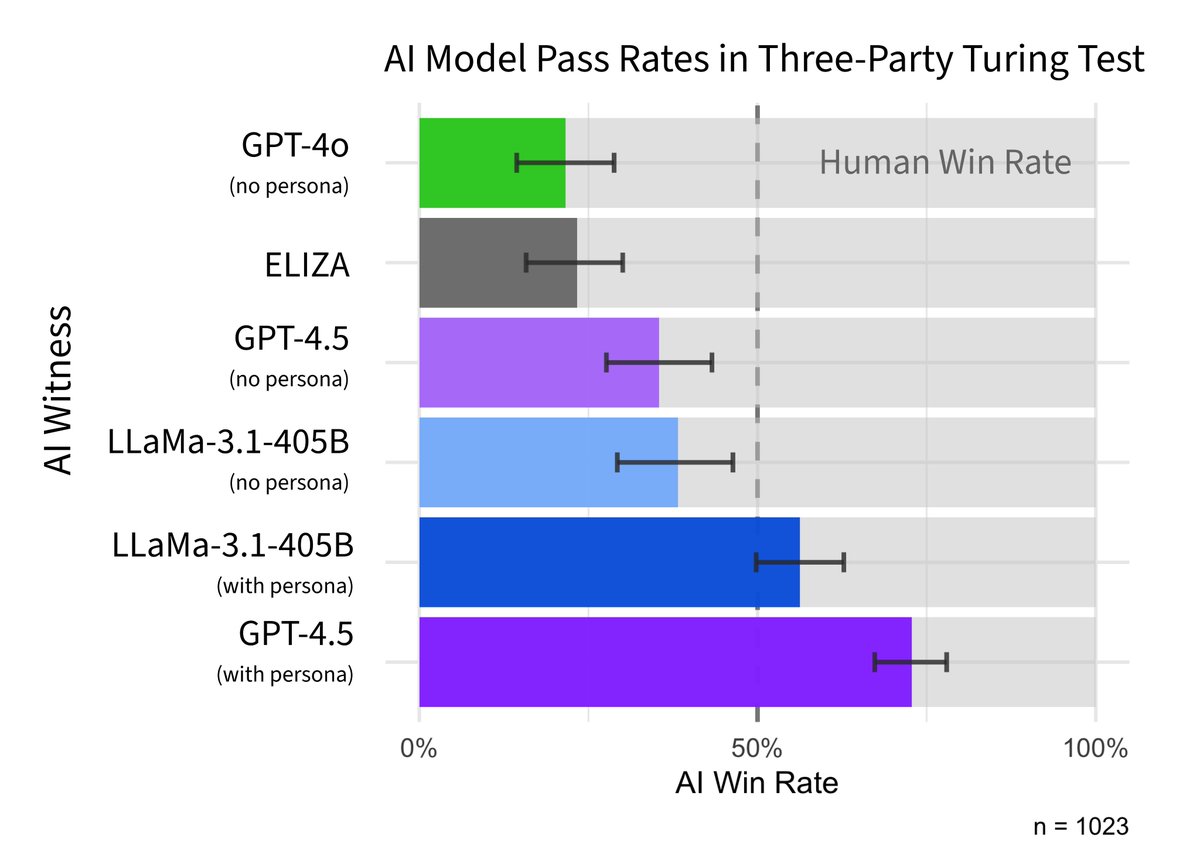
New preprint: we evaluated LLMs in a 3-party Turing test (participants speak to a human & AI simultaneously and decide which is which).
GPT-4.5 (when prompted to adopt a humanlike persona) was judged to be the human 73% of the time, suggesting it passes the Turing test (🧵)
New preprint: we evaluated LLMs in a 3-party Turing test (participants speak to a human & AI simultaneously and decide which is which).
GPT-4.5 (when prompted to adopt a humanlike persona) was judged to be the human 73% of the time, suggesting it passes the Turing test (🧵)
Boxplots are one of the most useful tools in my Data Science arsenal. In 6 minutes, I'll teach you 6 years of using box plots for EDA and problem-solving. Let's dive in.
1. What is a boxplot? A boxplot is a standardized way of displaying the distribution of data based on a five-number summary: minimum, first quartile (Q1), median, third quartile (Q3), and maximum.
2. Invention: The boxplot was invented in 1969 by John Tukey, as part of his pioneering work in data visualization. Tukey's EDA emphasized the importance of using simple graphical and numerical methods to start understanding the data before making any assumptions about its underlying distribution or applying complex statistical models. The boxplot emerged from this philosophy. Tukey's boxplot was designed to be a quick and easy way to visualize the distribution of data.
3. Usage: I use boxplots during the exploratory phase. First, I assess correlations to an outcome I am interested in. Then I explore the top features during Exploratory Data Analysis (EDA). Boxplots are heavily used in my EDA.
4. Key Features of Boxplots: In one quick visualization, boxplots display distribution summary, outliers, skewness, and it facilitates comparisons between multiple groups or categories.
5. The Box: The box spans from the first quartile (Q1) to the third quartile (Q3). This range, known as the interquartile range (IQR), contains the middle 50% of the data. The line inside the box represents the median (the second quartile, Q2), which divides the dataset into two equal halves.
6. The Whiskers: The whiskers extend from the box to show the range of the data. A common approach is to extend them to the smallest and largest values within 1.5 times the IQR from the first and third quartiles, respectively. Data points outside this range are considered outliers and are sometimes plotted as individual points.
7. Outliers: These are data points that lie beyond the end of the whiskers. They are not part of the bulk of the data and may indicate variability in the data, experimental errors, or novel findings. Explore these!
8. Skewness: If the median is not equidistant from Q1 and Q3, or if the whiskers are of unequal lengths, it suggests that the data is skewed.
There you have it- my top 8 concepts on box plots. The next problem you'll face is how to apply data science to business.
I'd like to help.
I’ve spent 100 hours consolidating my learnings into a free 5-day course, How to Solve Business Problems with Data Science. It comes with:
300+ lines of R and Python code
5 bonus trainings
2 systematic frameworks
1 complete roadmap to avoid mistakes and start solving business problems with data science, TODAY.
👉 Here it is for free: https://t.co/YXG4pL97ZN
You can learn a lot about history just by looking at the words we use.
Like algorithm, which is descended from the name of a 9th century Persian polymath called al-Khwarizmi.
So, from romantic to cynical, here are the strange stories behind 12 incredibly normal words...
“Civilizations die from suicide, not by murder,” according to 20th-century historian Arnold Toynbee.
He claimed every great culture collapses internally due to a divergence in values between the ruling class and the common people…🧵
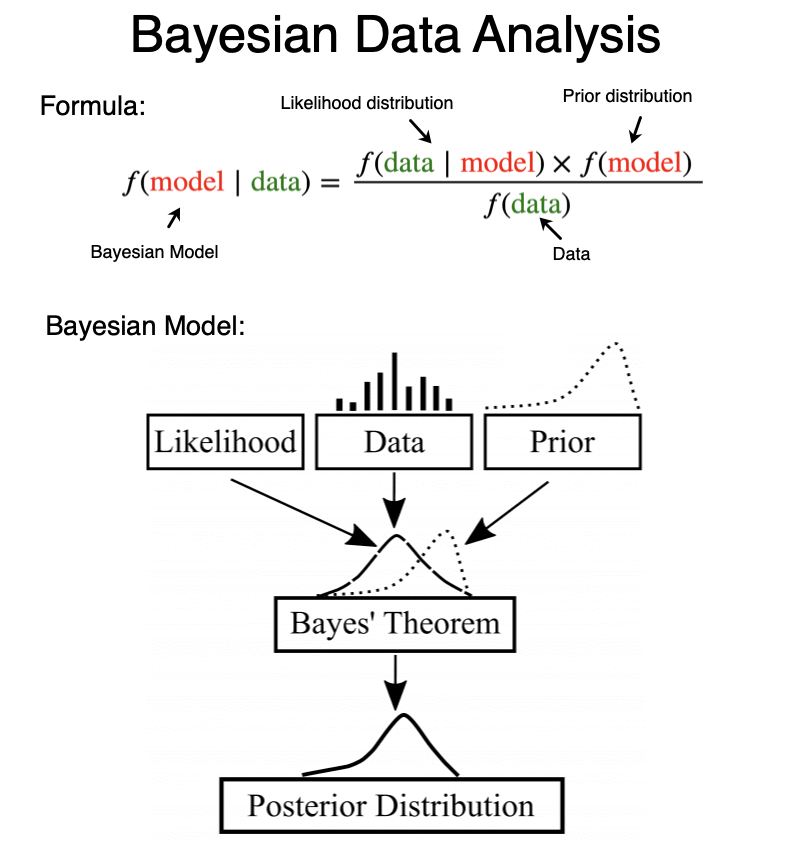
Bayesian data analysis is a fundamental concept in data science. But it took me 2 years to understand its importance.
In 2 minutes, I'll share my best findings over the last 2 years exploring Bayesian Modeling.
Let's go. 🧵
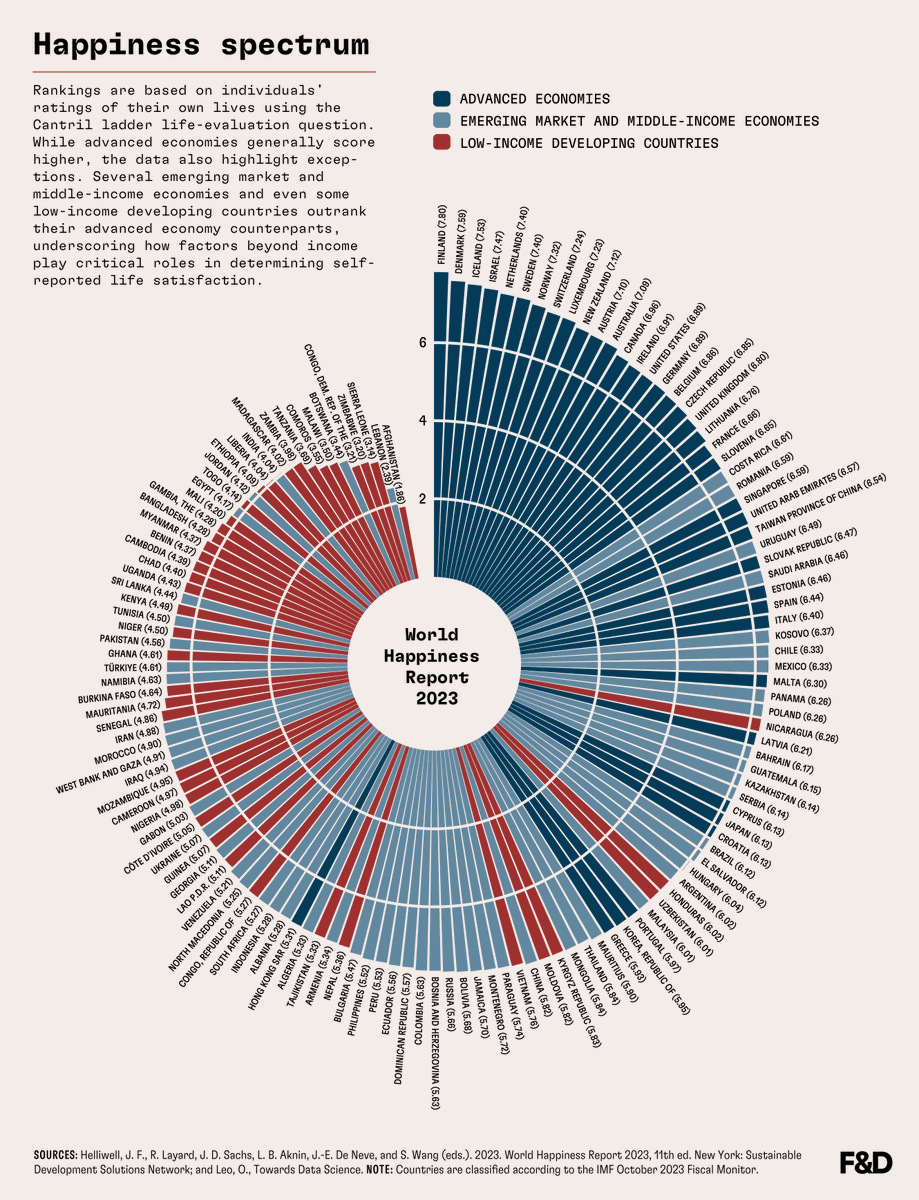
Why do some emerging economies score higher in terms of happiness than some advanced ones? Find out in the latest issue of F&D magazine. https://t.co/Cgt0bHgRTA
On average across OECD countries, women earn 11.6% less than men.
The gender pay gap has decreased over the last two decades but is still present.
On #IWD, learn more on the #OECDGender's work: https://t.co/Tl7kVu5STm | #InvestInWomen
Bayes' Theorem is a fundamental concept in data science. But it took me 2 years to understand its importance. In 2 minutes, I'll share my best findings over the last 2 years exploring Bayesian Statistics. Let's go.
1. Background: "An Essay towards solving a Problem in the Doctrine of Chances," was published in 1763, two years after Bayes' death. In this essay, Bayes addressed the problem of inverse probability, which is the basis of what is now known as Bayesian probability.
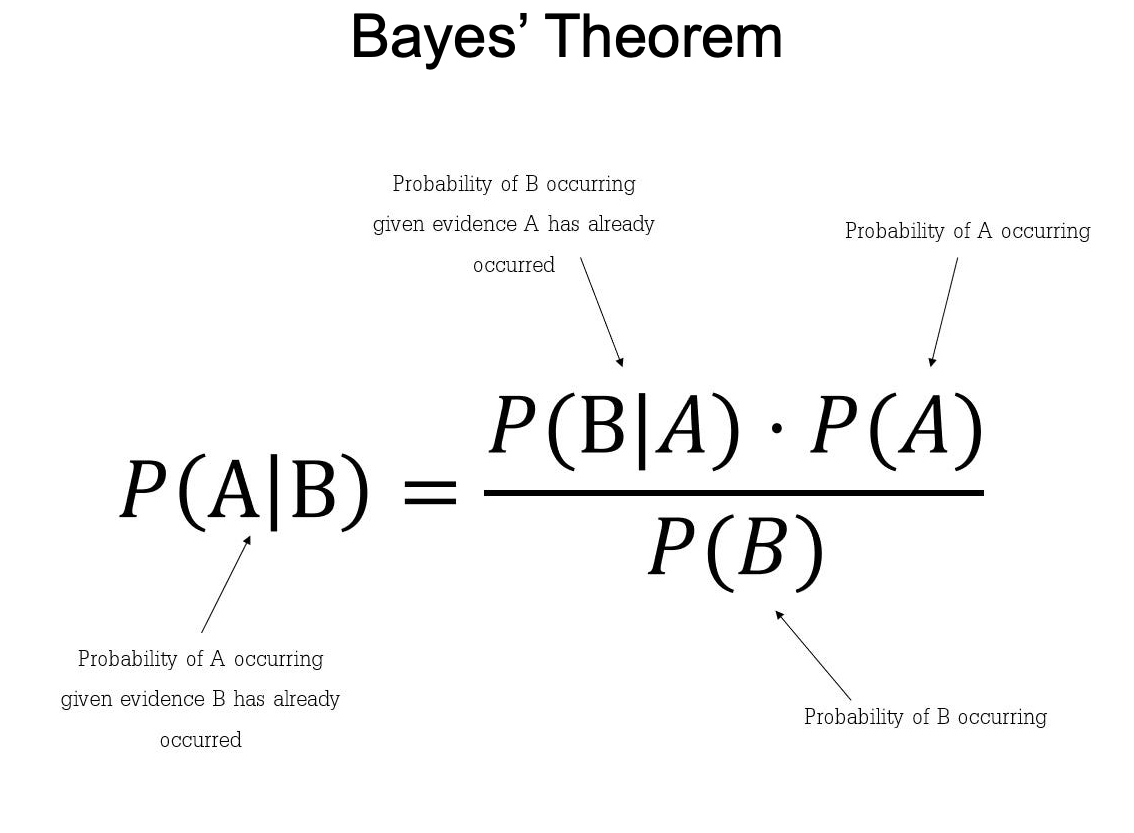
2. Bayes' Theorem: Bayes' Theorem provides a mathematical formula to update the probability for a hypothesis as more evidence or information becomes available. It essentially describes how to revise existing predictions or theories in light of new evidence, a process known as Bayesian inference.
3. Bayesian Statistics: Bayesian Statistics is an approach to statistics that interprets probability as a measure of belief or certainty rather than just a frequency. This belief may be based on prior knowledge of the conditions that might be related to the event or experiment in question. This allows for making probabilistic statements about unknown parameters. For instance, instead of estimating a single value for a parameter, Bayesian statistics provides a distribution of possible values, reflecting the uncertainty.
4. Bayesian vs Frequentist: Bayesian inference is fundamentally about updating beliefs or probabilities as new data is observed, which can be very intuitive and aligns with how we often think about the world. Frequentist statistics interpret probability as the long-run frequency of events. The problem I have with frequentist approaches is that pre-determined distributions are used (e.g. Normal Gaussian), which does not always make sense.
5. Bayesian Machine Learning: Any time true confidence and probabilistic decision making is needed, Bayesian is the answer. Here are a couple of examples. Uncertainty Modeling: Unlike traditional machine learning methods that often provide point estimates, Bayesian methods focus on estimating distributions. Time-Series Analysis: Bayesian methods are particularly useful in time-series analysis, where uncertainty in the future is crucial.
6. Business Context: Businesses can use Bayes' Theorem to assess and quantify various risks, such as market risks, credit risks, or operational risks. By continuously updating the probability of risks as new information emerges, businesses can make more informed decisions.
===
There’s a lot more to learning Data Science for Business. I’d like to help.
I put together a free on-demand workshop that covers the 10 skills that helped me make the transition to Data Scientist: https://t.co/LR39RJ5XKB
And if you'd like to speed it up, I have a live workshop where I'll share how to use ChatGPT for Data Science: https://t.co/EaMpKrJiqX
If you like this post, please reshare ♻️ it so others can get value.