It seems like downward wave reflection might be involved in the transition to NAO+ after this odd SSW. Here are some GFS charts that I think further indicates that this might be the case. Note the downward directed EP-flux in a & eastward phase tilt/vertical wave structure in b-d
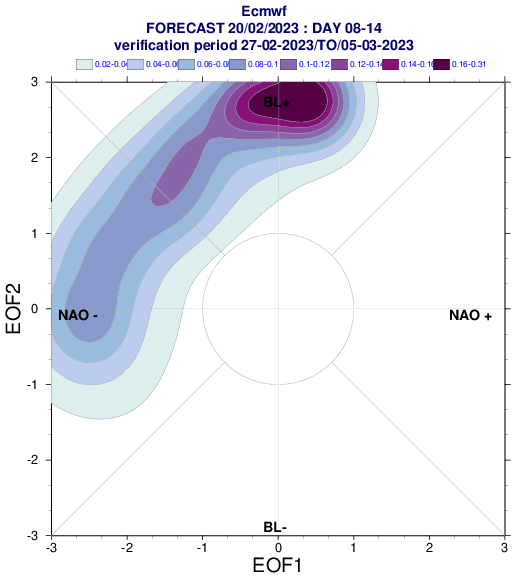
A retrograding Scandi. block that evolves into a Greenland blocking/NAO- pattern now seems increasingly likely in the beginning of March. Still 10-15 days out, but with the SSW and current MJO forcing, the relatively strong signal in both ECMWF and GEFS seems very reasonable.
The trend is clear in both GEFS and the extended ECMWF forecasts. The probability of a major SSW in mid Feb continues to increase and for the first time this season a majority of the members in todays GEFS 00z now goes for a major SSW.
@PGrasics@judah47 Interesting. Not at all an explanation, but this lobe rapidly disappeared above 10 hPa and for that to be possible it has to be warm in this region at 10hPa. Maybe it was like a critical line/max WAF convergence level descending in upper strat. near this region?
@tulirs The plots of refractive index and meridional gradient of QG potential vorticity are unfortunately not yet available on the web page. Hopefully they will be added soon along with new EP-flux charts, but with kids and work it's hard to find the time needed.
Cross sections of v’T’ and z’ for GFS is now added to https://t.co/XLkerwEWOS. In addition to the ordinary 40-80N average, we have also added the ability to look separately at averages for 40-65N and 65-80N. The main reason for this is…
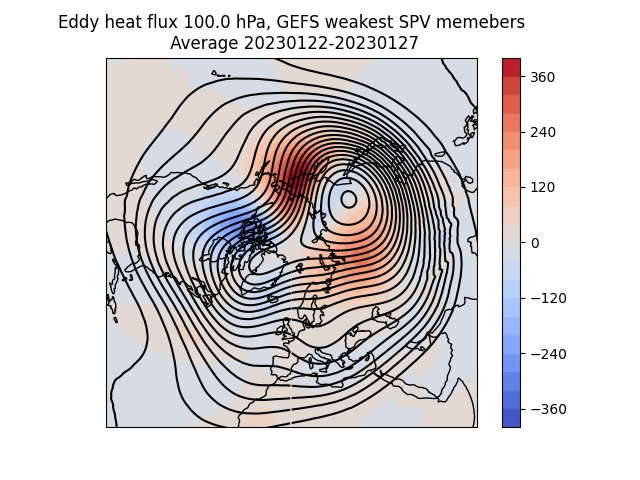
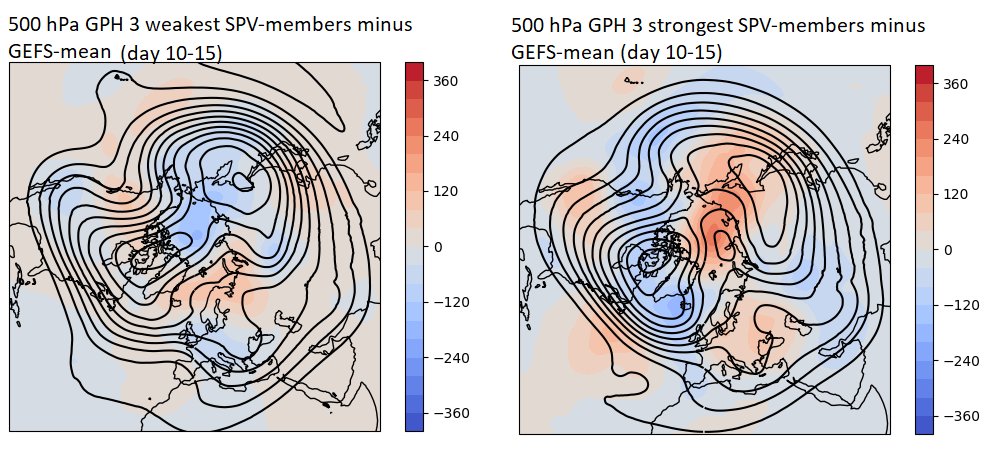
In an another attempt to trace the large uncertainties in the current stratospheric forecasts back to uncertainties in tropospheric forcings I made some new plots comparing GPH at 500hpa and v'T at 100 hPa for the most extreme GEFS00 members(weakst vs strongest SPV)
@nicklouis0301 You are right, there was an a error in the code (no probability calculation, only number of members). Hopefully it is corrected now. Thanks for notice!
The members with the fastest slowdown has lower GPH than GEFS-mean in northeast Asia and the Arctic ocean while the opposite is true for the mean of the 3 members with strongest SPV at 10 hPa (which instead focus the low GPH near Greenland). Big difference in v’T’ at 100 hPa
Some GEFS members now has a rapid slowdown of the zonal mean zonal winds at 10hPa in late Jan, but the spread is large. What is the key features in the tropospheric pattern? I plotted GPH and v’t’ for the 3 members with strongest and 3 weakest SPV at 10 hPa in GEFS:
Despite some indications of downward wave reflection/refraction, much of the WAF in the forecasts is now predicted to be absorbed in the stratosphere with EP-flux convergence, slowdown of the zonal mean zonal wind and a rapid warming.
The figures above is still highly experimental. Also note that the refractive index is not separable such that vertical and meridional wave propagation conditions can be diagnosed separetly, so the interpretation can be difficult.
@JaiHind65 The colors in the 500 hPa chart is the geopotential height anomaly (climatology from ERA5) and the black contours show the climatological wave 1 pattern. I made that image only for this tweet while the other two images are taken from https://t.co/XLkerwEWOS
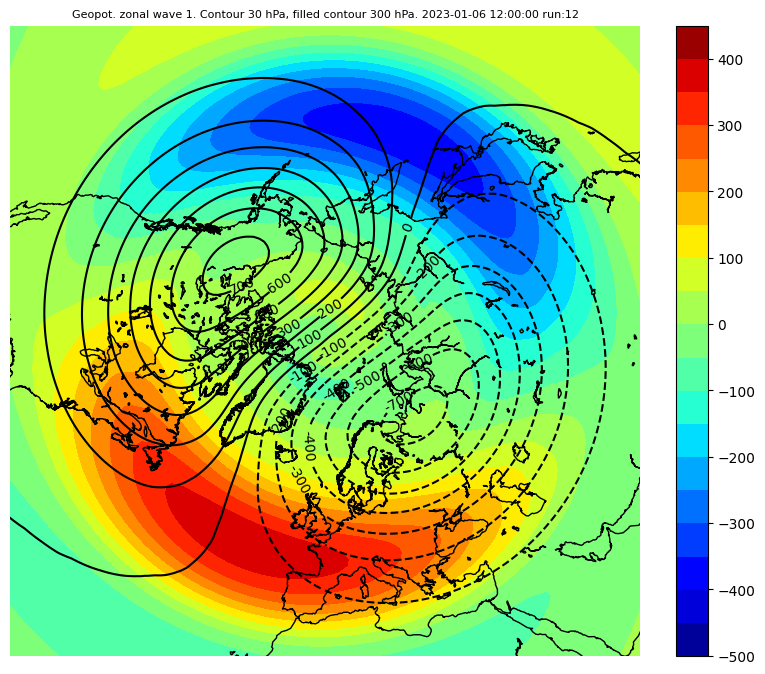
An enhanced wave 1 pattern is forecasted to soon evolve in the troposphere and thus it is not surprising to see an increased vertical WAF into the stratosphere. Strong upper EP-flux convergence is forecasted with a potential to really hurt the SPV.
@SanjibS93606831 The filled contours shows the zonal mean zonal wind, the arrows is EP-flux (upward directed arrows means northward eddy heat flux and upward wave propagation) and the black contours highlights areas with EP-flux convegernce and deceleration of the u-mean due to eddy forcings.