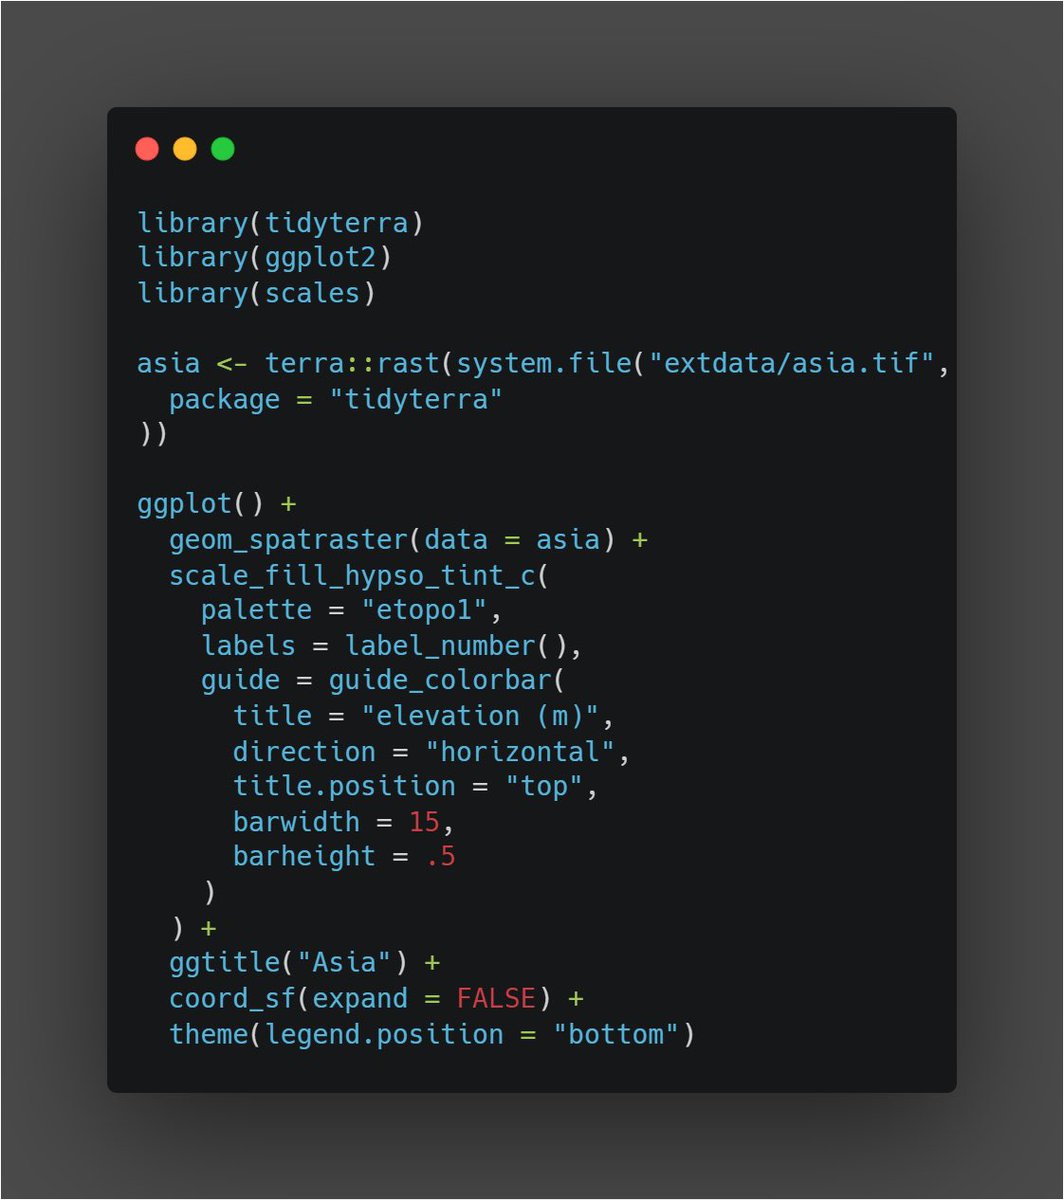
#RStats#rspatial I need your feedback! Developing a new package 📦 {tidyterra} that helps to work and visualize Spat* object using dplyr, ggplot2 and friends. Beta testers needed! https://t.co/i1p5dQJGfh
a simple and random process that creates an intricate and structured fractal pattern. At each step, pick a random edge to form a triangle, and the next point is the center of the triangle.
I am happy to annonce #rstats package {officedown} is now on CRAN. You can get officer features into #rmarkdown documents, like sections, real Word references, TOC, list of figures, list of tables and many other things. See https://t.co/Wf38itRcAv
Want to build a beautiful CV with {RMarkdown}, and data? I made a 📦: {datadrivencv} to make this easier. One {usethis} style call and you have everything needed to build your CV in HTML and PDF format. Try it out!
https://t.co/AYtKxHGuEX #RStats#DataScience
New data! “Satellite-based remote sensing data set of global surface water storage change from 1992 to 2018”, presenting a global time series of surface water storage variations for 347 lakes/reservoirs🛰🌊🗺📖 read/download at 👉🏽https://t.co/IpcXOMUZI5 @ESSD_journal#openaccess
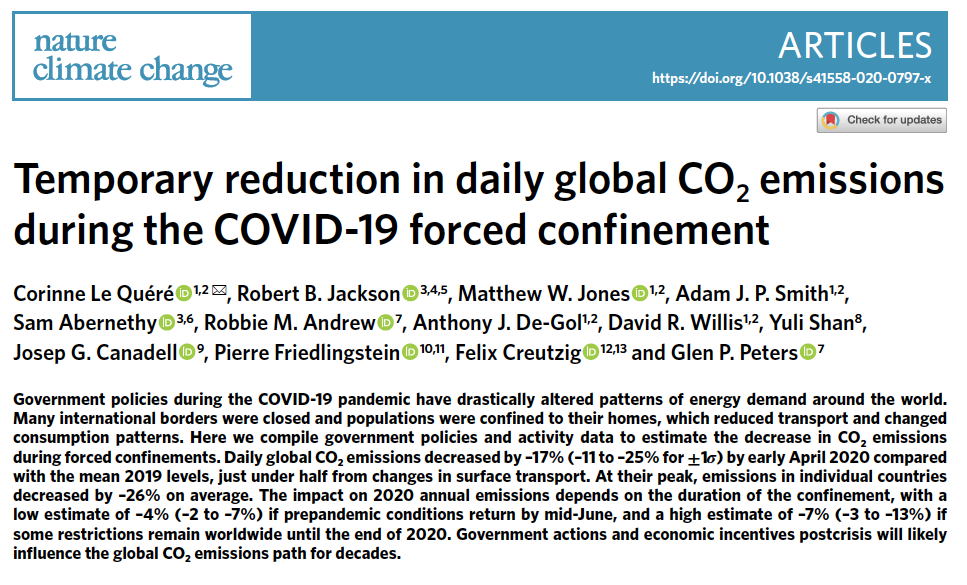
It was on 27 Feb, before the #COVID19 pandemic started, that @borenbears asked the first question: would the impending coronavirus pandemic change or reduce global GHG emissions?
Yes. Massively. Temporarily.
https://t.co/lubG5WYQlD @gcarbonproject@Peters_Glen@royalsociety
1/
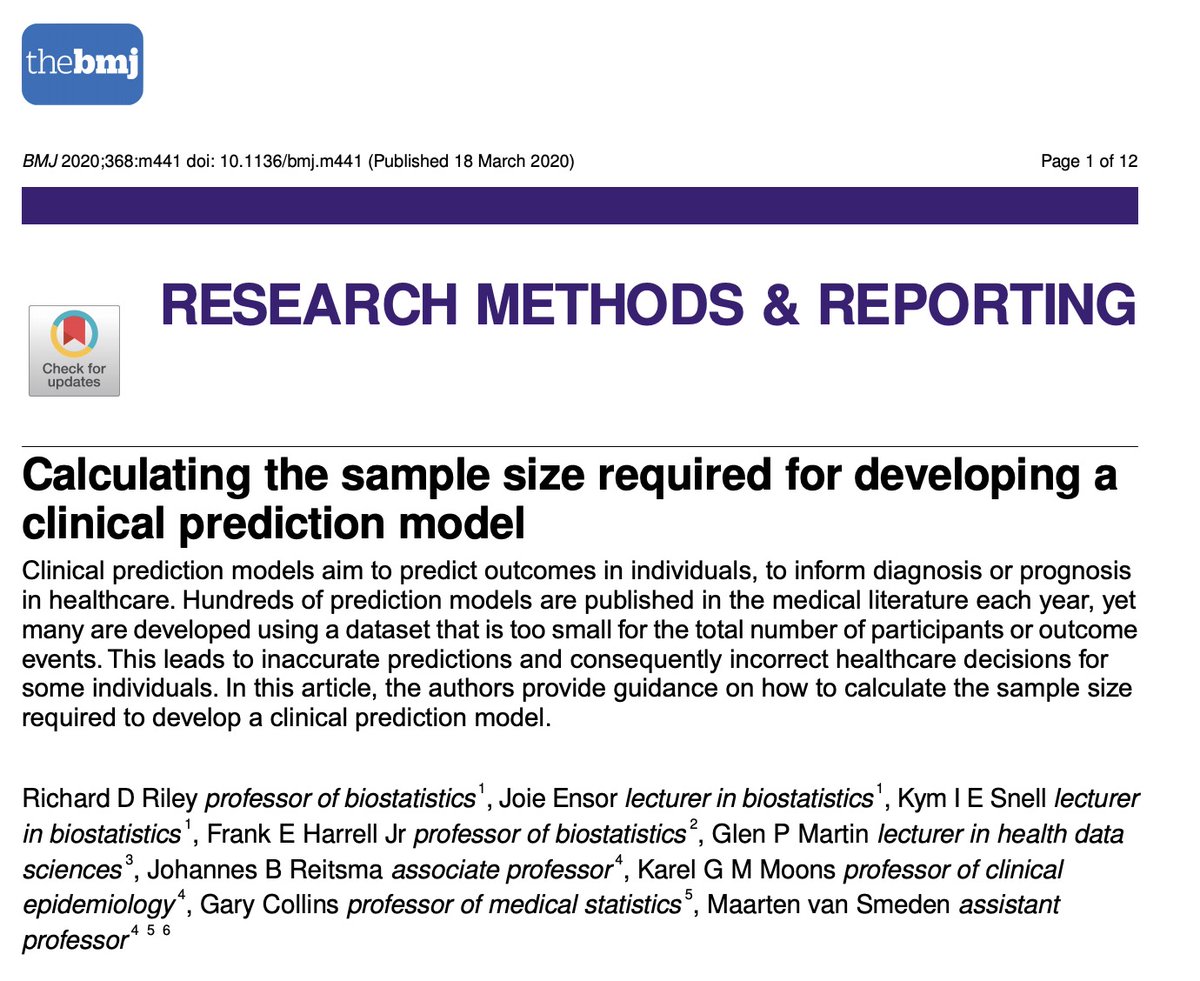
Need help with calculating sample size for your #covid19 prediction model study? Follow our guidance (https://t.co/Bkpgeti9tp, https://t.co/QFPcSHeO36) summarised here (https://t.co/3ElZ2OFyjh). R code is here (https://t.co/MG9ZiBQxT8), & in Stata (‘ssc install pmsampsize')
Check out Pose Animator - a web animation tool that brings SVG illustrations to life with real time human perception TF.js models.
Play with demos:
https://t.co/tVdPjQEci1
Github repo and tech design documentation:
https://t.co/msrQqYdXTz
#MadeWithTFJS#TensorFlow#PaperJS
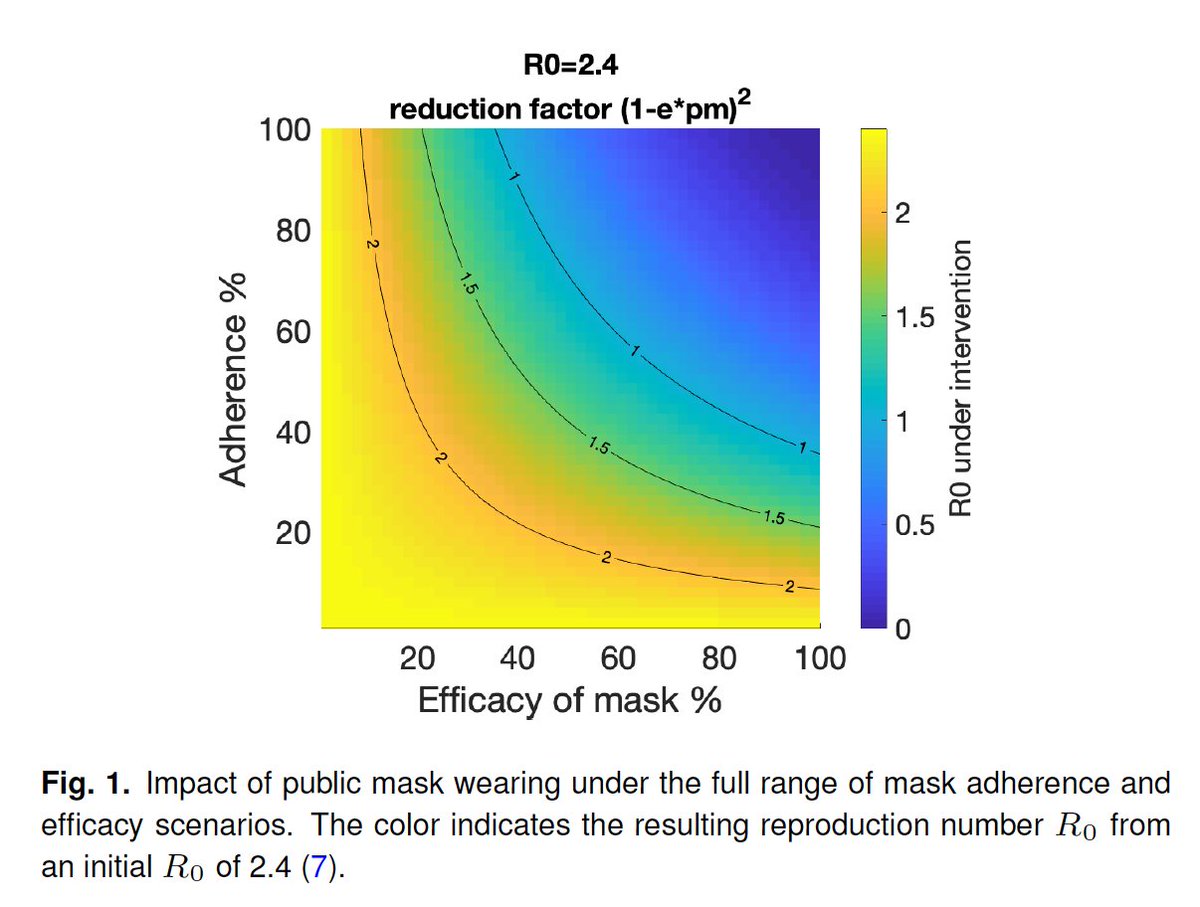
The rationale and evidence for #Masks4All in public is quite compelling, reviewed here by @jeremyphoward and colleagues, and the @WHO would be well advised to read it
https://t.co/TPucU78uNf
Soudzilovskaia et al. FungalRoot: global database of plant mycorrhizal associations! Out today in @NewPhyt. We've needed this for a long time.
https://t.co/6uODWb33U8
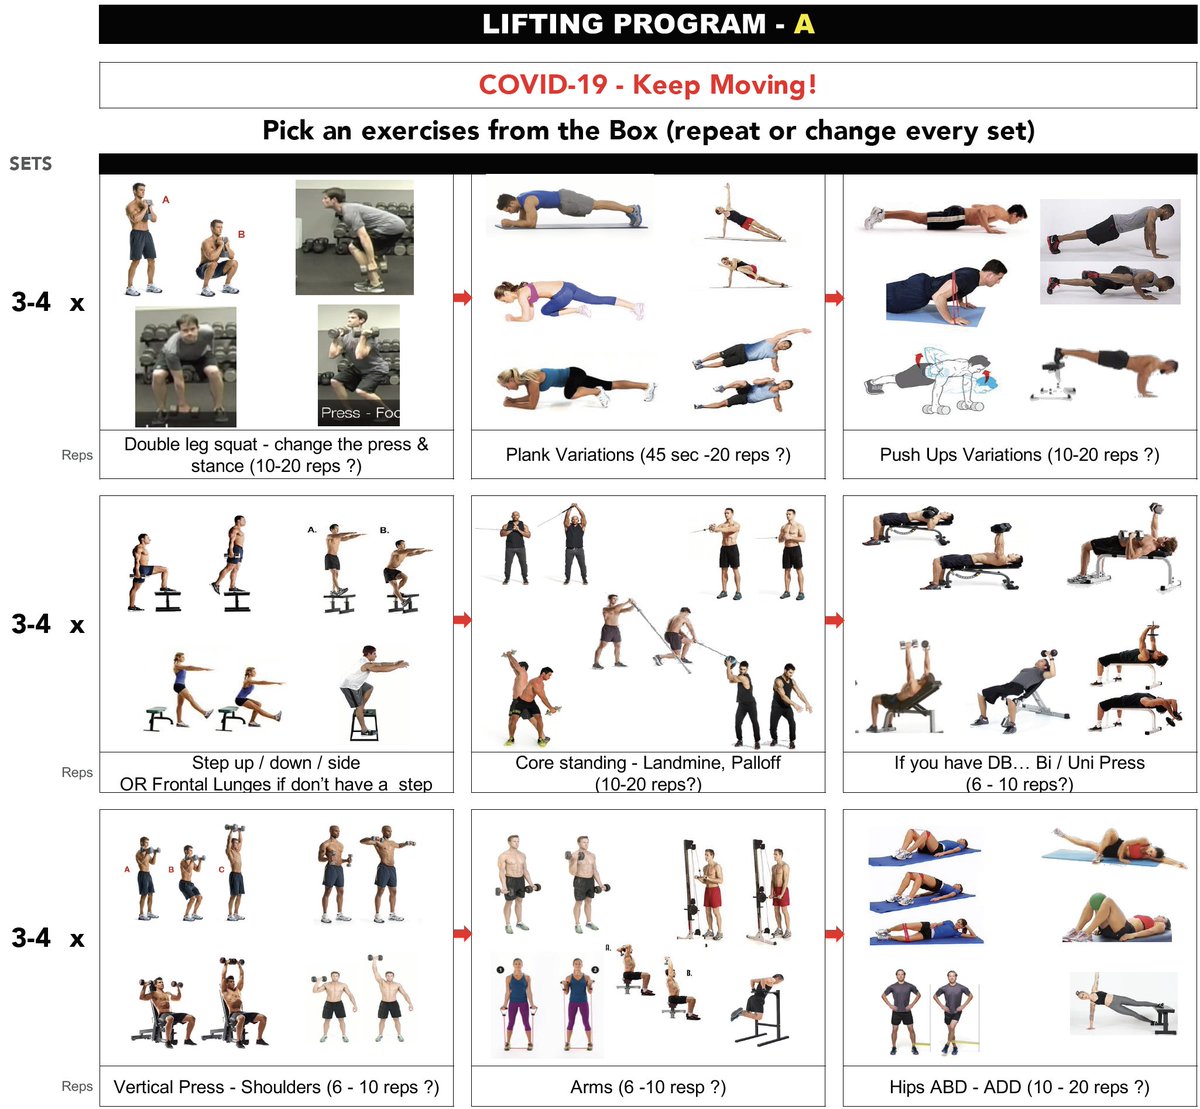
'COVID-19 - Keep Moving!' Program
Starting Week-3 ▶️ Phase 2:
📍4-to-6 days a week
📍Program A and B (alternative days)
📍3 circuits ✖️ 3-4 sets ✖️2-3 exercises
✅Adapt it to your level and equipment
✅There are myriad varieties of exercises, these are just a few examples
For many times, we are not just aligning plot as what cowplot and patchwork did. We would like to align associated information that requires axis to be exactly match in subplots. Here is my answer to this question, https://t.co/SMUbv25SBq
#ggplot2#rstats
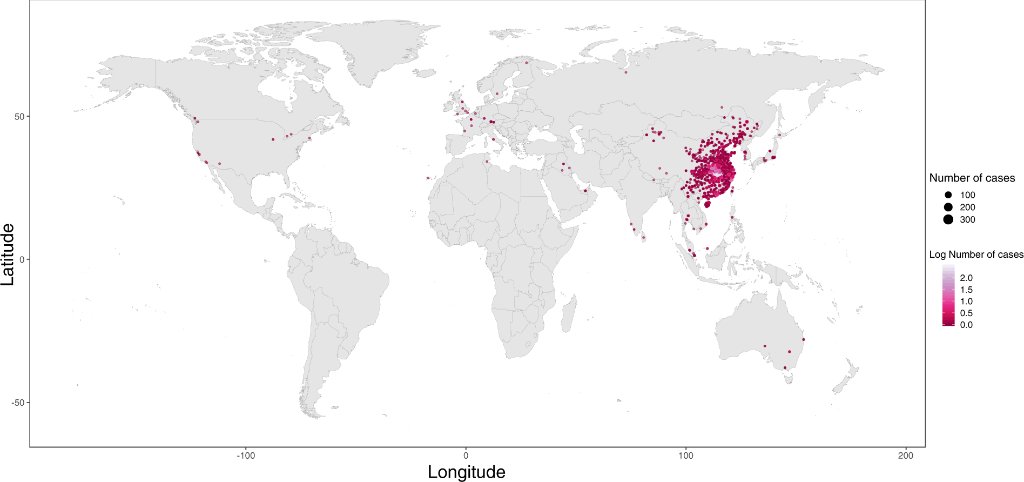
Congratulations to all the authors, including @IHME_UW's David Pigott, Erin Hulland, & Julia Morgan, on the publication of their study, "Epidemiological data from the COVID-19 outbreak, real-time case information." Read the full study in @ScientificData: https://t.co/4JkHw0aYHp
This is the next version of the library previously known as “stanfordnlp” https://t.co/p6MhHyHLC2. We decided that name was just too ambiguous/confusing, especially when speaking! Great work by @yuhaozhangx, @qi2peng2, @Zhang_Yu_hui, and Jason Bolton.
The book "Epidemics: Models and Data Using R" is an accessible intro to epidemiological models in #rstats by @BjornstadOttar
(Note that the simplest model considered is the deterministic SIR model - no naive exponential or even logistic models 🤔)
#epitwitter#ecology