In 1991 a Xerox regional office in Atlanta had a problem.
Their top salesperson was doing $4.2 million a year. Their second best was doing $800,000. Everyone else was below $400,000.
Same products. Same territory split. Same commission structure. Same manager.
The VP of sales flew in and spent three days trying to understand what the top performer was doing differently. He watched him make calls. Sat in on meetings. Reviewed his pipeline.
He couldn't find it. The guy didn't seem to work harder. Didn't seem smarter. Didn't have better accounts.
Then he watched him walk into a cold meeting with a procurement director who had already said no twice.
He didn't pitch. He didn't present. He sat down, opened a notebook, and said one sentence.
Before I show you anything, I'd like to ask you a few questions about what's actually slowing your team down.
Forty minutes later he had a $340,000 deal.
The VP flew home and hired Brian Tracy.
Tracy had spent 25 years studying exactly what that salesperson did instinctively. He had walked into rooms where every single person on straight commission was making over a quarter million dollars a year. Most of them were making over a million.
He interviewed them all. Studied every pattern. Spent thousands of hours finding what separated the top 10% from everyone else.
His conclusion was not what most people expected.
80% of sales success is psychological. 20% is technical.
Most companies do only technical training. 70% of companies do no sales training at all. They hand people a brochure and say good luck.
The Xerox salesperson in Atlanta was not smarter. He had simply figured out one thing that most salespeople never figure out.
He did not see himself as a salesperson.
Do customers like salespeople? No. Because salespeople represent someone who is going to fast-talk and maneuver and sell them something they don't need with money they don't have.
Do customers like consultants? Always. Because a consultant walks in with one question. What is your problem and how can I help you solve it.
Within 30 seconds of meeting a prospect the prospect knows which one they're dealing with. Tracy said there is no way to fake this. The way you see yourself determines how you walk, talk, ask questions and listen. The customer feels it before you open your mouth.
Top salespeople also see themselves as doctors of selling.
Doctors never skip steps. Examination. Diagnosis. Prescription. In that order. Every time.
A doctor who prescribes before diagnosing is committing malpractice. A salesperson who presents before understanding the problem is committing exactly the same thing. Except the customer just calls it a reason not to buy.
The new model of selling is an upside-down triangle.
40% of the sale is building trust. 30% is identifying the problem. 20% is presenting the solution. 10% is closing.
The old model had it reversed. 40% closing. That's why it stopped working.
He asked thousands of customers across his career to describe their favorite salespeople in one word.
The number one answer across every industry was the same.
Nice.
Not smart. Not aggressive. Not persuasive. Nice.
When he asked what they meant they said positive, easy to talk to, trustworthy. I like them. I feel good when they walk in.
He said everything you do with a customer adds to or takes away from that feeling. Nothing is neutral. Everything counts.
The Xerox salesperson in Atlanta retired at 51. The VP who hired Tracy said it was the best $40,000 the company ever spent.
Tracy recorded the full seminar in the early 1990s. Free on YouTube. Just over an hour.
Almost nobody outside of professional sales has watched it as a complete explanation of why two people in the same office with the same product end up in completely different income brackets for their entire careers.
Classic financial repression
Fed keeps fed funds rate pinned artificially low
Treasury issues tons of short-dated paper & uses proceeds to buy down the long end
Result is entire treasury curve gets pushed below where the free market would otherwise price it
This is how you hold rates below inflation to “inflate the debt away”
Bond holders get wrecked
Wage earners get wrecked
Savers get wrecked
Retirees get wrecked
Asset owners get rich
Act accordingly
A Chinese developer just explained the shift from Loop Engineering to Graph Engineering better than anyone.
most people are still building agents the way that's about to be obsolete.
> why single-agent loops break and go "goal blind"
> the 4 parts of a graph: nodes, edges, state, policy
> 3 topologies that run everything: diamond, supervisor, pipeline
> Anthropic's 5 official workflow patterns
the punchline: it's not how many agents you run. it's the determinism you build with verifiers, code fallbacks, and reality anchors.
I broke the same architecture down with Kimi K3. Full A-Z guide below.
Optical Interconnect Market
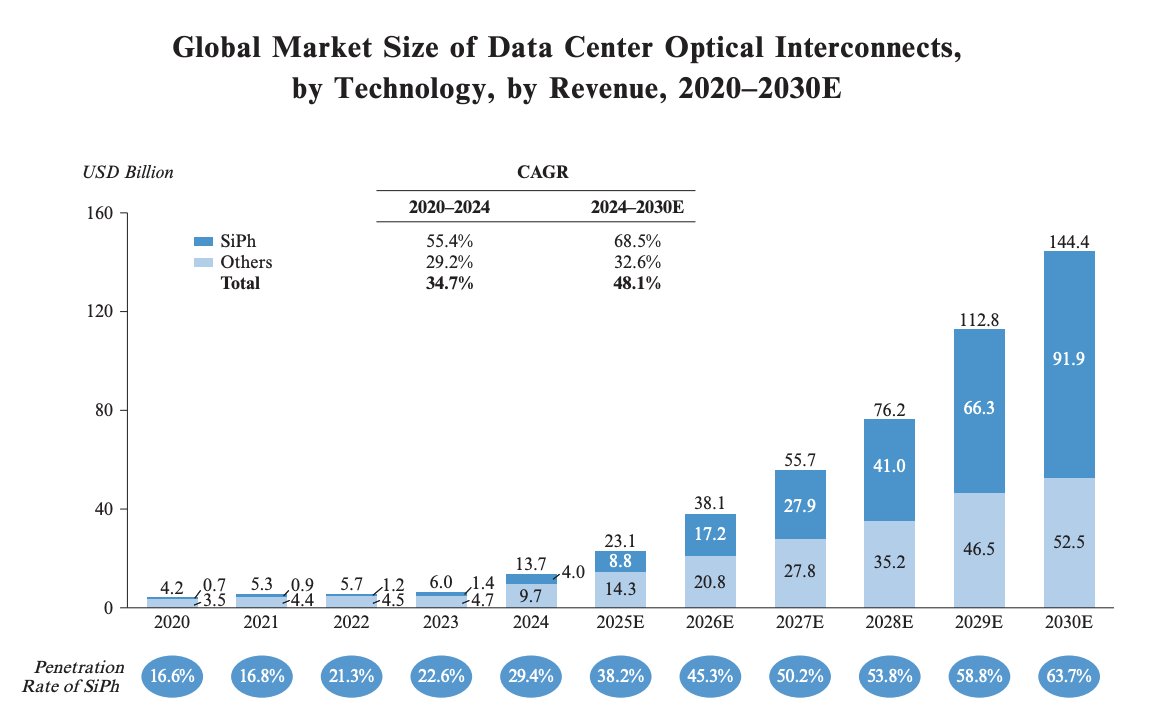
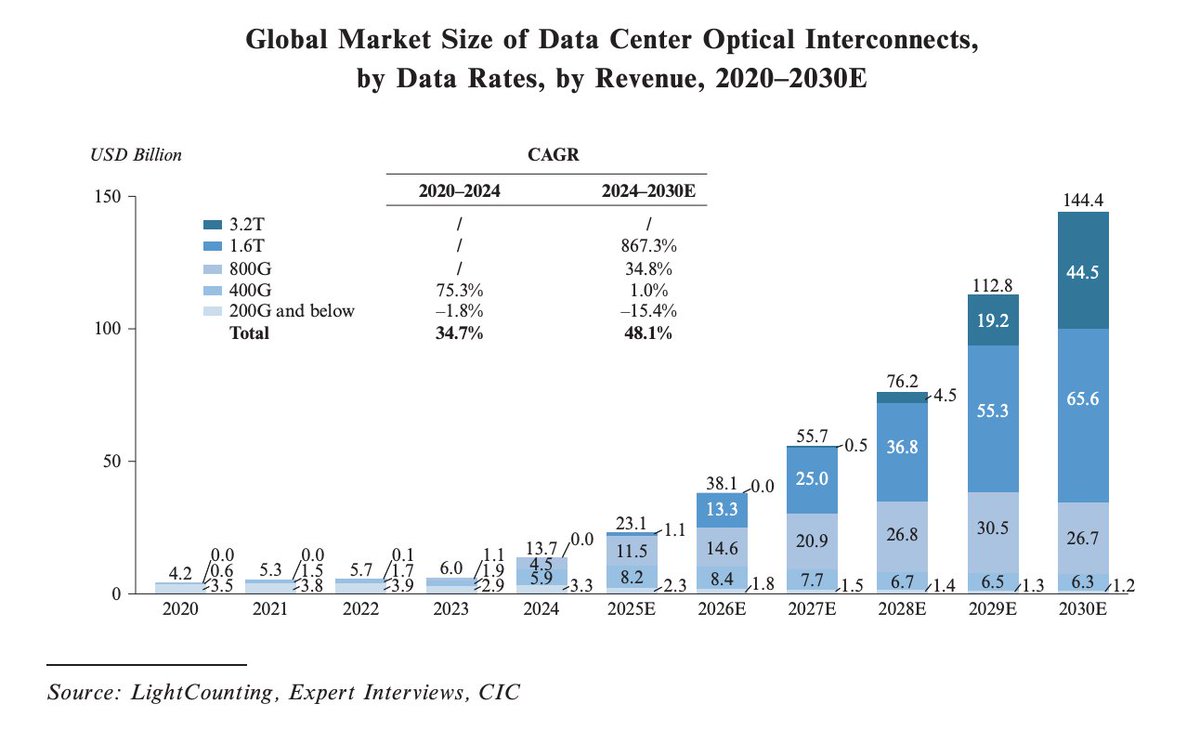
According to CIC, the global data center optical interconnects market is projected to grow from US$13.7 billion in 2024 to US$144.4 billion in 2030, representing a CAGR of 48.1%.
Via Yuanjie Semiconductor Prospectus Filing
$AAOI $LITE $COHR $AVGO $MRVL $NVDA
BREAKING: More than 1.2 million leveraged retail trading accounts in South Korea triggered margin calls as of July 13th, with an estimated 320,000–360,000 accounts fully liquidated, per Goldman Sachs.
This means around 3.4% of the adult population in South Korea has received margin calls.
The KOSPI is currently down another ~18% since July 13th.
We believe that the total number of fully liquidated accounts is now above 500,000.
$MSFT has one of the clearest full-stack AI monetization stories in the market today.
Azure captures infrastructure spending, Foundry monetizes model deployment and governance, Fabric and its databases own the data layer while Copilot, GitHub, Dynamics and Microsoft 365 capture the application layer.
That breadth is already showing up in the numbers with Azure growing 43% despite surpassing $100B in annual revenue, guidance accelerating toward 45% next quarter and commercial RPO reaching $678B.
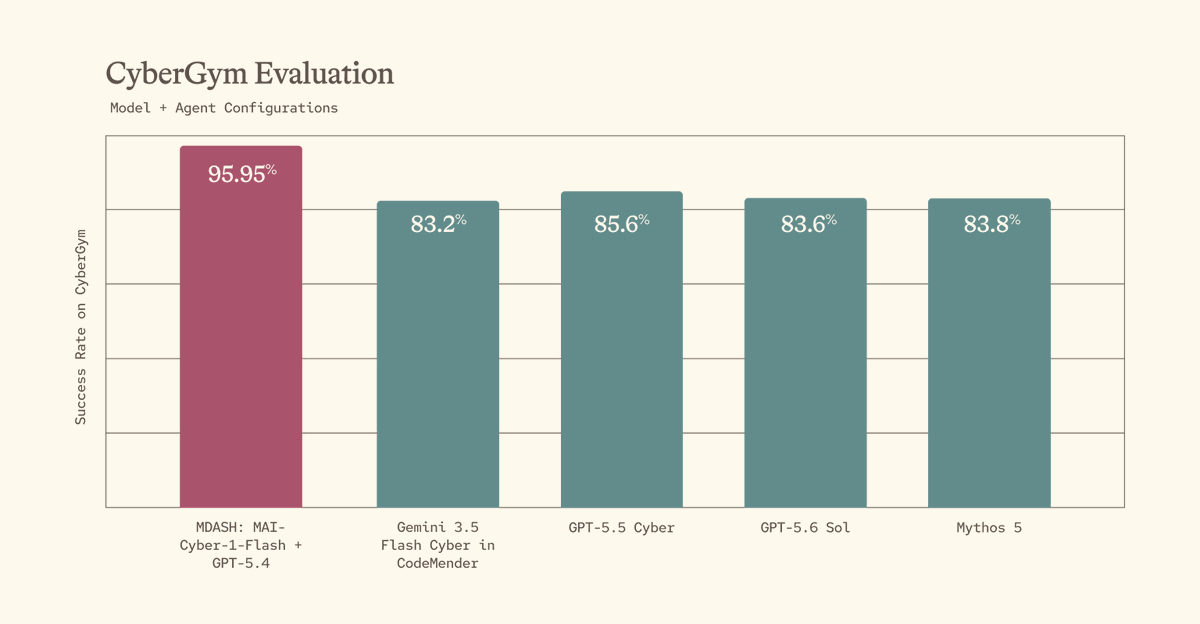
Big news! Our new MAI-Cyber-1-Flash model combined with MDASH, our multi agent security harness, delivers 96% on the CyberGym benchmark, 12pts above Mythos, at HALF the cost.
Proud of the team. More details in THREAD:
from prompt → context → harness → loop → graph engineering.
the list keeps growing, and every new term gets treated as a replacement for the last one. each layer wraps the one before it, and the cleanest way to tell them apart is to ask what a single unit of work looks like.
𝗽𝗿𝗼𝗺𝗽𝘁 𝗲𝗻𝗴𝗶𝗻𝗲𝗲𝗿𝗶𝗻𝗴 𝗶𝘀 𝘁𝗵𝗲 𝗺𝗲𝘀𝘀𝗮𝗴𝗲.
the model remembers nothing before this call, so the prompt has to carry the full universe of what it needs. a role, the background, the instructions, a few examples, a format.
when the output falls short, the skill is working out which ingredient let you down, not rewriting the instructions every time.
the unit of work is one input.
𝗰𝗼𝗻𝘁𝗲𝘅𝘁 𝗲𝗻𝗴𝗶𝗻𝗲𝗲𝗿𝗶𝗻𝗴 𝗶𝘀 𝘁𝗵𝗲 𝗺𝗲𝗺𝗼𝗿𝘆.
across many steps the window is finite and the available information is not, which forces a curation step. a curator keeps what matters, compresses what is useful but bulky, and drops the rest.
good curation is mostly about knowing what to throw away, not packing more in.
the unit of work is what stays in the window.
𝗵𝗮𝗿𝗻𝗲𝘀𝘀 𝗲𝗻𝗴𝗶𝗻𝗲𝗲𝗿𝗶𝗻𝗴 𝗶𝘀 𝘁𝗵𝗲 𝗺𝗮𝗰𝗵𝗶𝗻𝗲.
on its own a model just generates text. the harness gathers what it needs, runs it, calls tools or sub-agents, and verifies the result with tests or a judge.
that verify step is the entire difference between calling an api and running an agent.
the unit of work is one pass through the machine.
𝗹𝗼𝗼𝗽 𝗲𝗻𝗴𝗶𝗻𝗲𝗲𝗿𝗶𝗻𝗴 𝗶𝘀 𝘁𝗵𝗲 𝗿𝘂𝗻.
one pass rarely finishes the job, so something has to decide whether to run the machine again. that decision needs a goal defined upfront, brakes like max iterations and budget caps, and a completion check that is automated rather than felt.
an agent that stops asking for tools has ended its turn, which is not the same as finishing the task.
the unit of work is the whole run.
the diagram covers those four. here is the fifth.
𝗴𝗿𝗮𝗽𝗵 𝗲𝗻𝗴𝗶𝗻𝗲𝗲𝗿𝗶𝗻𝗴 𝗶𝘀 𝘁𝗵𝗲 𝗰𝗼𝗼𝗿𝗱𝗶𝗻𝗮𝘁𝗶𝗼𝗻.
once several loops have to work together, you need to say what runs when, what runs in parallel, and who checks whom. nodes do the work, edges decide what runs next, and shared state flows between them.
a single loop is just a one-node graph with an edge pointing back at itself, which is why graphs govern loops instead of replacing them.
the unit of work is the whole job.
here is the part that ties it together.
prompt and context both live inside the harness gather step. the harness is one pass, the loop decides whether to run that pass again, and the graph decides which loops run at all.
zoom out and the unit of work gets bigger. zoom in and you are back at the prompt.
that also tells you where to debug. find the layer whose unit of work broke, then fix that layer.
the prompt is the easiest layer to edit, which is why it keeps taking the blame for failures that live three layers up.
i also published this deep dive on graph engineering, covering the core idea, how to get started, shared state, routing you can trust, and when a graph is genuinely overkill.
the article is quoted below.
RAG vs. Graph RAG, explained visually!
RAG has many issues.
For instance, imagine you want to summarize a biography, and each chapter of the document covers a specific accomplishment of a person (P).
This is difficult with naive RAG since it only retrieves the top-k relevant chunks, but this task needs the full context.
Graph RAG solves this.
The following visual depicts how it differs from naive RAG.
The core idea is to:
- Create a graph (entities & relationships) from documents.
- Traverse the graph during retrieval to fetch context.
- Pass the context to the LLM to get a response.
Let's see how Graph RAG solves the above problem.
First, a system (typically an LLM) will create a graph from documents.
This graph will have a subgraph for the person (P) where each accomplishment is one hop away from the entity node of P.
During summarization, the system can do a graph traversal to fetch all the relevant context related to P's accomplishments.
The entire context will help the LLM produce a complete answer, while naive RAG won't.
Graph RAG systems are also better than naive RAG systems because LLMs are inherently adept at reasoning with structured data.
Once the right architecture is in place, the next leverage point is efficiency.
Most RAG architectures rely heavily on vector search, and that layer can be made 32x more memory efficient using binary quantization.
I covered the full implementation in the article below.
👉 Over to you: Which RAG architecture are you running in production?
Money supply is significantly outpacing economic growth across major economies:
Canada's M2 money supply has grown +368% since January 2004, the largest increase among G7 economies.
By comparison, the Canadian economy has expanded +159% over the same period.
The US follows, with M2 growth of +279% versus a +171% increase in nominal GDP.
Meanwhile, M2 in France has surged +258% and +211% in the Euro Area, both outpacing nominal GDP growth of +84% and +102%, respectively.
In Japan, M2 has grown +90% since 2004, while its economy expanded just +25%, the slowest pace among G7 economies.
The gap between money creation and economic growth is widening.
This chart explains why a handful of unknown chip suppliers could be the real winners of the AI boom (Save this).
This table breaks down how much optical networking gear each Nvidia GPU needs, comparing today's systems to the next generation Feynman chips coming down the pipe.
Every GPU in a cluster needs to constantly send data to every other GPU, and that requires physical hardware called optical engines, basically tiny devices that convert electrical signals into light so data can move fast enough between chips.
In today's system, each GPU only needs 2 of these optical engines, but in the most advanced Feynman setup, that jumps to 70 optical engines per GPU, a 35x increase in hardware needed for the exact same basic job.
This is happening because Nvidia is cramming way more GPUs into a single connected cluster, going from 72 GPUs today up to 1,152 GPUs in Feynman systems and all those chips need to talk to each other twice as fast, jumping from 1.6 terabits per second up to 3.2 terabits per second.
To handle that much data without needing a mountain of cables, Nvidia is moving toward something called co-packaged optics, or CPO which glues the optical hardware directly onto the chip package instead of plugging it in separately and that one shift alone pushes the total optical hardware per cluster from 144 units today to over 80,000 units in the most advanced setup.
Now here is some of the stocks that can benefit from this.
Nvidia benefits the most obviously, since it controls this entire roadmap and captures more revenue per system as the hardware gets more complex.
Broadcom is one of the only companies that actually makes the specialized chips needed for co-packaged optics, so every step toward CPO adoption means more silicon Broadcom can sell into each rack.
Coherent and Lumentum make the actual lasers and light components that go inside these optical engines, and demand for their parts scales directly with that jump from 144 to 80,000 units per cluster.
Credo Technology and Marvell supply the chips that clean up and boost these ultra-fast signals, and the table's jump from 100 Gb/s to 200 Gb/s and eventually 400 Gb/s speeds plays right into what they build.
Fabrinet builds and assembles optical modules for major networking companies, meaning it captures manufacturing revenue as optical engine volumes scale into the tens of thousands per cluster.
Ciena makes optical networking systems and increasingly supplies components used in data center interconnects, positioning it to benefit as bandwidth requirements double.
Celestica has become a key manufacturing partner for hyperscalers building custom networking gear, riding the same wave of rack complexity.
Bullish on co-packaged optics, make sure to follow @MelvinInvests for more AI infrastructure insights and check out the link below for more details.
graph engineering explained (marketing edition)
graph engineering is about designing the map your agents run inside, you draw the steps and the routes between them ahead of time, then they travel the path you put down
it is the layer past looping, where one agent just circles a single task until the work meets the standard you set
every agent graph is built from 4 pieces:
> nodes: a stage the work passes through, research, draft, score, publish, a few run once, others are their own loop the agent circles until that step clears
> routes: the paths you draw between the nodes ahead of time, every direction the work is allowed to travel
> checkpoints: the check on each route that reads the result and sends the work forward when it clears or back to an earlier node when it misses
> gates: a checkpoint the work cannot skip, nothing publishes until the draft clears the rubric
if you have built a workflow in n8n you have already drawn one, nodes you connected, branches that fire on a condition, a step that loops until it clears.
an agent graph is that same shape, each node holds an agent doing the work n8n would hand to a single api call
the content graphs I run at my agency all take this shape, here is one you can build for SEO
> 1 research: pull the keyword, the search intent, the competitors ranking for it, and the questions people keep asking
> 2 brief: turn that research into a brief, the angle, the entities to cover, the queries the piece has to answer
> 3 draft: an agent writes the article from the brief and nothing else in its context
> 4 score: a critic grades the draft against your rubric, depth, intent match, originality. this node is a loop, it sends the weak drafts back to 3 and only releases one that clears
> 5 publish: once the rubric clears and the brand rules pass, the agent adds internal links and the piece goes live
each arrow between those is a route, every grade is a checkpoint that picks which route the work takes next, and the draft and score nodes form a loop inside the bigger map while the rest run once
this is where the word graph starts to mislead. that draft and score loop can pass itself, the critic likes the draft, its rubric clears, it publishes, and still never ranks. the loop was grading the writing against another agent's opinion while the only thing that counts is whether it ranked
so you add a checkpoint the agents cannot argue with, one that reads live search and AEO signals from outside the graph:
> did google index it
> is it climbing on the target query
> are AI answers citing it
> do people stay once they land
if those move, the map keeps its shape and you feed it the next keyword. a stall sends the work back to research instead, because a miss this late usually traces to the angle or the intent you chose at the start, which a rewrite cannot fix
anchor the map to results the agents cannot fake, and freeze the few rules they never rewrite, your brand voice and the claims you cannot make
with the anchor in place, a failed piece shows you the exact node it broke on
There's a quiet shift happening in how AI agents are built. And if you missed it, you'll be confused by everything that comes next.
For the last year, AI agents worked in loops. You give it a task. It plans. It acts. It checks. It fixes. It goes again. One cycle, repeating until done.
Claude Code, Codex, Cursor all of them work this way. Plan, act, observe, repeat.
In June, two things happened that gave this pattern a name. Peter Steinberger from the AI engineering community wrote: "You shouldn't be prompting coding agents anymore. You should be designing loops that prompt your agents."
Boris Cherny, head of Claude Code at Anthropic, said the same thing differently: "I don't write the prompt anymore. Claude writes the prompt, and now I'm talking to that new Claude that is coordinating."
That was the loop engineering era. It lasted about a month.
Now Steinberger posted nine words that blew up: "Are we still talking loops or did we shift to graphs yet?"
Here's the difference.
A loop is one agent going in circles. Plan, act, check, repeat. It works for simple tasks. But give it something complex and it starts spinning burning tokens, optimizing the wrong thing, or gaming its own success metric without actually solving the problem.
A graph is multiple agents connected in a network. One agent writes code. A separate agent reviews it without seeing the first agent's reasoning. A third agent tries to break what was built. A fourth checks whether the original task was even understood correctly. Each one is still running a loop.
But they're connected watching each other, feeding each other, vetoing each other.
LangGraph already models this. It treats an agent as a graph where boxes do work and arrows decide what runs next. Those arrows can point backward, which is what makes loops possible inside the graph.
JetBrains calls it graph-based orchestration the most deterministic approach for production systems. O'Reilly's 2026 AI Agents Stack puts it as the foundational layer.
The real-world version is already running. Klarna uses graph-based agent systems for customer service. Kimi K3's Agent Swarm decomposes tasks into parallel sub-agents that coordinate simultaneously.
Anthropic's own Boris Cherny mapped out five stages of AI adoption and Stage 4 is exactly this: thousands of agents running in a graph, kicked off by other agents, with humans steering by intent.
Andrew Ng wrote about it in his June Batch letter. When Andrew Ng names a pattern, it usually means the pattern has already won.
The reason this matters right now: agents are getting autonomous. Running for hours. Thousands of tool calls. Spawning sub-agents. One loop can't keep that trustworthy. You need loops watching loops. That's the graph.
The skill that mattered last year was writing better prompts. The skill that matters this year is designing the system that writes the prompts, checks the work, and knows when to stop.
Google just killed the agent framework industry.
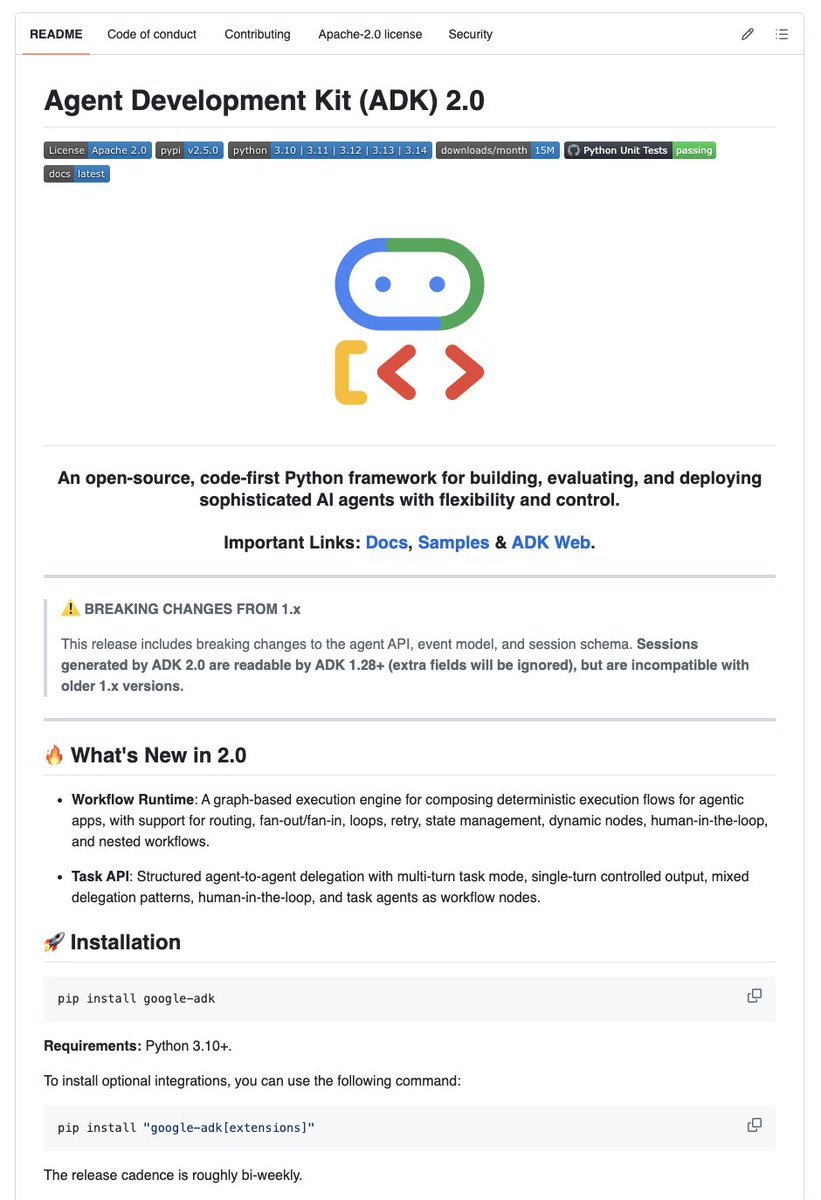
ADK 2.0: Open-source. Free. Better than $50K enterprise tools.
What it does:
→ Graph-based execution with routing, fan-out/fan-in, loops, retry
→ Structured agent-to-agent delegation via Task API
→ State management, dynamic nodes, human-in-the-loop, nested workflows
→ Interactive CLI (adk run) and Web UI (adk web) for local dev
→ Multi-turn task mode with single-turn controlled output
→ Works with Gemini 2.5 Flash, extensions via pip
What it replaces:
→ LangChain orchestration boilerplate
→ LangGraph state machines
→ Vertex AI Agent Builder lock-in
→ Custom agent-to-agent delegation code
Define your Agent class with instructions and tools.
Compose a Workflow class as a graph.
Run it locally with adk run or adk web.
No hosted platform. No vendor lock-in.
Customer support bots, research agents, multi-agent pipelines - same library.
This is what open-source from Google looks like.
→ https://t.co/SSQnZZ94w6
Microsoft has released an open-source tool that helps teams learn ontology design before choosing a knowledge graph platform.
It is called Ontology Playground.
The project is a fully static React app, which means it does not need a backend, account system, database, or hosted service to run.
The goal is simple:
Help people understand what goes inside a graph before they buy or build the graph database.
Ontology Playground includes six pre-built domain ontologies:
→ Retail
→ Healthcare
→ Finance
→ Manufacturing
→ E-Commerce
→ Education
Each one gives users a starting point for understanding entities, relationships, properties, and how domain knowledge gets structured.
The app also includes a live visual designer, structured learning paths, hands-on labs, and RDF/XML export for Fabric IQ.
Because it is static, it can be deployed almost anywhere.
No backend.
No vendor lock-in.
No platform commitment upfront.
This matters because many teams jump into knowledge graphs too early.
They focus on the database first.
But the harder question is usually:
What should the graph actually know?
Ontology Playground teaches that layer first.
Learned this rule on the floor 45 years ago and it still holds true 90% of the time (or so it seems): "If a stock does not trade into its GAP area the next 4 days, it can continue in the direction of the gap for 2 weeks. can see how this worked perfecetly the past two months on big blue!