Европа - один из мировых центров притока инвестиций. Франция, Великобритания - традиционные лидеры, но теряют проекты. Новые точки роста: Турция (+20%), Польша (+10), Нидерланды (+8), Испания (+7). Инвестиционная активность растет там, где ниже издержки и высокий потенциал роста
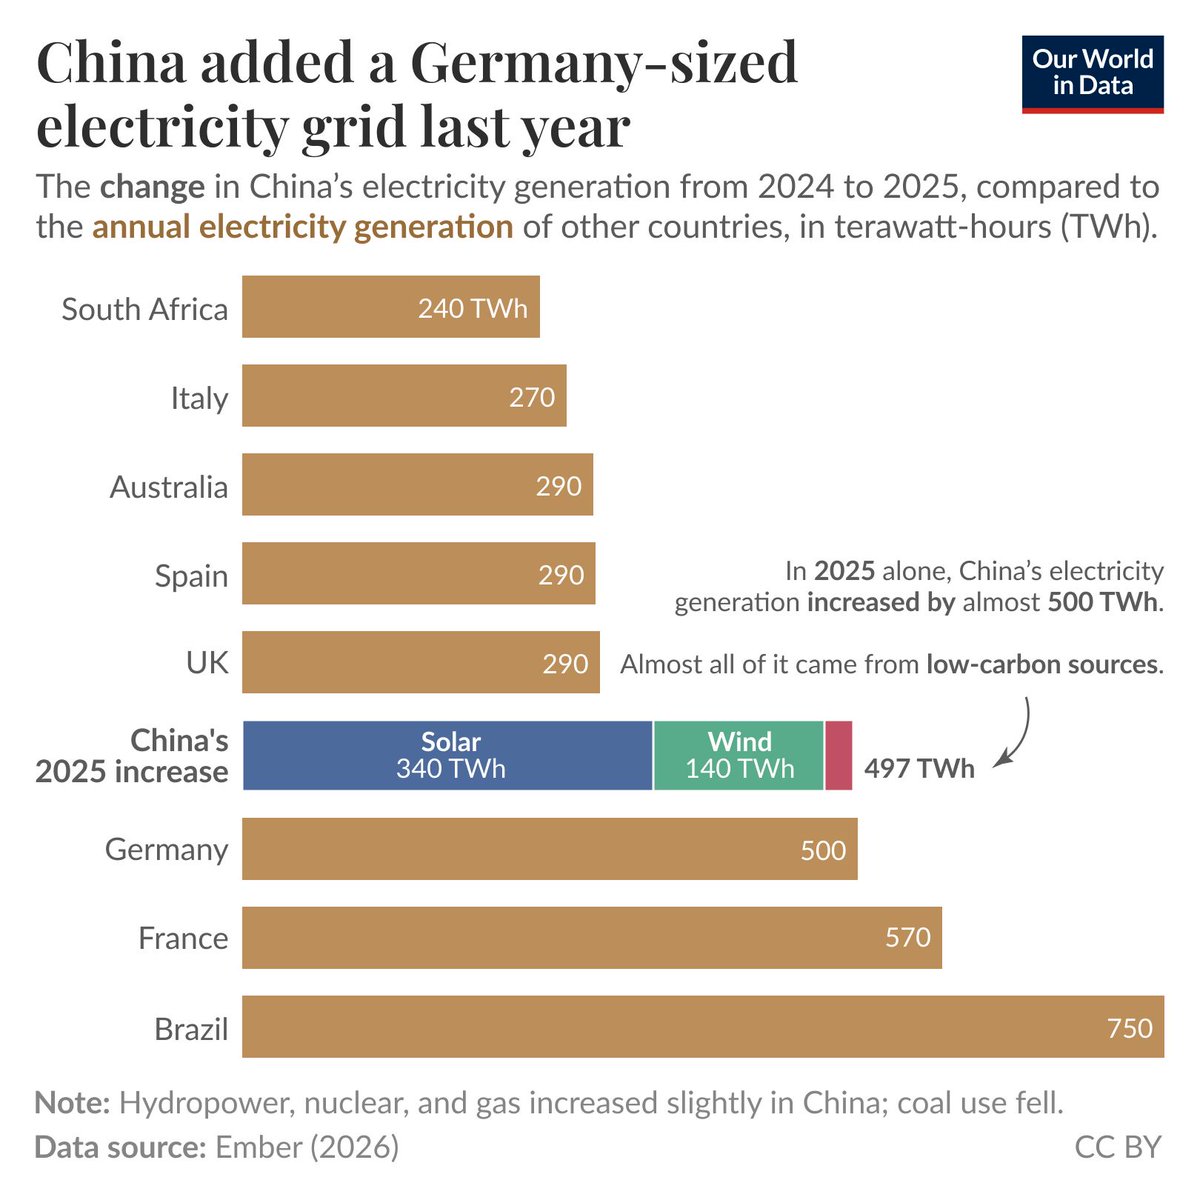
Впечатляет, что КНР за 1 год добавил в энергосистему почти "целую Германию". Прирост 500 ТВт ч (2025) обеспечили солнце +340 ТВт ч, ветер +140 ТВт ч. Это огромный масштаб транформации энергетики. Ведь энергия - основа ИИ, дата-центров, электромашин и аккумуляторов
China added a Germany-sized electricity grid last year—
(This Data Insight was written by @_HannahRitchie and Pablo Rosado.)
We’ll often see headlines quoting how many gigawatts of new solar farms or coal plants China is building. But it’s hard to get a meaningful sense of scale for how electricity generation in China is changing.
The chart puts it in perspective.
In 2025 alone, China’s electricity generation increased by almost 500 terawatt-hours (TWh). This is compared here to the total amount of electricity that whole countries generate each year.
Germany generates almost exactly that amount. That means China effectively added a Germany-sized grid to its electricity system in just one year.
What’s also quite staggering is that almost all of this new generation came from solar and wind. China generated 340 TWh more electricity from solar than the year before.
That’s more than our two home countries, the UK and Spain, generate from all sources each year.
Low-carbon sources grew so much that coal power in China actually fell slightly.
How Different Asian Countries Solve Problems
1. 🇵🇭 Philippines — Singing
2. 🇯🇵 Japan — Being Disciplined
3. 🇰🇷 South Korea — Working Overtime
4. 🇹🇭 Thailand — Smiling and Moving On
5. 🇮🇳 India — Jugaad (Improvise)
6. 🇨🇳 China — Finding a Way to Mass Produce
7. 🇻🇳 Vietnam — Hustling 24/7
8. 🇮🇩 Indonesia — Santai (Relax)
9. 🇲🇾 Malaysia — Think Logically and Multi-Task
10. 🇸🇬 Singapore — Following the Rules
11. 🇹🇼 Taiwan — Be Prepared and Think Ahead
12. 🇹🇱 Timor-Leste — Stay Strong and Keep Building
13. 🇧🇩 Bangladesh — Keep Going No Matter What
14. 🇵🇰 Pakistan — Chai and Discussion
15. 🇳🇵 Nepal — Stay Positive and Keep Climbing
16. 🇱🇰 Sri Lanka — Keep Calm and Respect
17. 🇲🇲 Myanmar — Accept and Be Patient
18. 🇰🇭 Cambodia — Keep It Simple and Humble
19. 🇱🇦 Laos — Take It Easy and Go With the Flow
20. 🇧🇳 Brunei — Grateful and Maintain Harmony
21. 🇦🇿 Azerbaijan — Strategize and Stay Resilient
22. 🇬🇪 Georgia — Toast First, Then Solve It
23. 🇦🇲 Armenia — Strong Roots, Strong Solutions
24. 🇰🇿 Kazakhstan — Stay Calm and Find Another Way
25. 🇺🇿 Uzbekistan — Think Long Term and Be Hospitable
26. 🇰🇬 Kyrgyzstan — Unity and Adaptability
27. 🇹🇯 Tajikistan — Patience and Wisdom
28. 🇹🇲 Turkmenistan — Plan Well and Stay Determined
29. 🇦🇫 Afghanistan — Be Strong and Keep Hope
30. 🇲🇳 Mongolia — Stay Tough and Endure
🖇️ Source: Asian Vibes illustrated infographic
Дональд Трамп и Си Цзиньпин 14-15 мая встретятся в Пекине. Главный вопрос – смогут ли две крупнейшие экономики удержать конкуренцию под контролем. А как считаете вы - стороны договорятся или усилится конфликт?
https://t.co/hqOgPDlbjs
К 2030 году Европа может обогнать Китай по рождаемости населения. На этом фоне Казахстан сохранит уровень рождаемости на уровне 350-400 тыс. в год. Пока народы Китая и Европы стареют, Казахстан сохранит демографическое окно возможностей, что важно превратить в экономический рост
If demographic trends hold, Europe could soon record more births than China. That would mark a genuine historical pivot. We would likely have to go back to the Qing dynasty some 300 years ago to find a comparable moment, possibly even further. For most of recorded history, China was not just bigger, it was in a different league. Now the gap is closing from both sides as Europe holds up better than expected and China ages faster than assumed. HT @benbawan
У Казахстана 11 место по добыче сырой нефти - 2,06 млн. баррелей в сутки. Возглавляет "второй эшелон", входит в число значимых нефтедобывающих стран. На фоне геополитической напряженности и сбоев поставок нефти из Ближнего Востока возрастает роль Казахстана как экспортера
Топ-3 тренда мировой экономики: март
1. Нефтяной шок
2. Возврат "дорогих денег"
3. Фрагментация мировой экономики
Для #KZ окно возможностей: развитие транзитного потенциала, привлечение инвестиций и создание новых производств
https://t.co/sCx3oEdK2x
График показывает: зависимость США от торговли с Китаем снизилась до 1% начала 2000-х гг. – это структурный сдвиг в мировой экономике. После роста в 2000-2015 гг. наметился нисходящий тренд. Текущие изменения формируют новую архитектуру мировой экономики на ближайшие 10 лет
📈 U.S. Trade Dependence on China Falls to Early 2000s Levels
U.S. trade with China as a share of GDP rose steadily from the 1980s, peaking at 3.4% in the mid-2010s, before declining sharply after the onset of the United States–China Trade War in 2018.
By 2025, trade with China had fallen to 1.3% of U.S. GDP—comprising 1.0% imports and 0.3% exports—returning to levels last seen in the early 2000s. This decline reflects ongoing supply chain diversification, tariffs, and strategic trade reorientation away from China.
#USA #China #trade #exports #imports #economy #GDP #goods #TradeWar #tariffs #globalization
#KZ на карте входит в зону, где доля налогов, в т.ч. соцплатежи, составляет 15-20% к ВВП (2023). Налоговая нагрузка умеренная, меньше, чем в Европе (30-45%), даже чем в КНР и Турции (20-25%). Проблема не ставки налогов, а узкая налоговая база и зависимость от экспорта сырья
📊 Data update: How much revenue do governments collect, and where does it come from?
Governments fund public services — from healthcare and education to infrastructure and defense — largely through taxation.
But how much tax revenue countries collect varies widely, as the chart shows. Here, it's expressed as a share of GDP to allow comparison across countries of different sizes.
In some countries, like Bangladesh and Ethiopia, tax revenue is less than 10% of GDP. In others, like Italy and France, it’s more than 40%.
Understanding how governments raise revenue is key to understanding fiscal policy, state capacity, and the relationship between taxation and development.
The UNU-WIDER Government Revenue Dataset is one of the most comprehensive cross-country datasets on government revenue composition.
Our colleague @parriagadap recently updated our charts with the latest release, which now covers 198 countries and territories from 1980 to 2023.
ТОП-3 ТРЕНДА МИРОВОЙ ЭКОНОМИКИ: ФЕВРАЛЬ
1. Нефтяной шок
2.Рост торговых барьеров - тарифы США 15%
3.ИИ - инвестиции SoftBank в OpenAI $41 млрд.
Выводы:
•Аккумулировать нефтедоллары
•Развивать Средний коридор
• Привлекать инвестиции в дата-центры
https://t.co/nGzj38WC3V