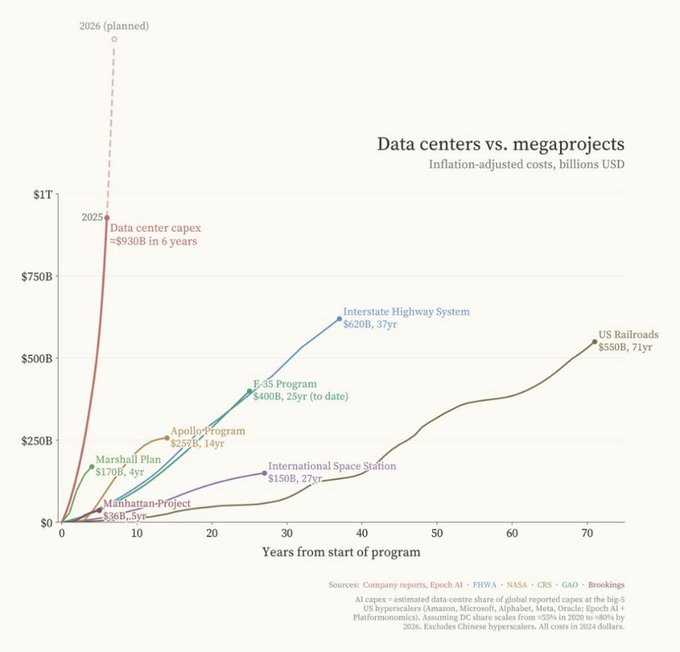
The S&P is 45% AI and 4% energy.
The market is massively long the output.
Massively short the input.
AI runs on power.
Every dollar flowing into Nvidia eventually flows into a gas turbine, a transformer, or a transmission line.
The market has built a portfolio that ignores its own supply chain.
I wrote about it, in my latest article, link in replies 👇
Paul Tudor Jones says the US is more dependent on equity prices than ever, and explains what a 35% correction would trigger in the economy:
"We're 252% of stock market cap to GDP. In 1929 we were 65%. In 1987 we got to ~85-90%. In 2000, 170%.
If you think about the periodicity of significant bear markets. Since 1970, we get a mean reversion about every 10 years.
Let's say mean revert to the past 25 or 30-year PE. That would be a 30, 35% decline. Well, 35% on 250% of GDP is 80, 90% of GDP.
10% of our tax revenues are capital gains, they go to zero. So you can see the budget deficit blowing up. You can see the bond market getting smoked. You can see this kind of negative self-reinforcing effect.
In the stock market, we're over-equitized as a country. We have the highest individual equity weightings in the history of the country.
And then the real problem is if you look at private equity in 2007-2008, that was about 7% of institutional portfolios. Now it's about 16% of the institutional portfolios. We're so much more illiquid than we were in 2008.
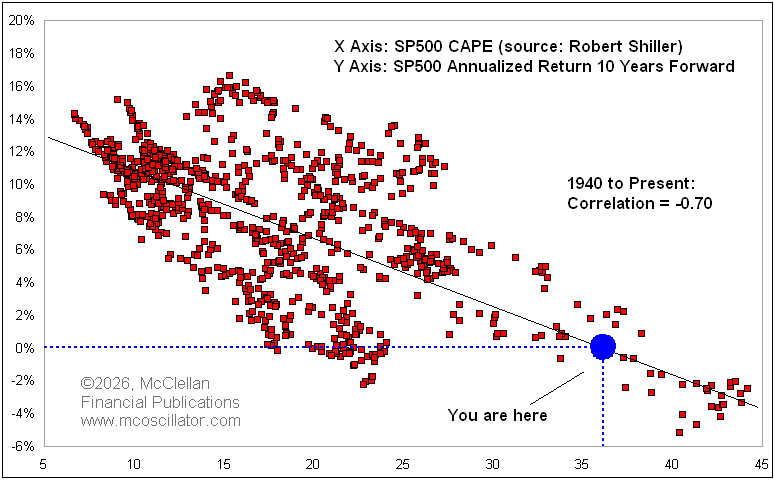
The problem is that if you buy the S&P at this current valuation, the 10-year forward return is negative when you buy the S&P with a PE of 22. That's what history shows.
So yes, the S&P is spectacular long-term, if you have a hundred-year view. But that's because that's an average of a hundred years, including times when the S&P 500 PE was 6, 7 and 8, or one third of what it is right now.
Valuation matters a lot, and the stock market's really high and it's gonna be really hard to make money from here with any kind of long-term view."
Dallas Fed economists last week examined exactly this divergence.
They suggest the lower trimmed mean reading may not be as reassuring as it looks.
The culprit: Tariffs and what they're doing to the shape of the distribution of price changes https://t.co/bm01SIaXtL
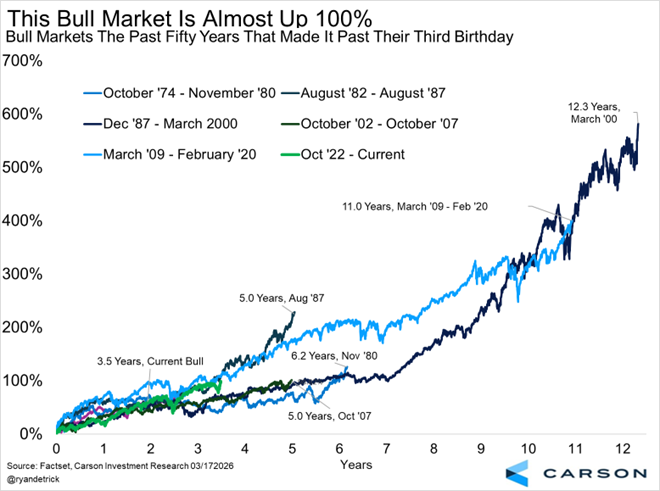
The current bull market is 3.5 years old and up 99.2%.
As we've noted many times, once bull markets get past their third birthday they rarely end anytime soon.
Over the past past 50 years, 5 made it past their 3rd birthday and those lasted eight years on average.
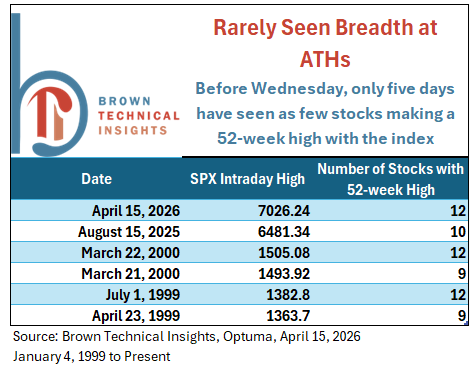
Today was truly rare. An all-time high for the S&P 500, but only 12 stocks in the index made a 52-week high.
Since 1999, we've only seen five readings that weak or worse
Oil shocks have systematically preceded a big rise in the unemployment rate
And each of them led to a recession, including the 1970s, 1990, 2001 & 2008
Today, even before the oil spike, the job market was no longer adding jobs
With oil still 50% higher since then, is this going to mark the turning point?
A thread 🧵
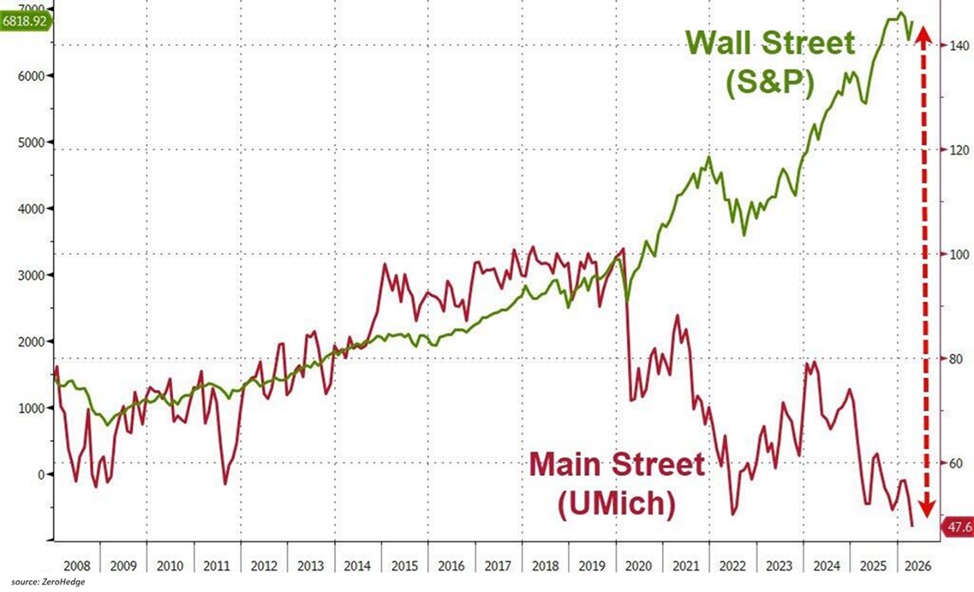
The gap between Wall Street and Main Street has never been bigger:
US consumer sentiment is down to 47.6 points, the lowest level in history.
At the same time, the S&P 500 is trading just 3% from its all-time high.
Since the 2020 pandemic, consumer sentiment has fallen -50%.
During the same period, the S&P 500 has rallied +205%.
This comes as inflation, rising housing costs, and a weakening job market are increasingly squeezing the average American household.
Meanwhile, 87% of all equities are held by the wealthiest 10% of households.
Asset owners are the biggest winners in this economy.
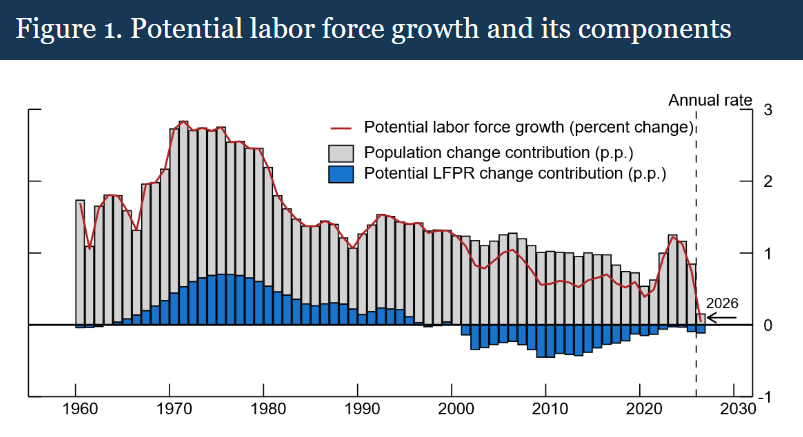
If the labor force grows near zero, U.S. GDP growth will have to rely almost entirely on productivity. If productivity disappoints, the economy risks stagnation or even recession—because there’s no slack in labor or population to push output higher.
Labor force growth could be near-zero starting this year, due to weak population growth and declining labor force participation. Such weak growth is unprecedented in the United States’ recent history. This has significant economic implications: (1/2) https://t.co/NJfZcHebcn
Labor force growth could be near-zero starting this year, due to weak population growth and declining labor force participation. Such weak growth is unprecedented in the United States’ recent history. This has significant economic implications: (1/2) https://t.co/NJfZcHebcn
CIO Chart of the Week: We continue to believe it is the Golden Age of Fixed Income. After the recent move higher in rates, high-quality yield (income) offers an attractive risk-reward for a portfolio. For example, if you bought US IG 3Y today at 4.57% yield, rates would need to rise more than 320 bps over the next year for returns to turn negative. On the other hand, if rates fall 50 basis points over the next 1y, you would return 5.4%. That asymmetry is representative of the opportunity in bond markets today: income can do much of the heavy lifting while preserving flexibility and providing a liquid ballast amidst an uncertain market.