SPCX first-day close: $165
not a guess. four perp venues with $200M daily volume have been price-discovering this for weeks while CNBC argues about "valuation frameworks"
$2.1T. priced. done.
screenshot this
Bitcoin bear market drawdowns have a clear pattern:
2011: -93%
2015: -86%
2018: -84%
2022: -77%
Every cycle, the drawdown gets smaller as the market matures.
Following this trend, the 2026 bottom should be around -70% from the $126K ATH. That puts us at $38K.
Good luck buying your bottom at $69K, $60K and $50K. I’ll see you at $38K.
2010: Bitcoin crashes to $0.1
2011: Bitcoin crashes to $1
2013: Bitcoin crashes to $50
2015: Bitcoin crashes to $200
2018: Bitcoin crashes to $3,000
2022: Bitcoin crashes to $15,000
2024: Bitcoin crashes to $39,000
2025: Bitcoin crashes to $74,000
2026: Bitcoin crashes to $81,000
Notice a pattern?
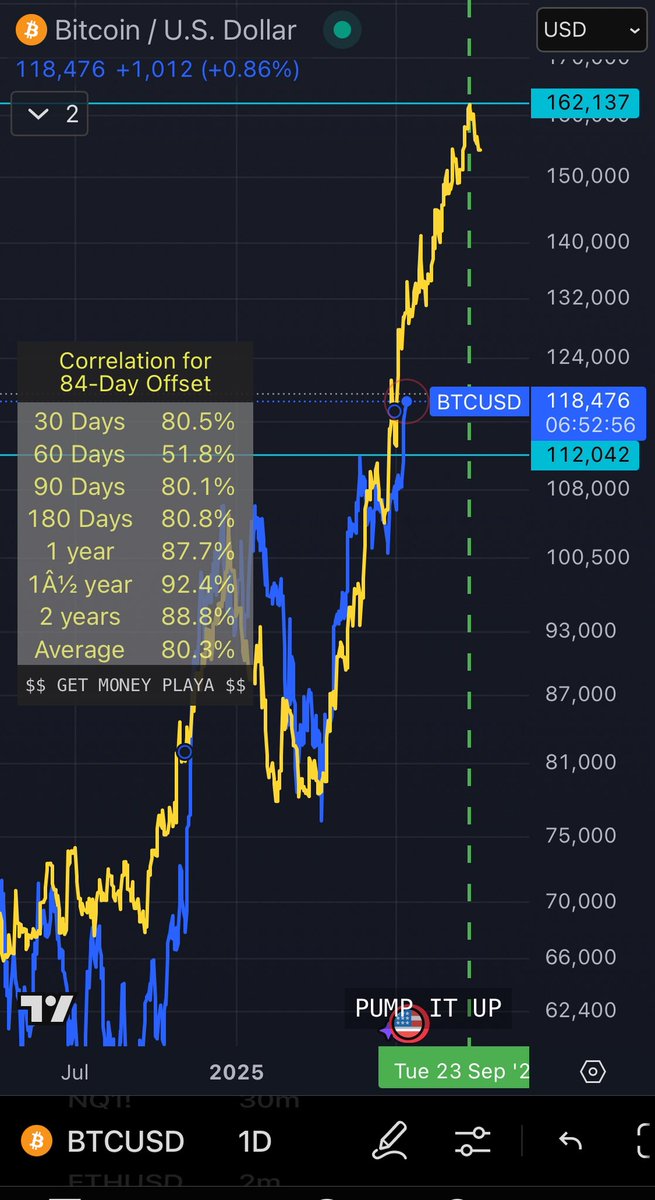
Global M2 has formed a lower high and lower low. Using the 84-day offset, the current peak is expected by late September.
As noted in my December post below, the past three Bitcoin peaks occurred 525–532 days post-halving.
Global M2's current peak is 518 days after the halving. Coincidence?
One week before this peak is the September FOMC meeting, where rate cuts are anticipated. Could the final vertical line on Global M2 signal a blow-off top amid rate cut excitement?
This is too easy though. What do you think?
$BTC M2 AVERAGE CORRELATION AT 80% PROJECTS $162K BY 9/23! I ran the numbers through Grok4 and with an MNav of 1.87 and a total BTC hodl of 620K would put $MSTR at $626. Is that bullish enough?
Updated GMI BTC/M2 chart:
Nothing seems unusual here but please do not expect all wiggles to match or all timing points to be exact, it's the overall contextualization that matters the most... and yes, alts bleed more than BTC in corrections.
NEWS: 🇺🇸 President Trump's Executive Director:
“WE WANT AS MUCH $BTC AS WE CAN GET”
"WERE NOT GONNA SELL ANY BITCOIN”
The Paradigm Has Shifted. THE BITCOIN ERA IS HERE
WERE GOING SO MUCH HIGHER
"4-Year cycle is dead"
I've heard that a lot recently, and many times before that.
Yet every time, the Bitcoin cycle continues to push forward.
I laid out this path in January 2023 with the November 28th Cycles Theory, and everything has fallen perfectly in line.
The idea of that Theory and the Halving Cycles Theory is that 2025 (Red Year) is the year of the bull market and the cycle top. Nothing has changed about that!
The reality is, there has been no bull market parabola yet, which means it is still to come.
Now is like April - May 2017.
Important upcoming dates:
First Cycle Top (Blue Dot) : April - June
Cycle Top Echo High (Hollow Red Dot): August - September
Cycle Top (Red Dot): Cycle Top
We're now about 1 month out from the projected First Cycle Top date of the Fibonacci Halvings which have been hyper-accurate for both the first and final tops of the cycle.
Can Bitcoin really make that big of a turnaround in just 30 days? It will be interesting to see.
If we've learned anything about this cycle, it's that it loves to make us wait!
It's also interesting to have had such a poor-performing February which is an almost unanimously bullish month even during the Bear Market.
I don't think that's a bad thing though, the cycles need to keep enough quirks to make sure people stay scared that everything is different.
Time and time again, this cycle mimics cycle 2 (2015 - 2018) which was much more smooth and methodical.
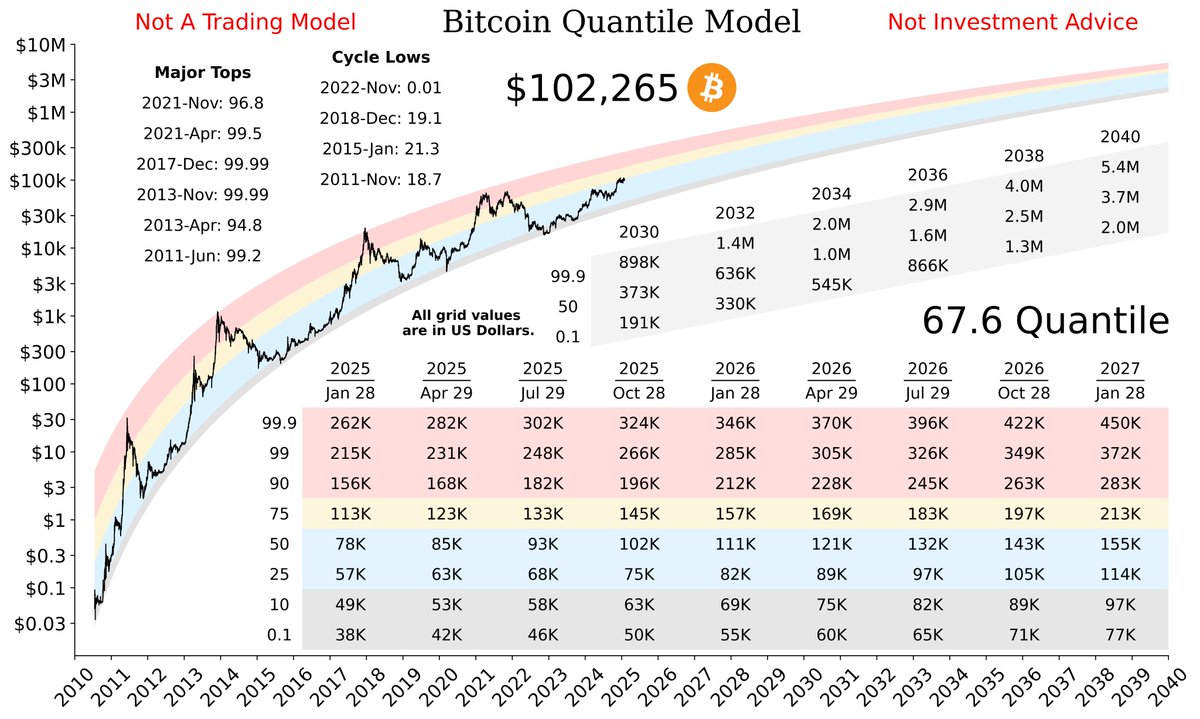
Plan C and have been developing the Quantile Model since mid last year.
A few days ago, we decided to start a research project and publish additional analyses on it.
The amount of work we've been able to do in a few days just amazes me. Let's recap. 🧵 0/