5 of 5 thoughts for the weekend
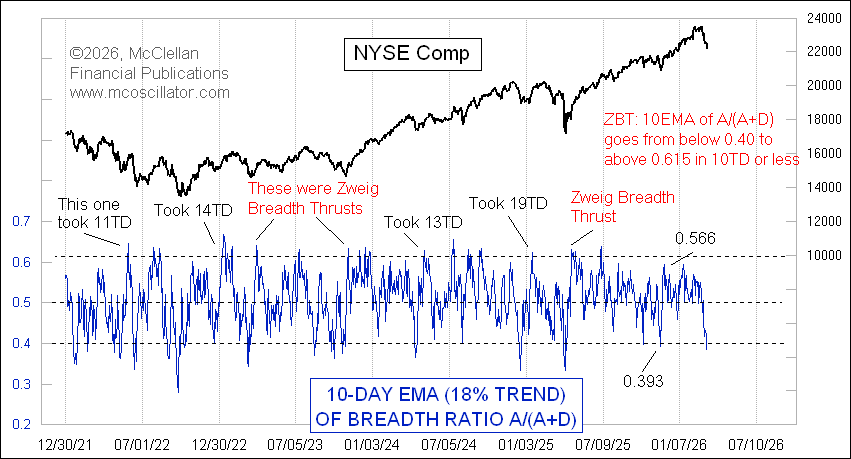
The Zweig Breadth Thrust Indicator is oversold. Pink lines show past instances when it was oversold. Dotted blue lines are ZBT buy signals.
I am not holding my breath for a buy signal, but a bounce is highly likely.
A Zweig Breadth Thrust is obviously not happening now, but Thursday's negative breadth provided the setup for one to potentially happen over the next 2 weeks. The first criterion is A/(A+D) going below 0.40, which marks an oversold condition to bounce from.
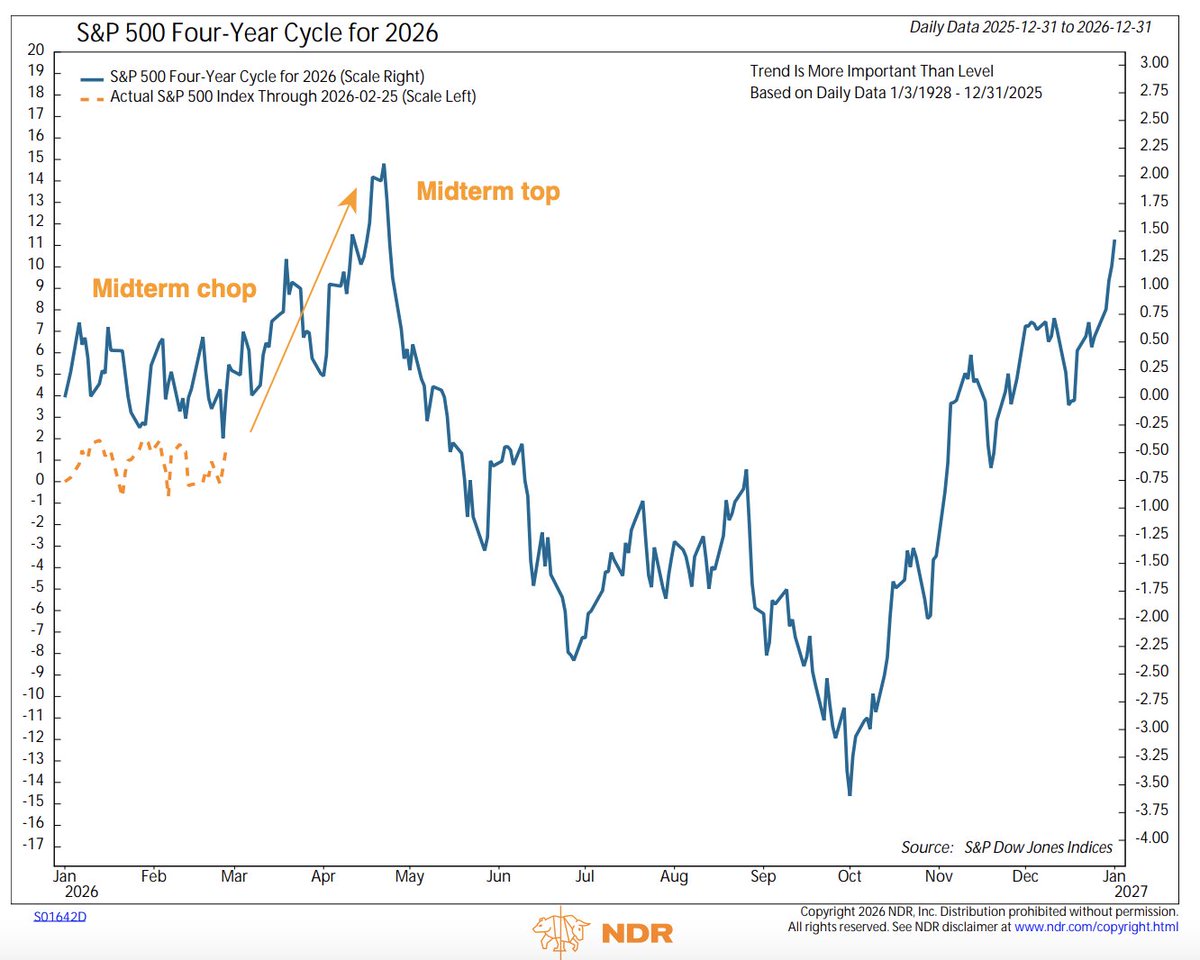
$SPX the choppy price action has been exactly forecast by the 4-Year Presidential cycle Midterm year.
From March - April, however, SPX typically heads to an annual high, before the fund flows revert to outflows ahead fo the midterm election.
$ES_F $SPY $DIA $QQQ $NYA
There was already a 1% fiscal stimulus coming in 2026. You can add another 1% from the tariff reset, plus who-knows-how-much on top of that for refunds... 🔥
Completley agree with this move by Druckenmiller, the $EWZ chart looks great and as I anticipated it broke out of a multi year consolidation. Relative Strength is now at levels not seen since 2004! Last time it was just the start of a multi year strong move, hoping it will repeat again. Support is the 7 month EMA, currently at $33.5 and moving higher.
Are you betting that breadth won't lead price higher?
We very well could chop more in February, but bigger picture, to see A/D lines breaking out historically has = price will follow.
Nice one from @FrankCappelleri this AM.
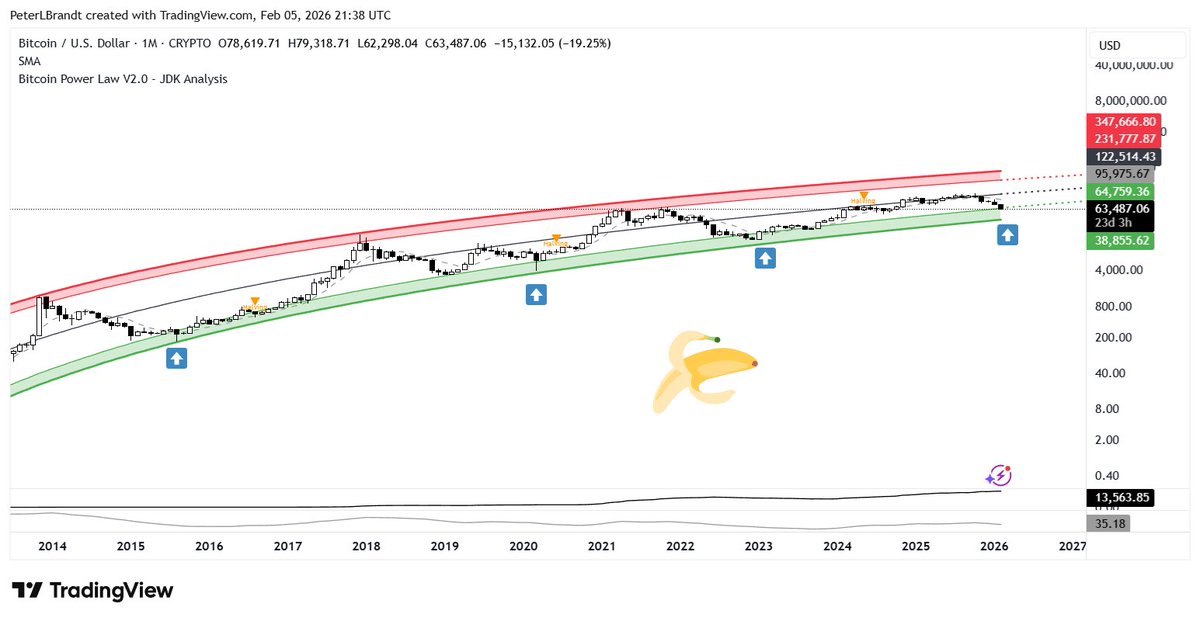
Great post and indeed a very important way to leverage both probable time and price to accumulate. I also bought at $60k and expect an ultimate low near $45 which we might see once in March and once in October. All based on historical probabilities of time and price.
If Bitcoin $BTC digs into the Banana peel as deeply as in past bear market cycles, then the bulls should not need to suffer too far south of $42,000
We are a hop, skip and jump from there
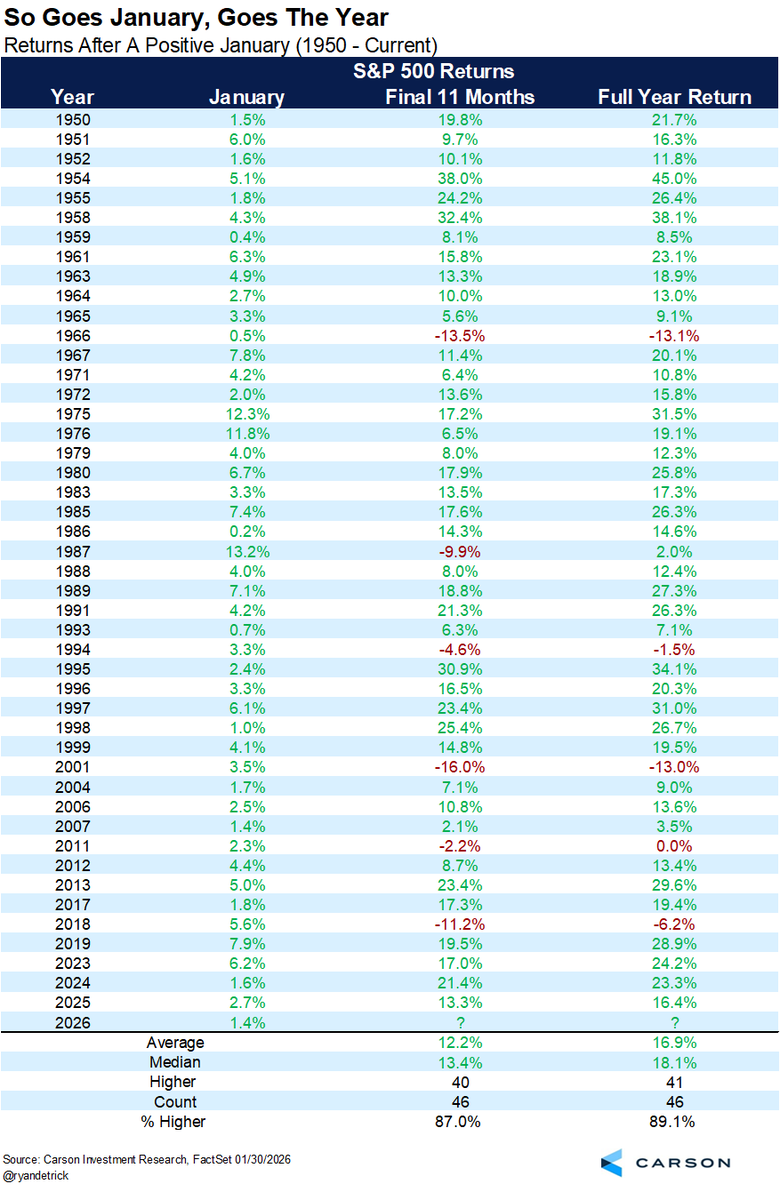
Since 1950, the S&P 500 has been higher in January 46 times.
11 months later it was higher 41 times (87.0%)
The full year was higher 42 times (89.1%)
Silver is worth owning, not arguing about
As a Bayesian I operate with binary paths considered
I trust charts as my Priors.
I trust PRICE, not narratives
The long-term chart of Silver suggests $600
NOT as a straight shot $XAG $SIVR $SI_F #Silver
Maybe $60 first
The Brazil ETF $EWZ as anticipated has broken out of a 10 year price consolidation and heading towards the first target of $40, with commodities showing strength the upward trend could continue well beyond that.
I've been waiting for the Brazil ETF (EWZ) to break above 32 for over 10 years, I have a feeling this might finally be the year. It should have a strong move once it does.
This proved an easy short.
As outlined to Finom Group Premium members, I was shorting with a 30day time horizon. When you combine 100% of stocks above 50-EMA and extending beyond Upper Bollinger Band, only one place to go from there.
Got my 1% profit, and covered in 4 days.
There are hundreds of these easy overbought/oversold trade ideas like this I take annually at the sector/industry ETF level.
$SPX $XLB $SPY $QQQ $MMM $DOW $NYA $DIA
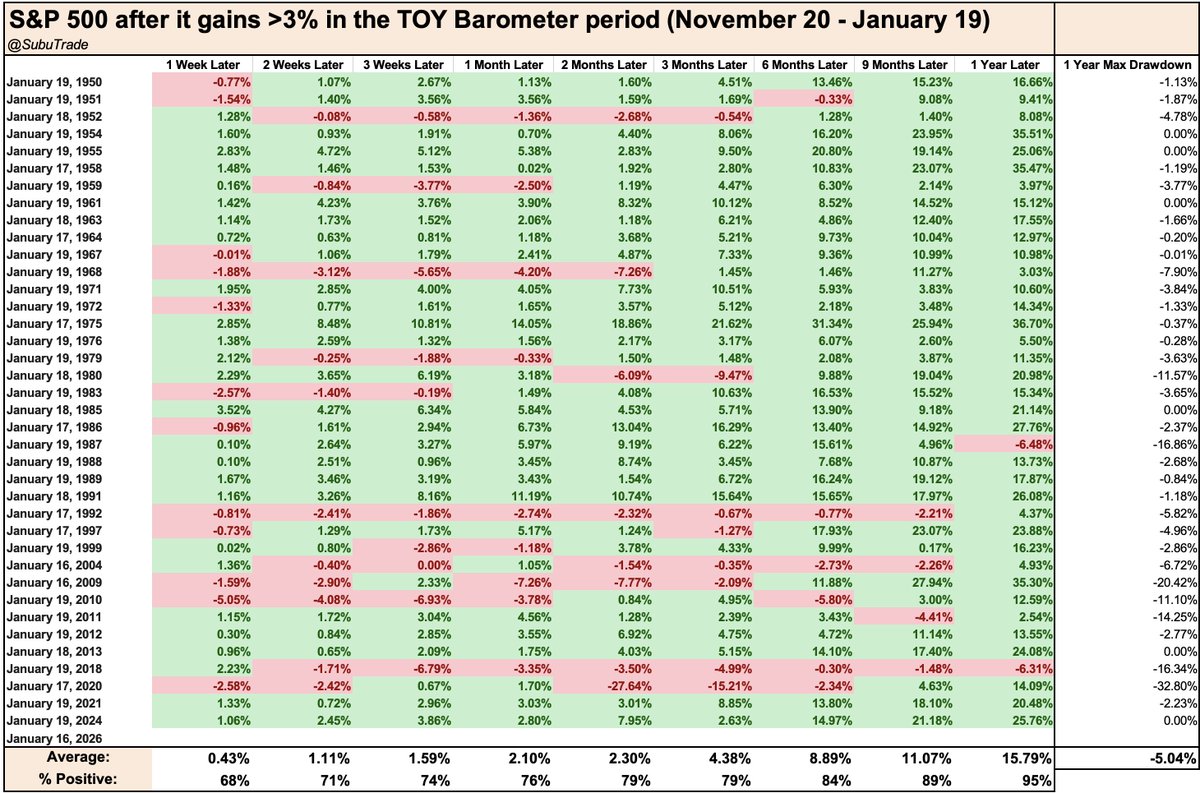
Bullish seasonality:
S&P 500 gained more than +3% during this TOY (Turn Of Year) Barometer period (November 20 - January 19).
Historically, $SPX was higher 36 out of 38 times a year later, with an average gain of +15.8%
h/t @WayneWhaley1136