If you are teaching #rstats and the tidyverse this fall consider using https://t.co/a9VGZpMHQp in your course to teach and visualize data analysis pipelines!
🔵 New project! 🔵
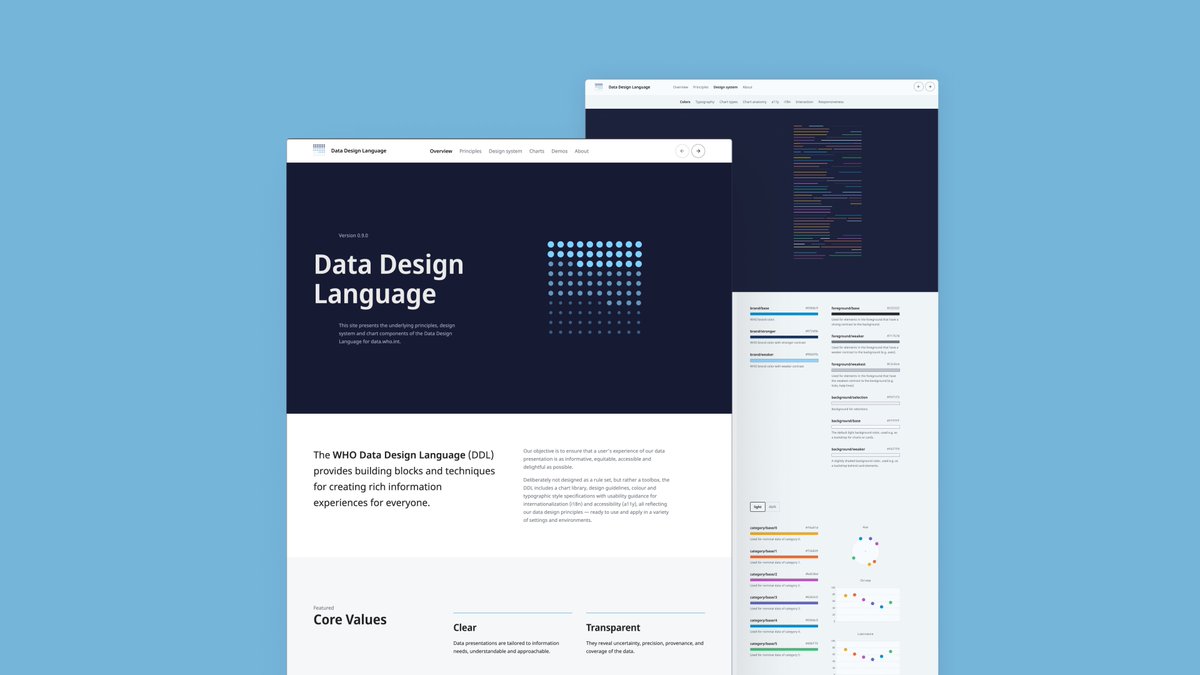
Announcing the Data Design Language
for the coming home of @WHO's
public health data: https://t.co/cyWrn4vlKO!
→ https://t.co/uqdC5vdaR6
/with
@al_ice_t@laessr@9elements
and many others
for & with @KOREuk
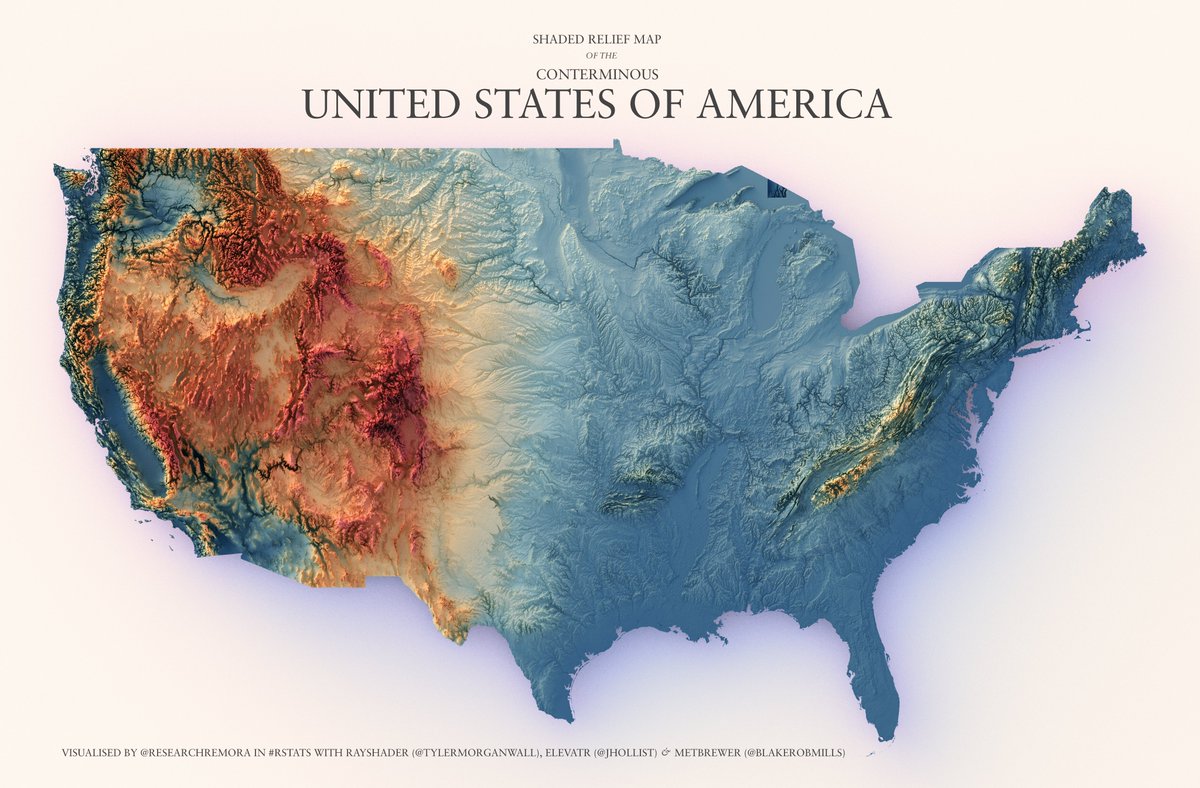
Today's shaded relief map is the conterminous United States of America. Where's Alaska and Hawaii? Well, they deserve their own maps. Also, Alaska is seriously massive. Texas + California + Montana massive. That is grand.
#rayshader adventures, an #rstats tale
@datastories, a podcast on #dataviz, has released a new episode after a one-year pause. They chat with with @abmakulec, our Executive Director about how dataviz has evolved lately and the return of the #IIBAwards this year.
https://t.co/zTlvN8Ypzq
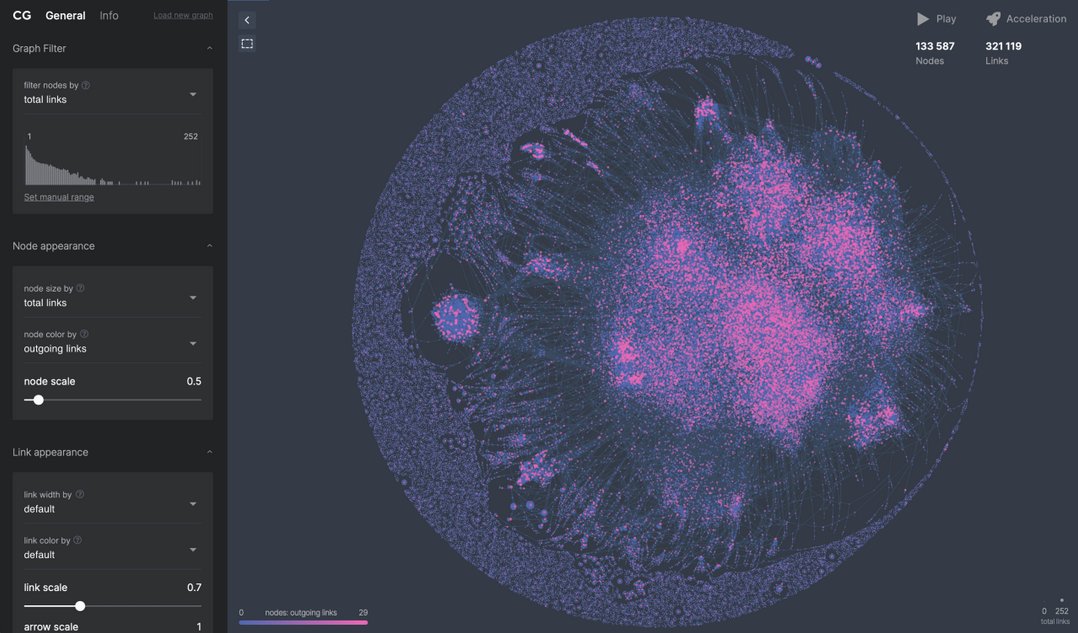
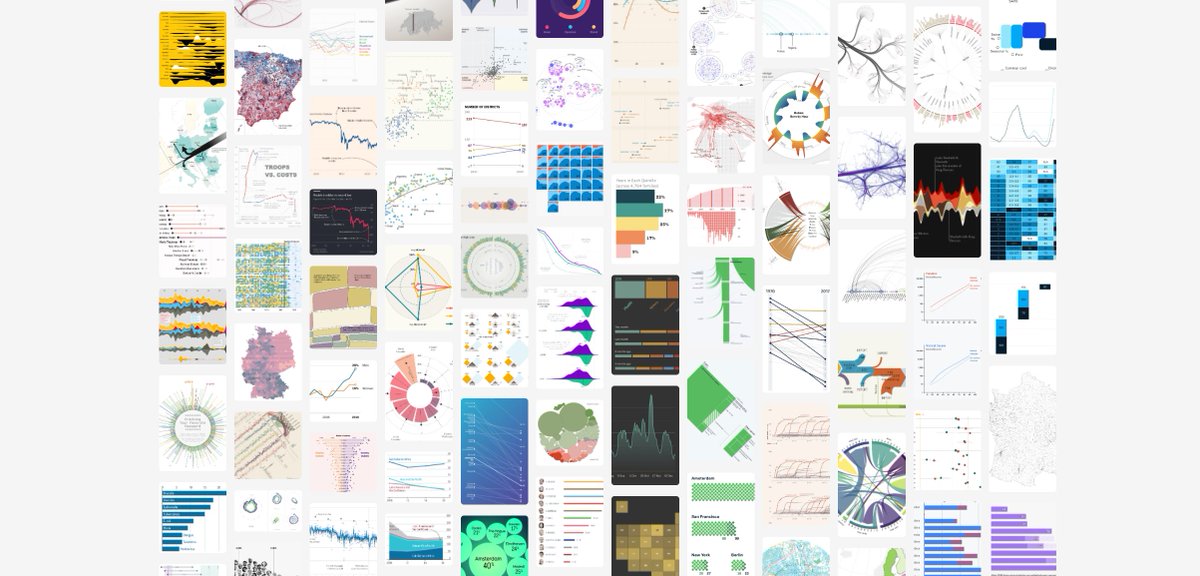
An online (free!) tool to visualize and explore giant networks 🤩
I'll definitely keep that in mind for the next network visual I want to create, because somehow they keep getting bigger and bigger O.O
https://t.co/XLZdyFMyff
#dataviz
NFT price distribution comparison by one specific trait. This example uses the most recent work of @rich__poole: the “Koripo” collection, and its Primary trait. Looks like Force is more valuable than Time, based on their median.
#nft#generativeart#dataviz#RStats@gmdaostudio
How to rank NFTs by their trait rarity? I tried 4 different rarity ranking methods, and I am not closer to any solution. Maybe I just stick to selecting what I would hang on my wall 😀
How do you make your selection?
#nft#generativeart#dataviz#ggplot#rstat@rich__poole
@hemilylan Thank you for your work. Would be interested to learn more about you and your process, and specifically what inspired you to create "The Commander". All the best. cc: @KnownOrigin_io
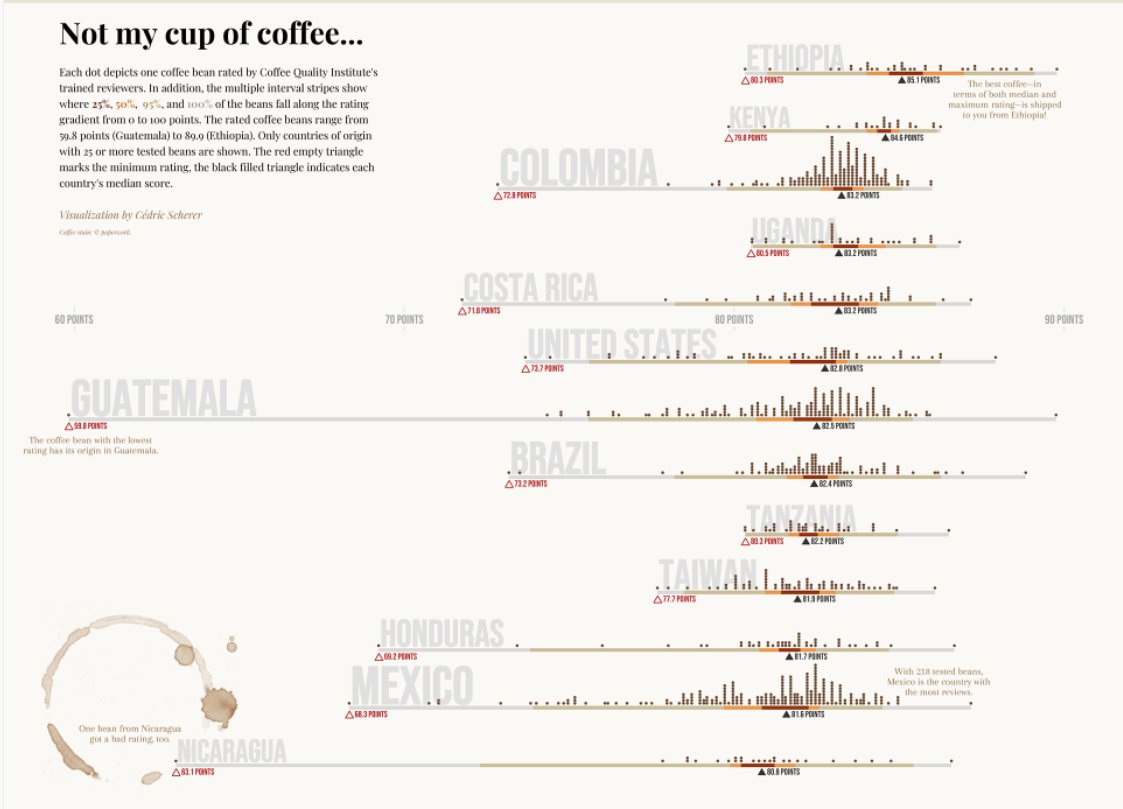
🎨If you like Data Visualization here is an AMAZING blog by @CedScherer who just blows me away every time I check it out - this was also a great inspiration for my winning notebook on the 2021 @kaggle Machine Learning & Data Science Survey
📌Link to blog: https://t.co/r39WqueEkM
The RStudio Community Table Gallery! <https://t.co/BRYgBcGH79> Lots of resources (including #rstats code) you can use to make your own awesome tables. This is really a treasure trove of tables! The introductory RStudio blog post is here: https://t.co/OMSNgJV3HF