Here's my conversation with @MichaelDell, founder, chairman and CEO of Dell Technologies (@DellTech).
(0:00) The Early Obsession: Dell's Beginnings
(0:18) Middle School Memories and Early Financial Fascinations
(1:11) The Spark of Stock Market Interest
(2:14) Unreleased Products and Unwavering Enthusiasm
(2:35) Family Conversations and Motivations
(3:11) The Puzzle of Technology
(4:50) Taking Things Apart: A Lifelong Curiosity
(5:52) The Economics of IBM and Early Business Insights
(9:19) Cost Control and Competitive Advantage
(16:36) The Importance of Storytelling in Business
(20:58) Learning from the Greats: Influences and Inspirations
(25:00) The Challenge of Self-Sabotage in Entrepreneurship
(29:48) Embracing Change and Innovation
(43:09) The Power of Data and AI in Business
(46:55) Cultural Differences and Resistance to Change
(47:22) Investing in Technology: Lessons from Andrew Carnegie
(49:05) The Concept of 'Dad Terminal'
(50:54) Supply Chain Mastery
(56:18) The Importance of Energy Management
(57:59) Early Financial Challenges and Solutions
(1:02:05) The Negative Cash Conversion Cycle
(1:18:17) The Mail Order Stigma and Overcoming It
(1:19:39) The Rise of E-commerce
(1:28:48) Fear of Failure and Final Thoughts
Includes paid partnerships.
Watch Hard Lessons, as legendary investor Stan Druckenmiller sits down with Morgan Stanley’s Iliana Bouzali, sharing how he would construct a portfolio if he had to start over today, why contrarianism is overrated, and which stock he regrets selling too early.
A big part of my system revolves around riding the wave after Stage 2 breakouts, so below I've explained exactly what I look for.
I'm not trying to catch the exact bottom or predict when a stock is going to explode.
I'm positioning myself in trend when structure, volume, and momentum all align, and that alignment happens during the transition from Stage 1 to Stage 2, which is when stocks move from accumulation into markup.
This is the phase where institutions start stepping in with size, volume increases meaningfully, and the character of the chart changes from sideways frustration to something that looks like linearity and strength.
I've spent years studying these transitions, and what I've learned is that if you can recognize the behavioral patterns that show up over and over again during this phase, you can put yourself in position to catch some of the biggest moves in the market without having to predict anything or get cute trying to pick bottoms.
The first thing I look at is the EMAs:
...specifically the 9/21/50 exponential moving averages, because they're the backbone of my system and they tell me everything I need to know about trend and momentum in real time.
The 9day tells me short-term momentum and whether buyers are still in control on a "day to day" basis.
The 21day defines structure and shows me whether the trend is orderly or erratic
and lastly the 50day confirms the bigger trend and tells me whether institutions are defending the move when the stock pulls back.
When all three of these EMAs align and start rising together, when price is holding above them and they're stacked in the proper order with the 9 above the 21 and the 21 above the 50, that's when I want exposure because the stock is showing me that it has both momentum and structure working in its favor.
I say it every single day, but it's worth repeating:
it's not about predicting what's going to happen next, it's about reacting to the evidence of strength that's showing up in real time, and the EMAs give me that evidence in the cleanest, most objective way possible.
The second thing I need to see is volume confirmation.
...because price without volume means absolutely nothing to me and I've learned the hard way that chasing breakouts without institutional sponsorship is a recipe for getting chopped up.
What I'm looking for are accumulation bars, which are high volume up days followed by low volume pullbacks, because that pattern tells me that institutions are quietly building positions and absorbing supply without pushing the stock too hard too fast.
You don't need to know which funds are buying or what their thesis is... the chart shows you through repeated volume surges on strength, and that's the footprint of institutional accumulation.
That's why I don't chase random breakouts just because a stock is moving, because I want to see the footprints first, I want to see the evidence that BIG DADDY money is involved (lol), and I want to see that the stock can digest gains on light volume before it makes the next push higher.
Volume is the fuel that powers the move, and without it, I'm just trading random charts that look "decent."
The third thing I look for is big bases.
because the bigger the base, the higher in space, and that's not just a catchy phrase my people... it's a proven pattern that shows up over and over again in the biggest winners.
Mult month or even multi year bases show long periods of accumulation, compression, and emotional reset, where weak hands get shaken out, institutions build positions, and the stock builds the energy it needs for the next major leg higher.
When these structures break with volume and momentum, the moves can be explosive because it's not just a breakout... it's months or years of "pent up" demand being released at once, and the stocks that come out of these bases with the right characteristics are often the ones that lead the market for the next cycle.
I'm specifically watching four names as candidates right now:
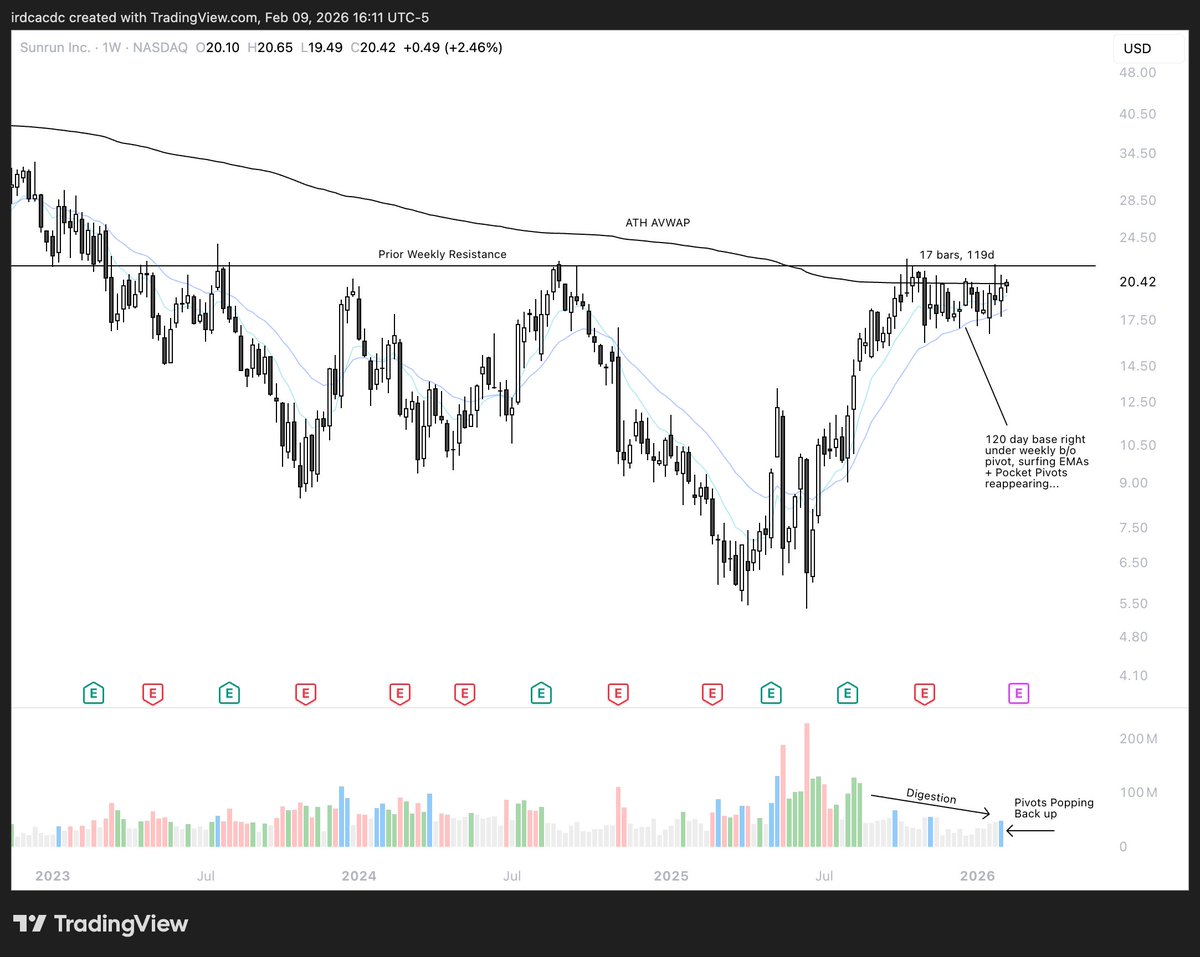
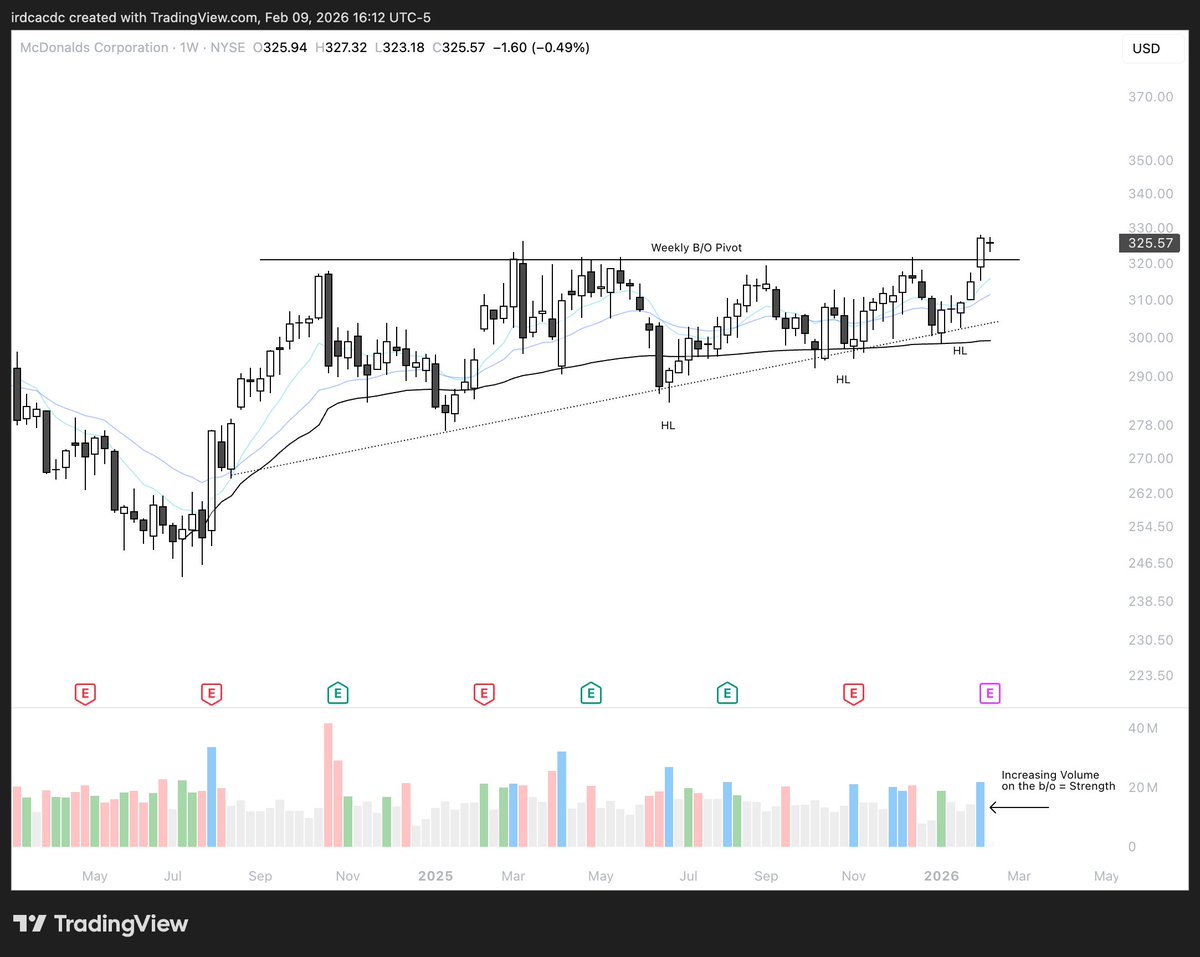
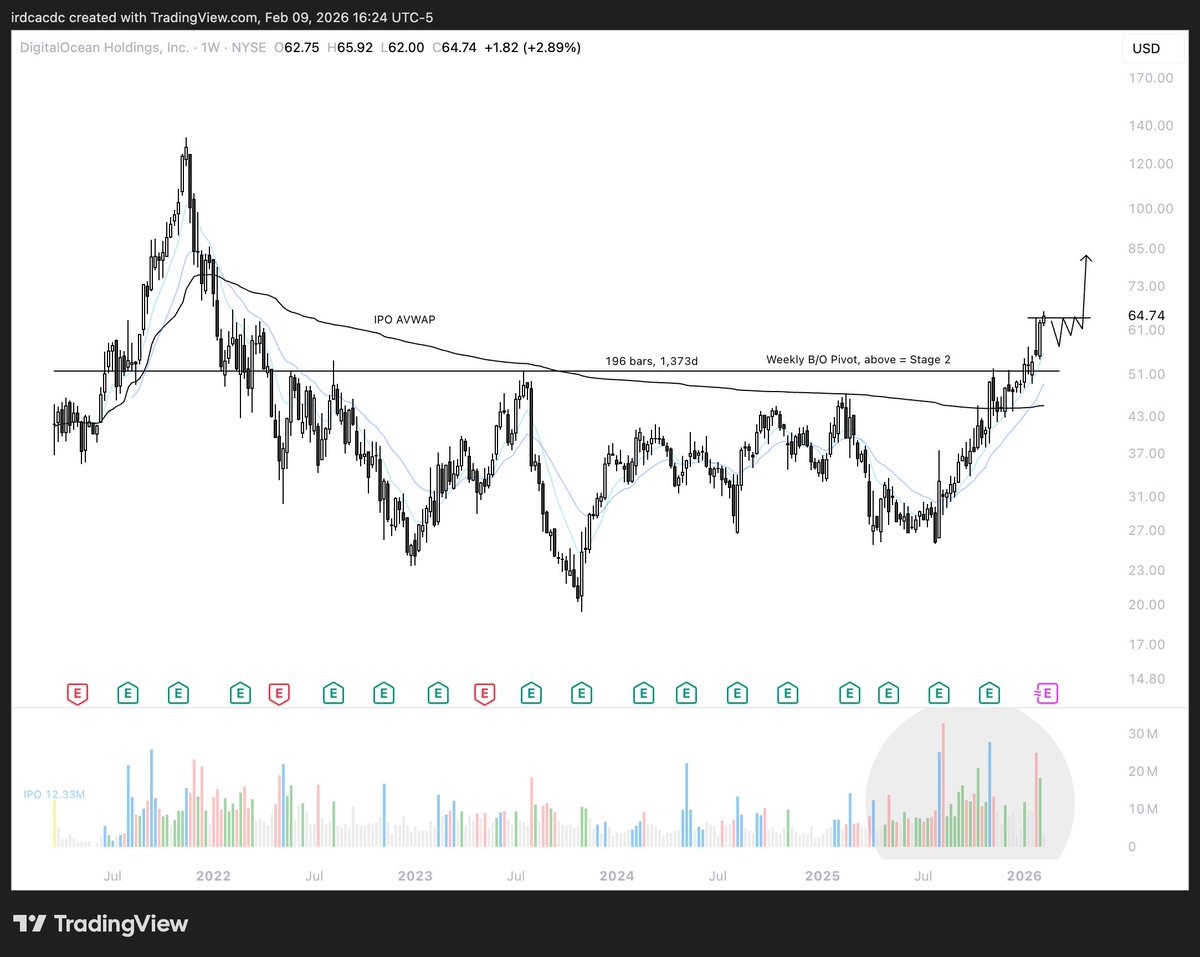
$ZM, $RUN, $MCD, and $DOCN, all of which have multi year/month bases that are just starting to move higher with clear accumulation on the right side of the bases, trading above their anchored VWAPs, and price pressing above all key moving averages.
All of these charts are showing signs of renewed institutional interest, and you can see it in the character.
Volume is expanding on up days, contracting on pullbacks, and higher lows are forming into resistance, which tells me that the behavior is shifting from Stage 1 accumulation into early Stage 2 markup.
Nobody knows what will happen next with these names, and I'm not pretending to have a crystal ball, but these are the signs I look for when I'm identifying potential leaders in early Stage 2, and if these names continue to hold trend and show controlled strength, I'll be buying every pullback that respects structure and where volume confirms the move.
For my system, it's all about recognizing behavior that repeats over and over again across different names, different sectors, and different market cycles.
- strong structure
- price surfing EMAs
- expanding volume on strength
and accumulation on the right side of the base.
...are what fuel the next wave, and that's what I'm hunting for every single day.
"The bigger the base, the higher in space."
and if you can train yourself to recognize these Stage 1 to Stage 2 transitions before everyone else piles in, you give yourself the best risk/reward setups in the entire market because you're getting in early with institutional sponsorship backing you up!!