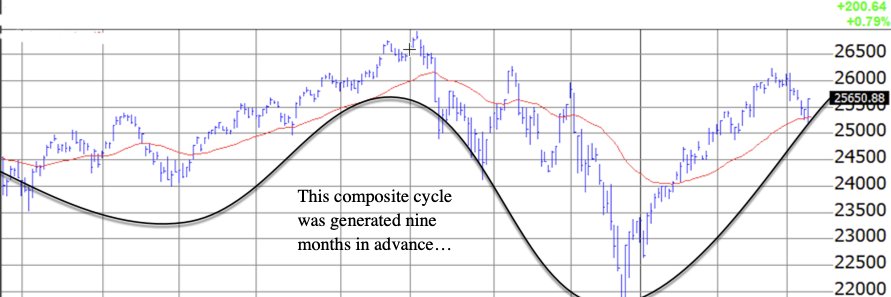
Using Composite Cycles & Technical Analysis Successfully to max gains and minimize losses
"Confidence is contagious,So is lack of confidence"
-Vince Lombardi
2026 Was a Great Year for Stocks.
Benner Cycle predicted that 2026 would be a “Year of Good Times, High Prices and the time to sell Stocks and values of all kinds.”
Can an 1875 cycle prophecy be right in 2026? So far it was, but it is just 5 months behind us in 2026.
What is the Benner Cycle?
Samuel Benner, an Ohio farmer, published "Benner's Prophecies of Future Ups and Downs in Prices" in 1875, based on his analysis of historical economic patterns in agriculture, commodities, and business cycles.
The figure shows the original Benner Cycle chart. Apparently, the diagram was initially compiled by Tritch (1872), but it was not attributed to him.
What’s the accuracy of the Benner Cycle?
Dewey (1967), the Director of the Foundation for the Study of Cycles, assessed Benner's pig iron price forecasts and thought that they accurately gave “the years in which to buy, the years in which to sell. If you had used these dates for trading, your percentage gains between 1872 and 1939 would have been 50 times your losses!” He also regarded Benner's work as “the most notable forecast of prices in existence.”
Interesting analysis and attempted improvements by Frost and McMinn, including a 9/56 grid possibly correlated with the Moon Sun Cycle, are discussed in McMinn, D., 2022. Benner Cycles & the 9/56-year grid. Cycles Magazine. Vol 51. No 5. p 8-29.
Note: A rigid calendar application of the Benner Cycle has a mixed record, but adding or subtracting a year or two yields remarkable results. One should realize that some cycles vary over time but generally return to their stable state. Their accuracy and duration are also affected by shorter and longer cycles, as well as “random” events such as new technological breakthroughs.
SpaceX, OpenAI & Anthropic IPOs could absorb a massive amount of capital this year:
• SpaceX: $50B – $75B+
• OpenAI: $50B – $150B
• Anthropic: $40B – $60B+
Total potential raise: **$150B – $250B+**
The three biggest IPOs in history... happening almost at the same time.
That’s going to be one hell of a liquidity vacuum.
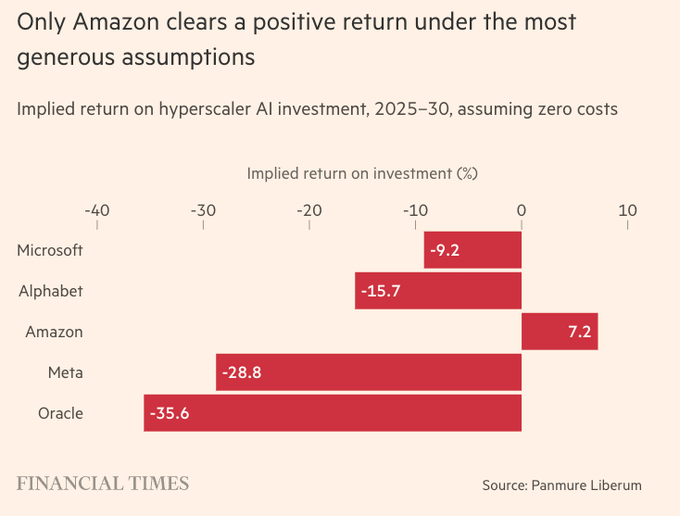
AI Race To Return On Investment
Only **Amazon** is expected to generate a positive return on its massive AI capex through 2030 — even under the most generous assumptions (zero costs).
Microsoft: -9.2%
Alphabet: -15.7%
Meta: -28.8%
Oracle: -35.6%
The AI arms race is getting expensive.
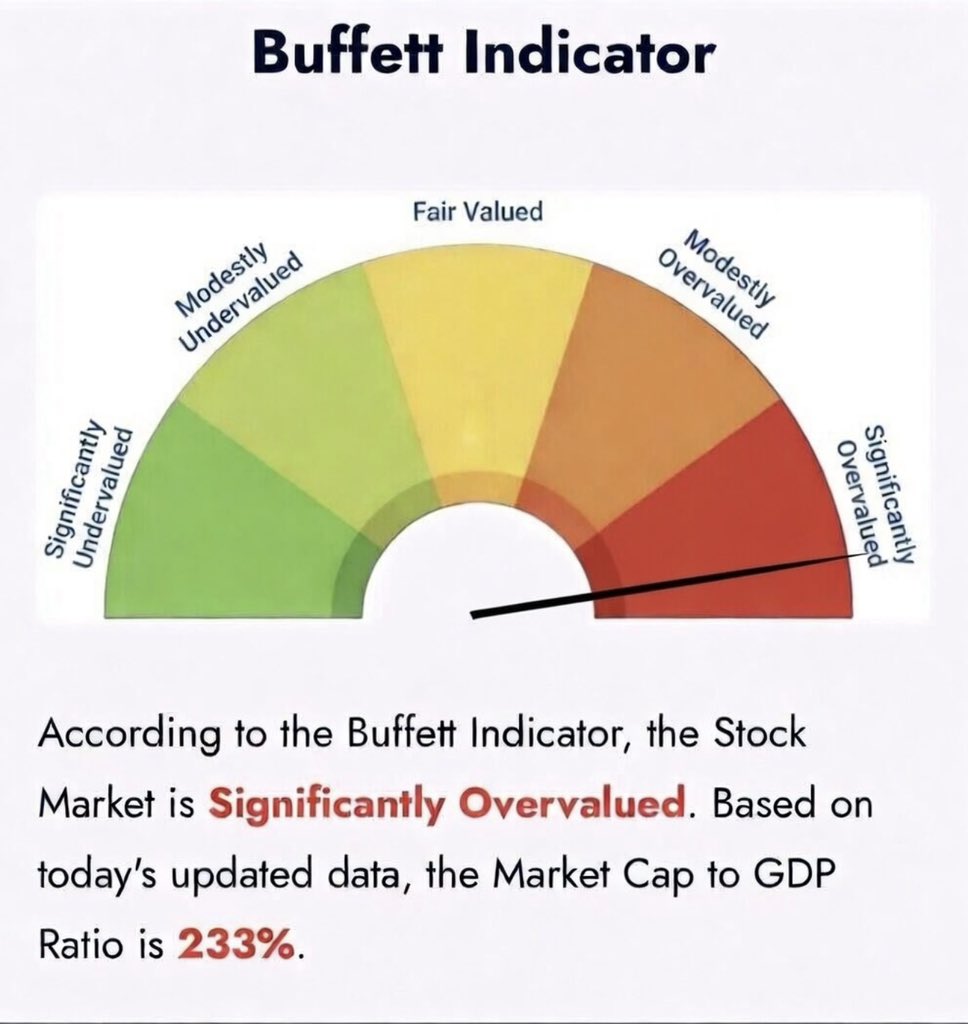
Historically, Warren Buffett will comfortably let Berkshire Hathaway’s cash pile sit at elevated levels for 1.5 to 3 full years before a major market crash finally hits.
Pre-Dot-Com Bubble: The cash pile sat heavily elevated for roughly 2 years before the peak.
The Great Financial Crisis: The cash pile remained highly elevated for 3 full years.
Berkshire Hathaway has been a net seller of stocks for 14 consecutive quarters. This current cash accumulation phase began in earnest in mid-2023, and the pile has swelled to its record $397 billion mark.
If history is any guide, we are currently entering the 2.5-year mark of Buffett sitting on his hands while the market pushes higher. True to his pattern, this means the current market could continue to drift upward on AI momentum for months, or even another year, before the structural gravity of the Buffett Indicator pulls it back down.
Price momentum remains strong.
8 consecutives "green" candles on the weekly chart suggest extremely bullishness for the next 6 months.
Since 1993, it happened only 17 times (including this week's signal).
Positive 94% of the time 6-month later, with an average return of 7.26%.
NEVER in history has the Heavy Truck Index 2-year rate of change fallen below -25% without a recession following.
Have market dynamics really changed, or is it just a matter of time?
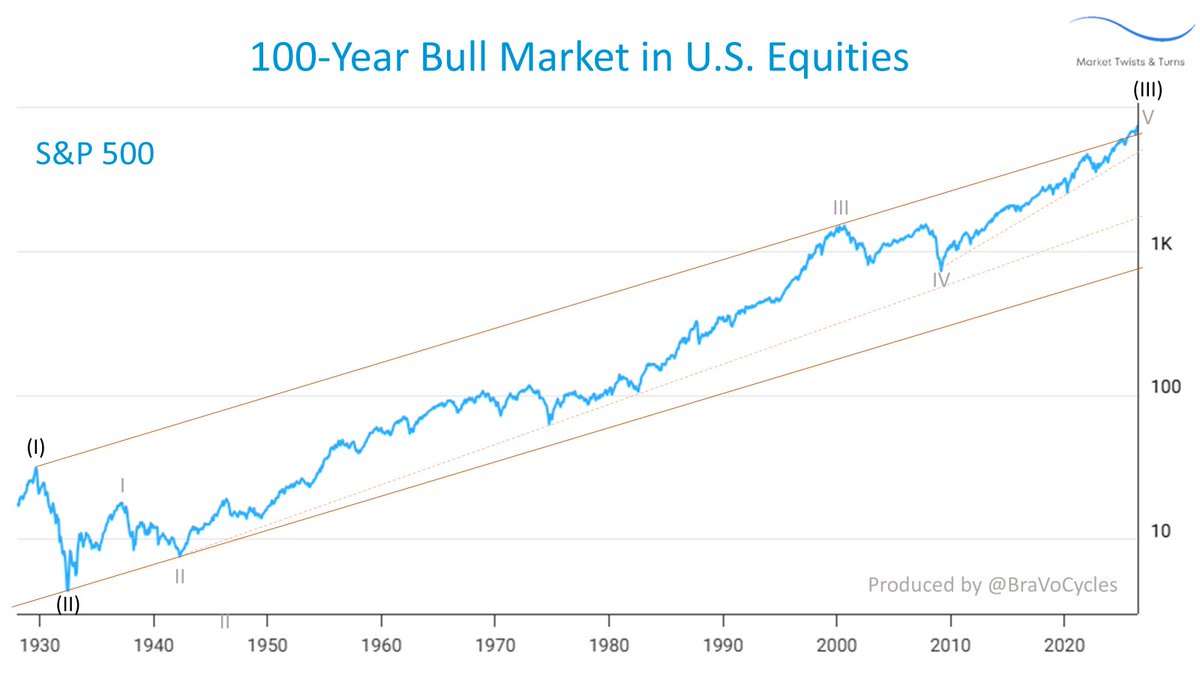
100 Years of U.S. Equity Cycles: Are We Facing a Generational Turning Point? 📈
The secular super-cycle wave (III) has been building since the absolute ashes of the 1929 market crash. Today, the S&P 500 is fast approaching the terminal completion of Cycle-degree Wave V.
Price has recently pushed above the critical multi-decade upper channel line connecting the 1929 and 2000 Dot-Com peaks.
Consensus calls this the birth of a new, endless bull run.
But Elliott Wave principles warn of a far different outcome: The Classic Channel Throwover.
If history and structural guidelines hold:
🔴 A sharp reversal back inside the channel is imminent.
🔴 A prolonged, multi-year Wave (IV) correction will follow.
🔴 The silver lining? A massive 50-year Wave (V) generational buying opportunity awaits on the other side.
"Every great cycle must come to an end."
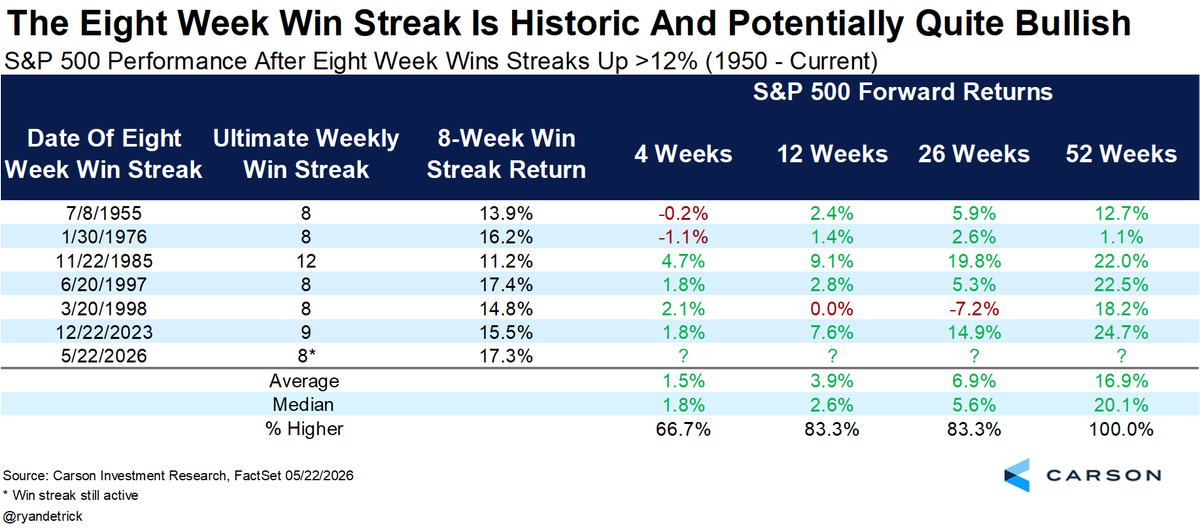
We just barely missed the best 8-week rally in history.
This one is up 17.3% and there was a 17.4% one in 1997. Stocks gained another 22% a year later back then by the way.
In fact, never lower a year later after an 8-week win streak that gained at least 12%.
You've never seen anything like this.
The ratio of Momentum to Minimum Volatility stocks is breaking all historical records, higher than in 2000, 2008, and 2021.
Do you understand the "gravitational law" of financial markets?
What goes up must come down. That's mean reversion, and it can be painful for some.
Intermediate-Term Market Breadth Indicators Are Flashing Warning Signs
Although S&P 500 market breadth improved last week, intermediate-term breadth indicators still look concerning. I've posted several examples recently, here are two more.
Both the New 52-Week Highs & Lows and the McClellan Volume Summation Index are showing strong negative divergences relative to $SPX.
Long story short: this does not bode well for the market.
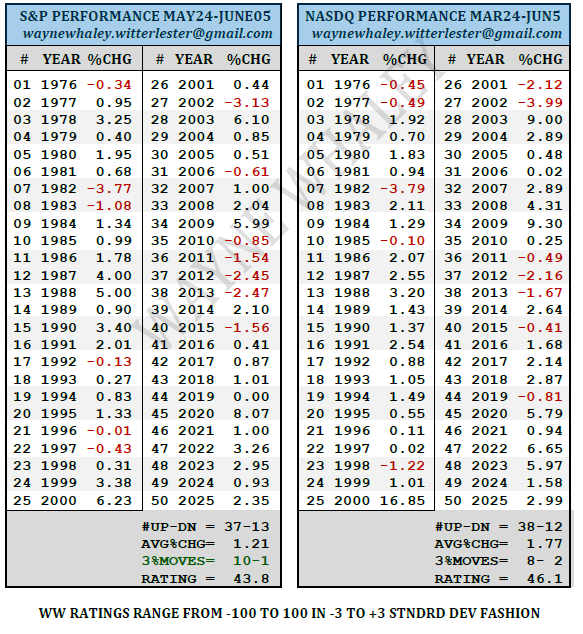
To continue the discussion of the @WayneWhaley1136 post.
Why This Period is Unique:
The Post-Memorial Day Rally: Historically, stocks tend to rise right after the Memorial Day holiday.
Low Risk, High Reward: Over 50 years, the market only had one major drop (a 3% loss in 1981) during these two weeks. Conversely, it surged by 3% or more in ten different years.
Perfect Recent Streak: The market has gone up during this exact two-week window for the last 10 years in a row.
Trend Proof: It does not matter if the market is currently in a correction or a bull market. This specific calendar window historically wins anyway.
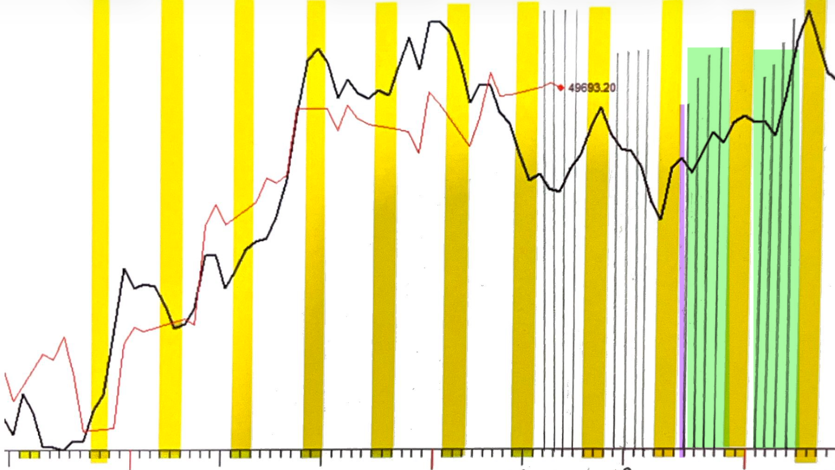
Below is a S/T Cycle chart. Yellow-weekends, Purple=Memorial Day, Green=May25-June5. So, the S/T Cycles are in agreement.
BTW, the red line is the actual DJIA through May 13.
The Strategy Behind the Math:
50-Year Scan: A computer model analyzed every single block of time lasting between 7 and 35 days over the past 50 years.
The Top 10: The model filtered out the absolute best 10 times of the year to buy stocks.
Rank #5: This specific period (May 24 to June 5) is the 5th best time of the entire year to be invested in the S&P 500 and Nasdaq.
Why This Period is Unique:
The Post-Memorial Day Rally: Historically, stocks tend to rise right after the Memorial Day holiday.
Low Risk, High Reward: Over 50 years, the market only had one major drop (a 3% loss in 1981) during these two weeks. Conversely, it surged by 3% or more in ten different years.
Perfect Recent Streak: The market has gone up during this exact two-week window for the last 10 years in a row.
Trend Proof: It does not matter if the market is currently in a correction or a bull market. This specific calendar window historically wins anyway.
MAY24-JUNE5 : THE FIFTH RANKED S&P/NASDAQ SEASONAL PERIOD OF THE YEAR
The Top Ten Seasonal Model
1. Evaluates the performance of every time frame in the year from 7 to 35 calendar days over the last 50 years for the market of interest.
2. Identifies the top 10 mutually exclusive periods and shares the performance data with the user
May24-June5, which I refer to as the Post Memorial Day Rally, is my 5th ranked S&P seasonal trade of the year for both the S&P and the Nasdaq when comparing all time frames across the year (with no consideration for trailing trend influences).
Note, the S&P experienced only one 3% loss (1981) during this period over the last 50 years vs ten different years which experienced 3% gains during this period.
The last ten cases have been positive.
For this particular time frame, I didn't note a noticeable impact on the performance from the trailing price trend.
This weekend, I shared with Study Subscribers five summer periods for several markets to have on alert status based on past performance in years with setup trails similar to 2026.
[email protected] for Study Subscription inquiries.
Financial markets are currently experiencing a historic wave of retail speculation, directly linking South Korea's massive stock market frenzy to Warren Buffett's viral warnings about widespread gambling behavior.
"We've Never Had People in a More Gambling Mood": Buffett noted that out of his 60 years in business, speculative energy has never been this high.The Church and the Casino: He famously compared the stock market to a "church with an attached casino". Buffett warned that the casino side has become incredibly attractive and prominent. Not Investing, It's Gambling: Pointing specifically to retail activities like one-day options trading and rapid prediction markets, Buffett stated bluntly: "That’s not investing. It’s not speculating. It’s gambling, just totally."
🔴THE LEVEL OF SPECULATION IN SOUTH KOREA IS INSANE:
Margin loans outstanding on South Korean stocks have surged to a record 36.47 trillion won, or ~$26 billion, the highest EVER.
TAP IMAGE TO SEE FULL INSIGHT👇
https://t.co/EDrD5qEOwG
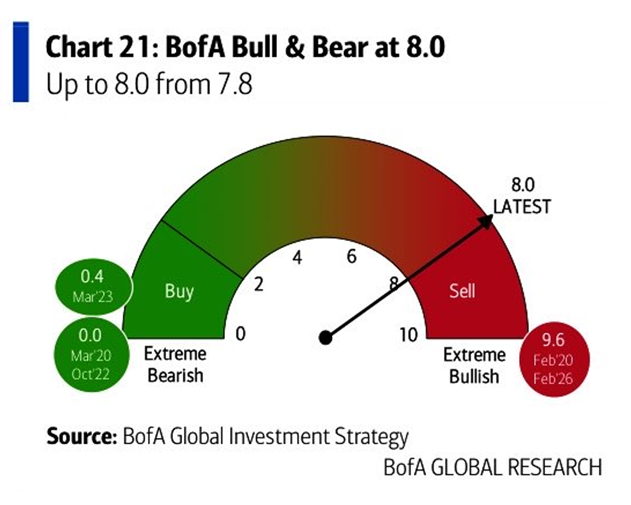
🔴BofA Bull & Bear indicator is screaming SELL again:
This metric rose to 8.0 this week, up +0.4 points, triggering a sell signal for equities for the first time since February 2026.
The indicator has surged +1.7 points over the last 4 weeks, driven by tech and emerging market debt inflows, a record monthly increase in fund manager equity allocations, and a drop in cash levels to 3.9%.
5 of the indicator's 6 components are now bullish or very bullish, with none being bearish.
Historically, there have been 17 sell signals since 2002, with global stocks averaging a loss of -2% to -3% over the following 2 to 3 months, and maximum drawdowns of -15% to -20%.
Investor euphoria is now almost everywhere.