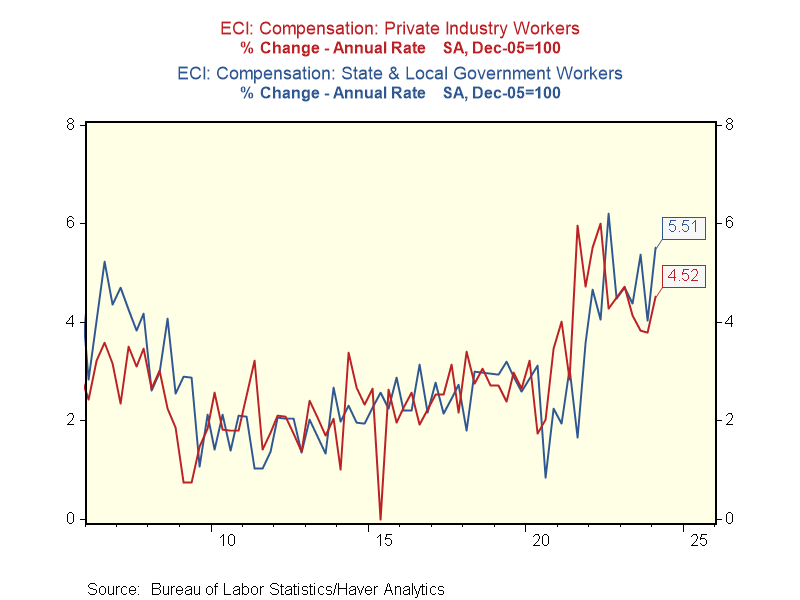
Plenty of indicators out there that show cooling labor costs. Unfortunately, the best one, the Employment Cost Index is not one of them. In Q1, the ECI Compensation Index unexpectedly accelerated to 1.2% SAAR from 0.9% in Q4 2023. This was the fastest quarterly pace since Q3 2022
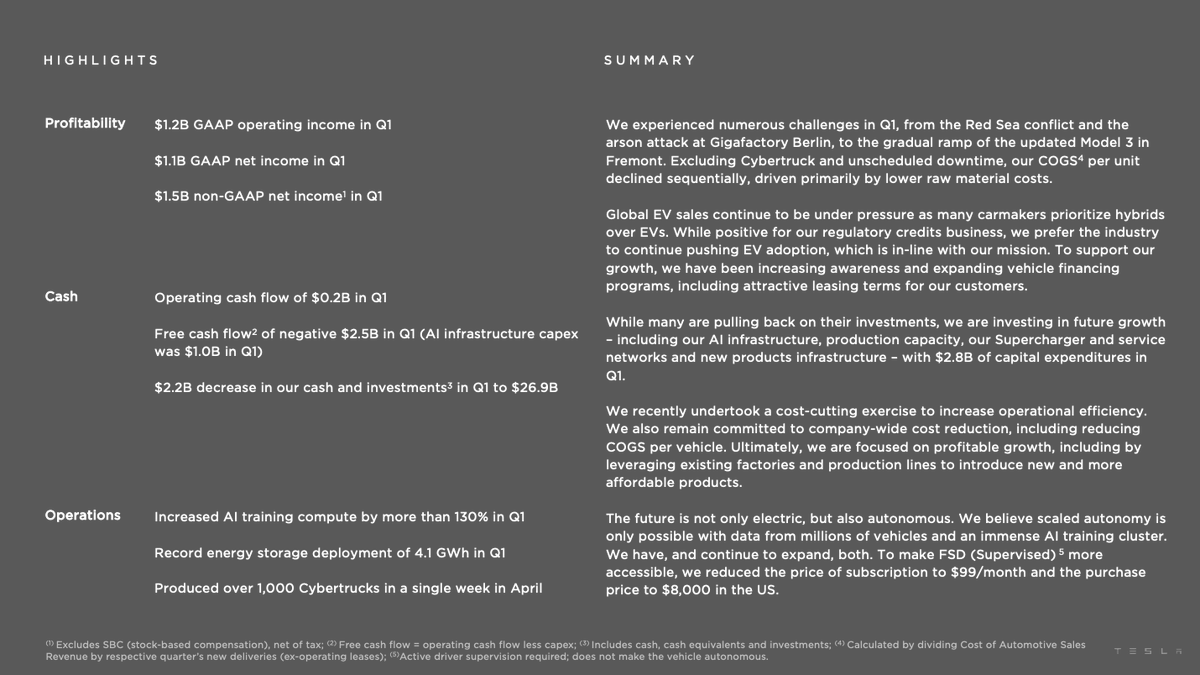
TSLA: "We have updated our future vehicle line-up to accelerate the launch of new models ahead of our previously communicated start of production in the second half of 2025. These new vehicles, including more affordable models, will utilize aspects of the next generation platform as well as aspects of our current platforms, and will be able to be produced on the same manufacturing lines as our current vehicle line-up."
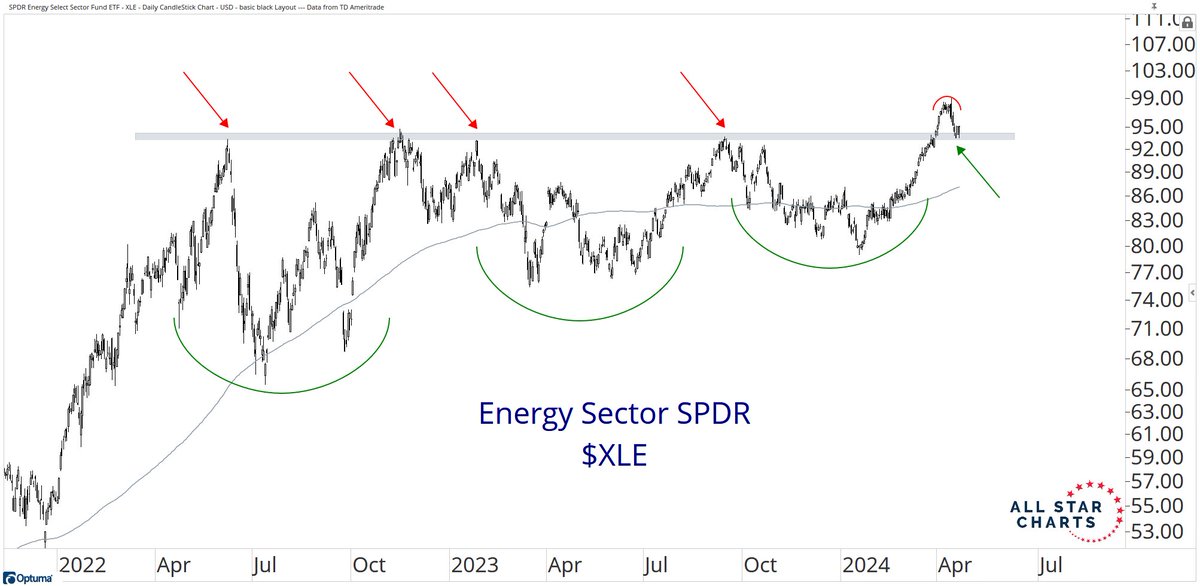
With a growing list of failed breakouts in various indexes, energy continues to stand out as a sector leader
Here's $XLE digging in and flipping resistance into support at a shelf of old highs
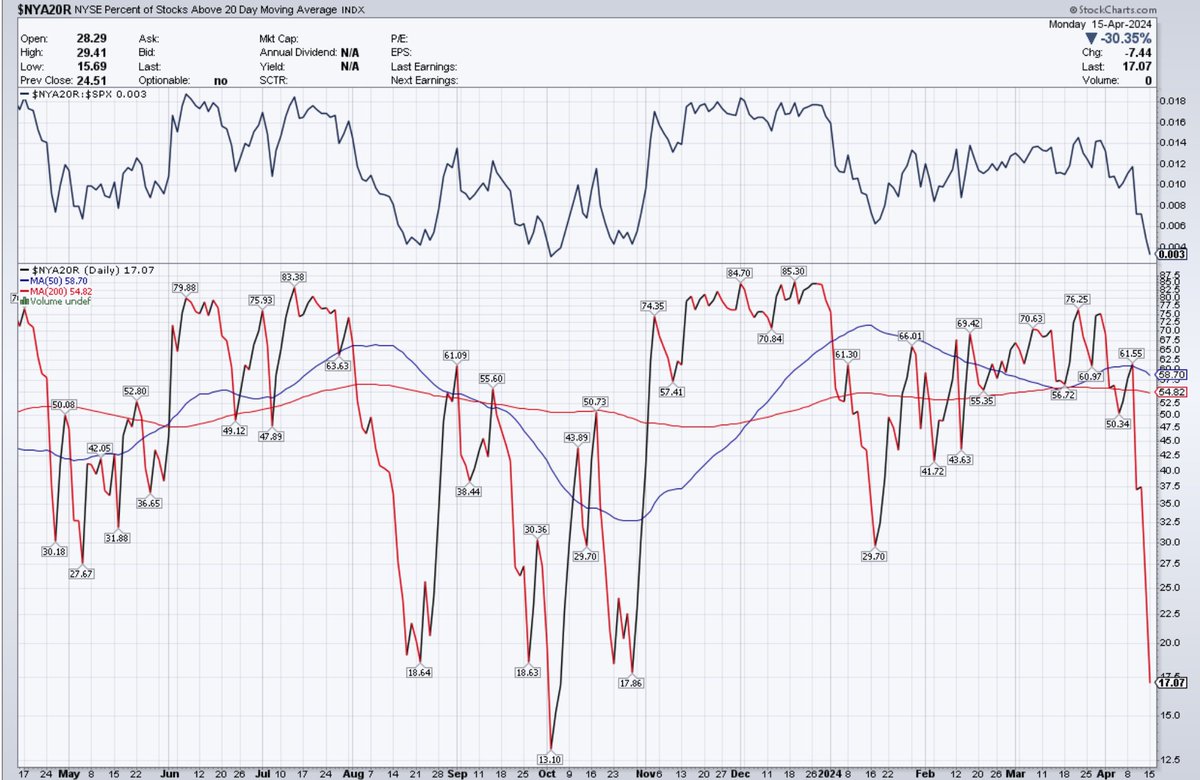
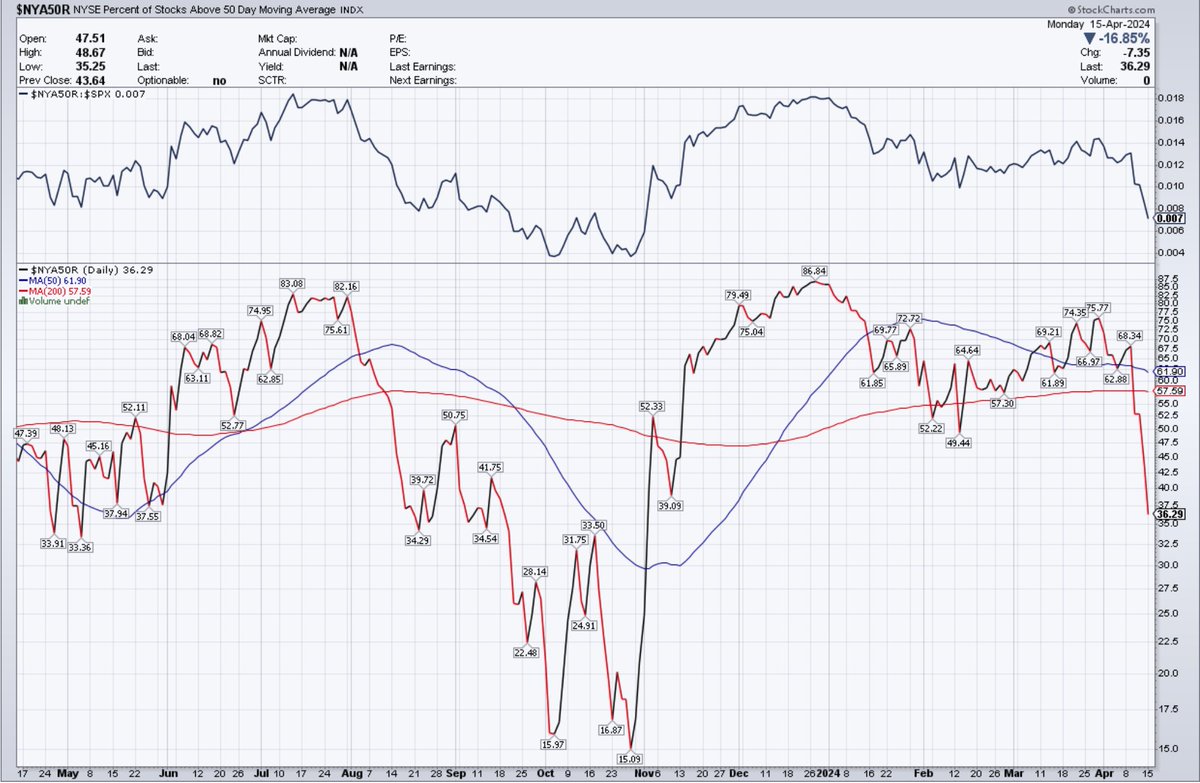
Two secondary charts I keep self aware of during pullbacks....%20R, %50R....20R is into the 15%ish level that can lead to relief rallies (NAMO also -62) but I pay more attention to %50R from swing/holding perspective and the 10-20% area best spot. I don't see any patterns I would want to buy and hold at present. Can change quickly but planning to be patient.
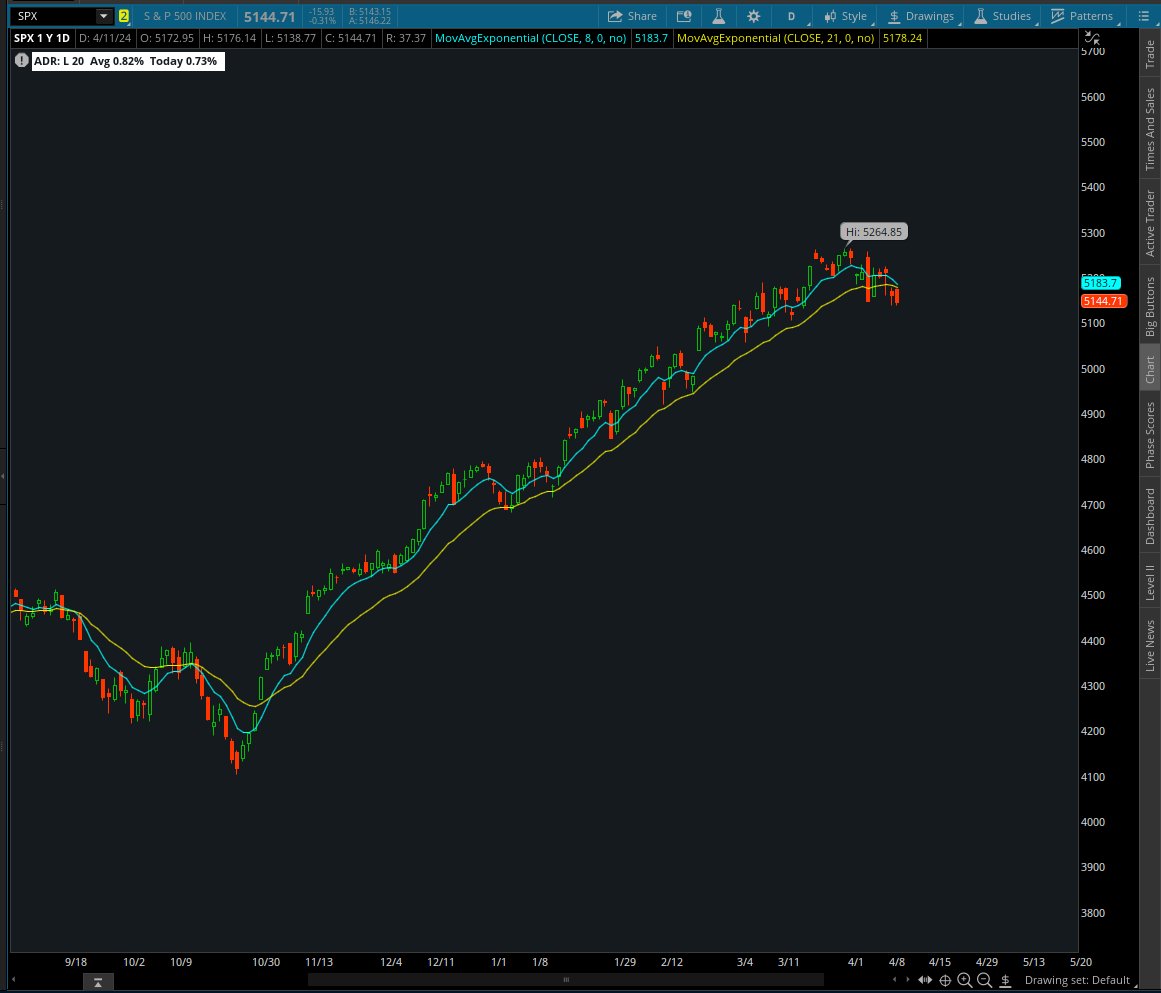
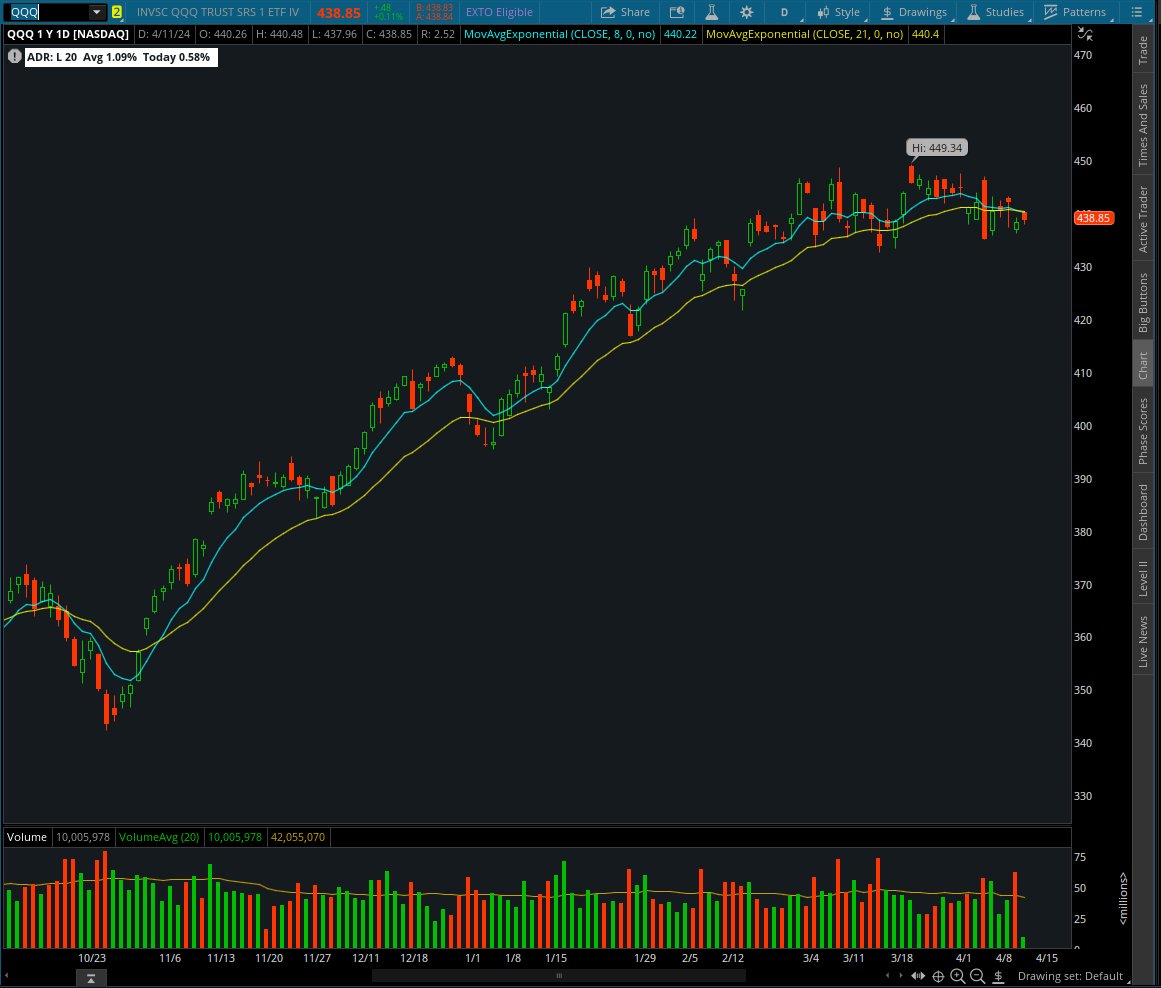
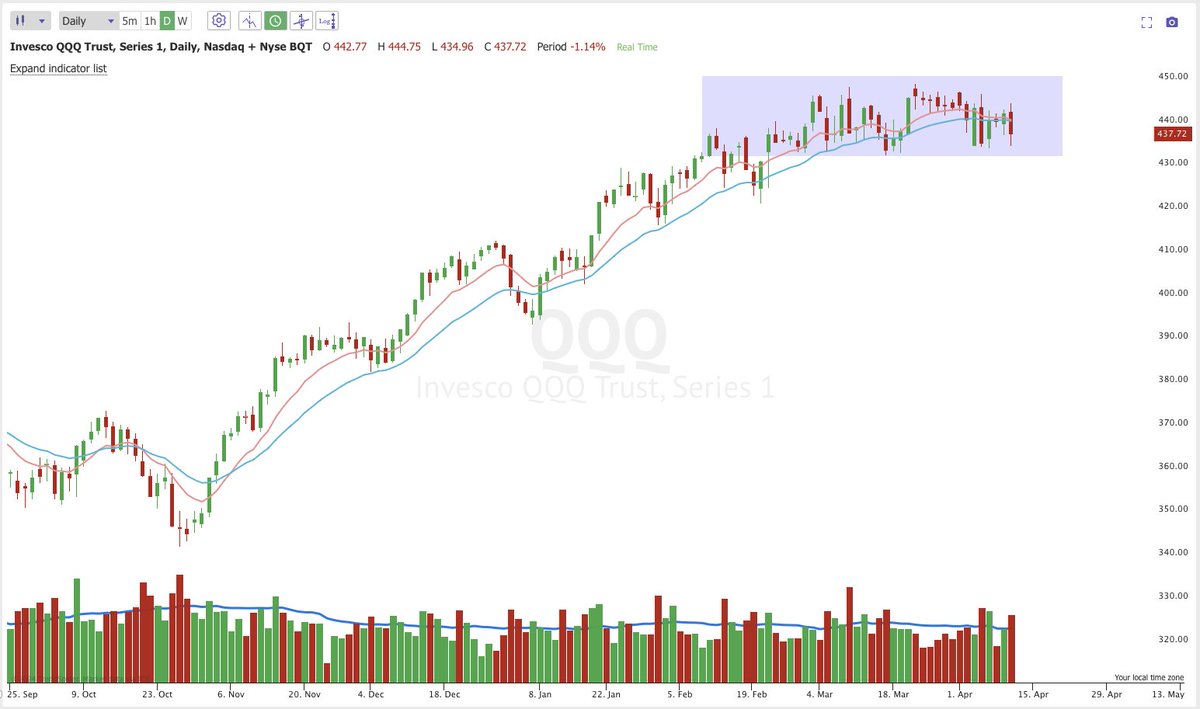
$QQQ Explains the more difficult trading that we have been seeing.
Basically sideways in a range for the past 2 months and now the 10/20-day are sloping down and price is below.
The best swing trading environments and "easy" money trading occurs when the Nasdaq is trending above the 10/20-day and the 10 is above the 20-day.
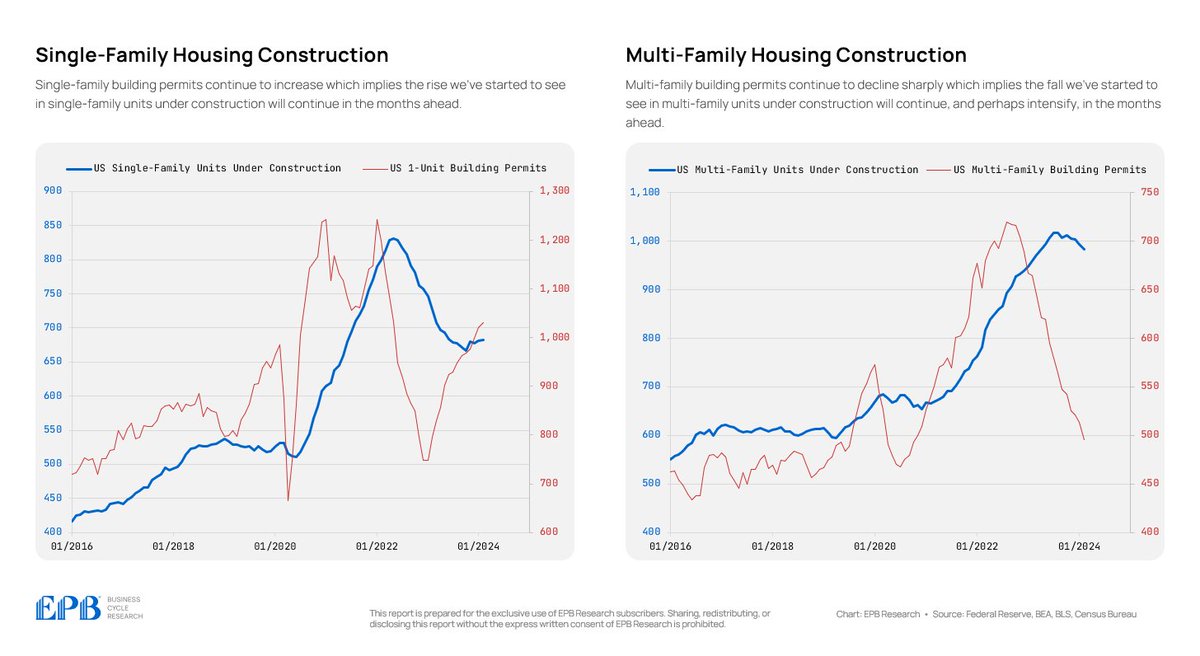
Single-family vs. Multi-family construction 📈📉
Single-family permits are rising, which will support a continued increase in single-family construction.
Multi-family permits are still trending sharply lower, so multi-units under construction have more room to fall.
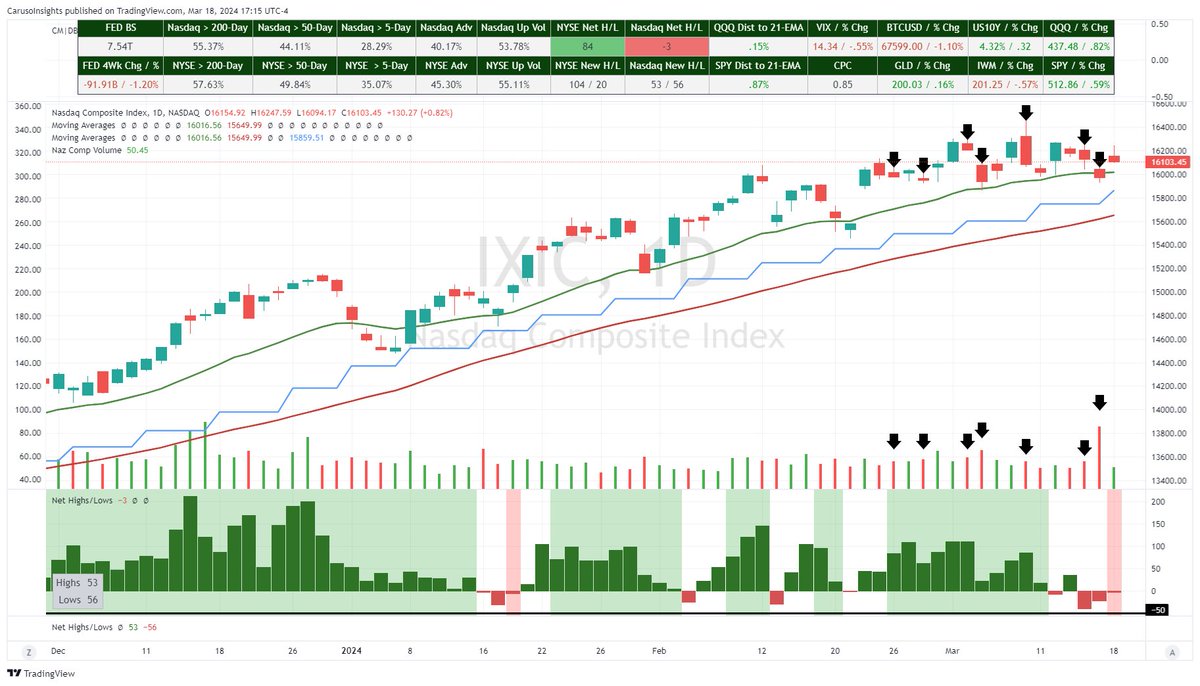
The Nasdaq Composite market has had 3 consecutive days of Net Lows despite indexes sitting near all-time highs (Red bars below chart). It has also undergone a spat of increased volume on down days and light volume on up days. The action is typical of a top (See 2021 chart below), and I'm looking for this to change before I deploy capital again.
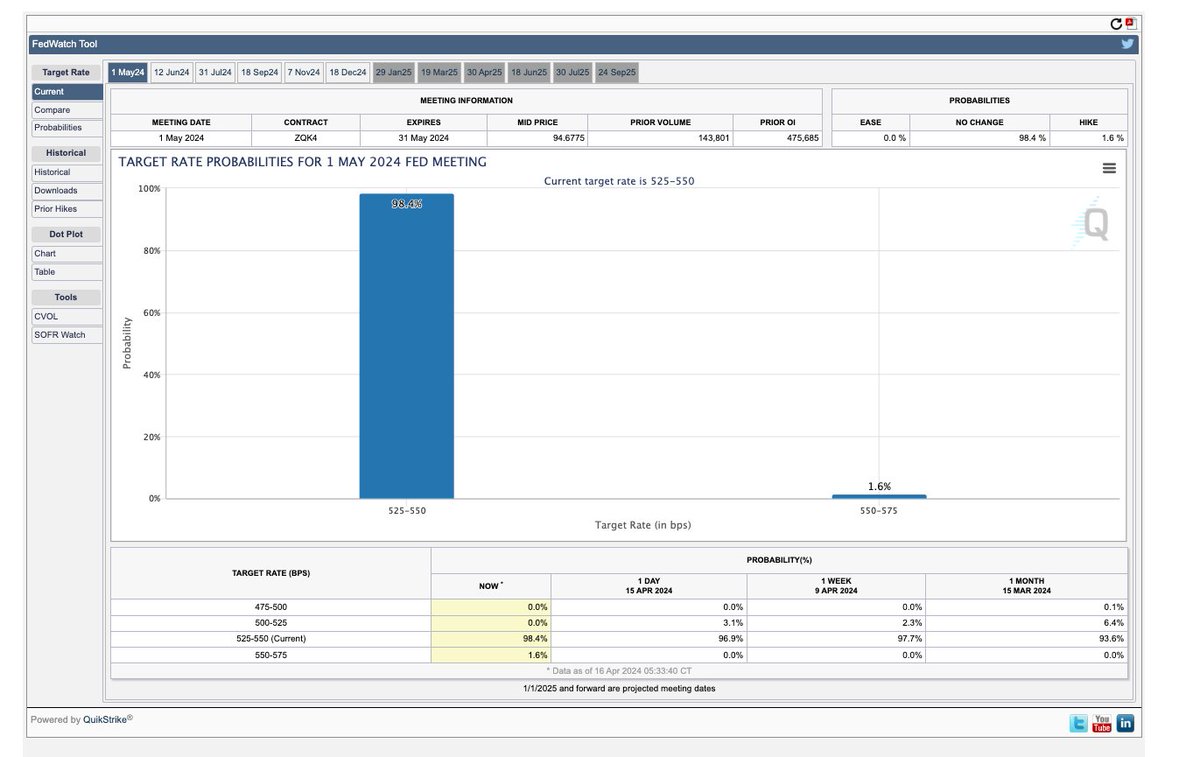
This week's FOMC decision and comments will be important in setting the stage for the market's next steps. $QQQ $NVDA
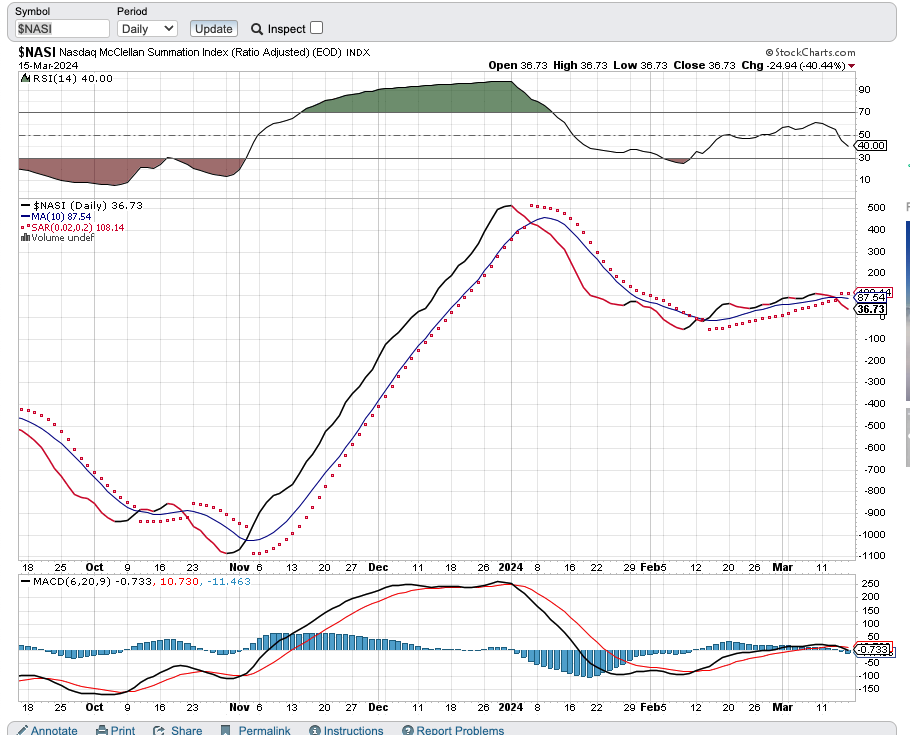
NASI barely could rally with its RSI almost hitting the overbought 70 level and now rolls over back below the 10-DSMA with RSI plummeting. The market's character has changed and we must listen.
NAAIM over 100 feels like a contrarian sell.
Turns out, the data suggests otherwise.
S&P 500 up a yr later 89% of time and up 15% on avg.
@jaykaeppel@sentimentrader