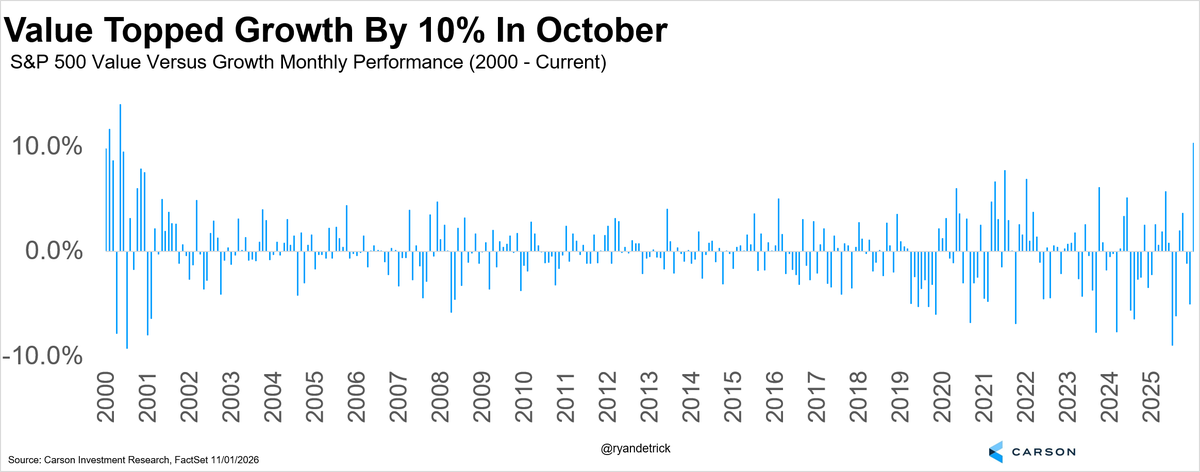
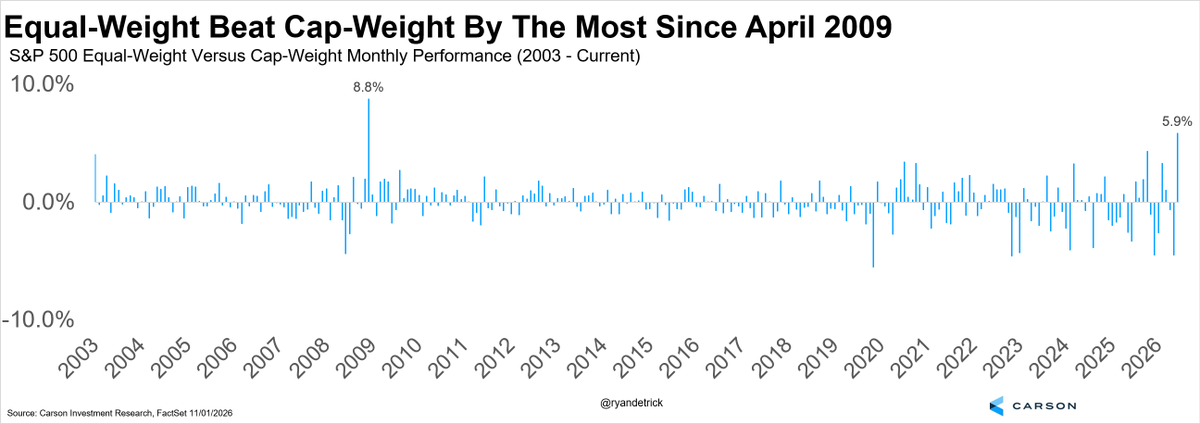
S&P 500 equal-weight beat the S&P 500 cap-weight by 5.9% in October.
That is the second largest outperformance ever, with only April 2009 larger.
April 2009 wasn't the worst time for investors.
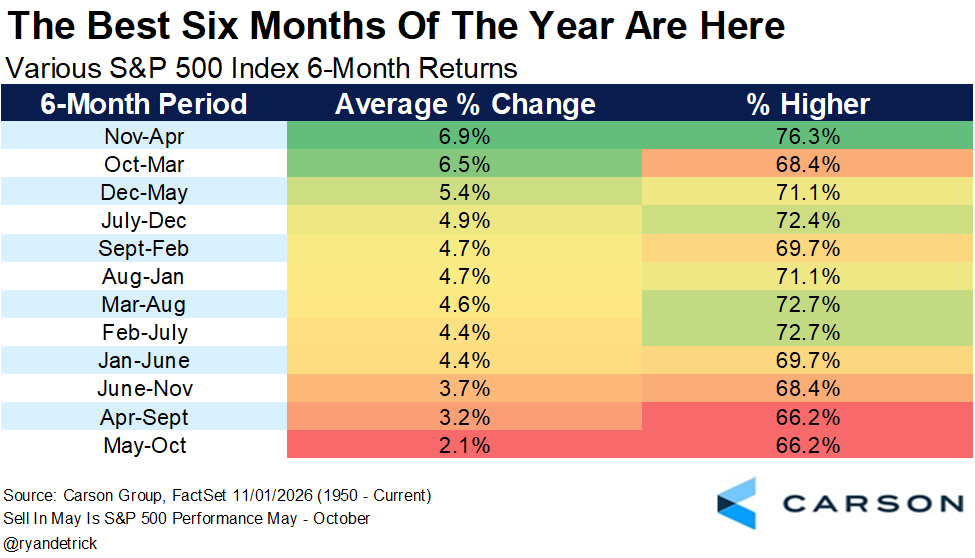
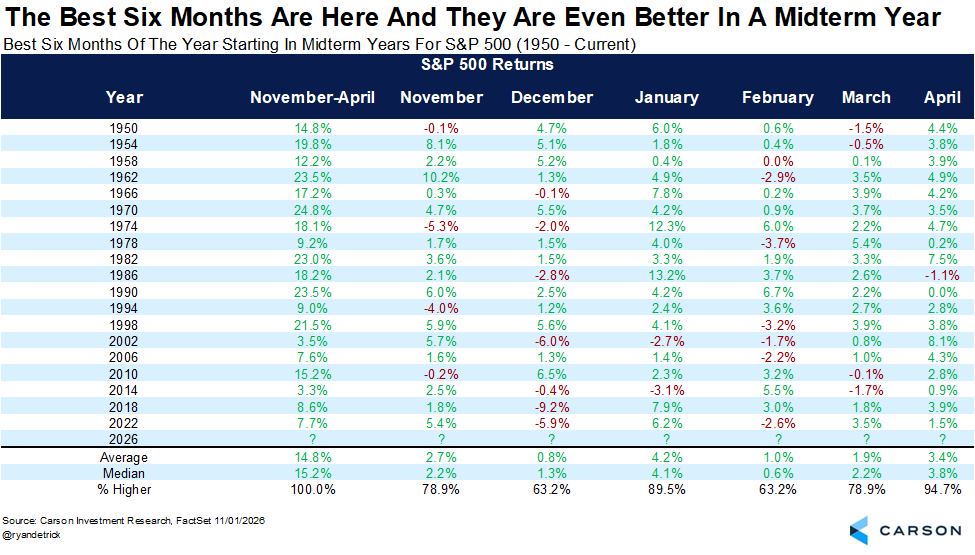
These next six months are historically the best of the year, but they are even better in a midterm year.
In fact, 19 for 19 times we've seen November - April higher when starting in a midterm year.
Will this time be different?
Honored to be quoted in MarketWatch discussing SpaceX ahead of its IPO.
A great company does not automatically make a great investment. Long-term returns depend on both the quality of the business and the price paid.
https://t.co/pxGc3udggg
Honored to be quoted in Business Insider.
Long-term investment success comes from disciplined valuation, diversification, and patience.
https://t.co/Cf5H7yVDKT
The bull market turns three this Sunday.
Just a reminder that the five previous bull markets (going back the past 50 years) that made it this far kept going.
Shortest was five years, the average was 8 years, and two made it to double digits.
The S&P 500 is about to be up 8 days in a row and >6% during the win streak.
3 of the past 4 times that happened it was >20% a year later.
Better than avg returns across the board going out a year.
More clues the lows are indeed in and this isn't a bear market rally.
Jevons paradox strikes again! As AI gets more efficient and accessible, we will see its use skyrocket, turning it into a commodity we just can't get enough of. https://t.co/omEcOPhdIz
For those interested, my Quantitative Finance paper on bitcoin, dubbed the "bitcoin black paper".
1) not a currency, 2) not a store a value, 3) not an inflation hedge, 4) does not protect ag. "tyranny", 5) not decentralized.
Effectively worth exactly 0.
https://t.co/HWE66WFH6Z
How did sectors do the first month after President Trump won in 2016 and then what happened the next year?
Energy, small caps, and financials soared, but then didn't do well all that well.
Tech was weak, then was the top group.
Awesome chart from @gilbert3142 of @CarsonResearch.
No, don't blindly invest in only seasonality, but we just left the worst two months and are now in the best two months of the year during an election year.
Umm, so we shared this chart in January (but it was bullish then).
It showed that if you had a lame duck President stocks peaked on July 18th. If you the President was up for re-election things tended to be just fine.
S&P 500 peaked on July 16 this year so far. 🤔
We've shared this a lot, but it continues to play out.
Yes, the first yr of the new bull was weak, but history said yr 2 would just play catch up.
That is absolutely happening.
Up 53% now from Oct '22, but avg bull two years off lows is 58%. A little more room before Oct?
The S&P 500 up close to 4% in June is really strong for historically a weak month.
But green in June during an election year is perfectly normal, as no month is up more often than June.
Can this rally continue? Be aware that July has been up nine years in a row for the S&P 500.
Over the past decade? Higher 90% of the time (tied with November for the best) and up 3.1% on avg (second only to Nov).