Independent researcher of Bitcoin on-chain data from own node.
Creator of Bitcoin Lab — Free Charts, API, Dashboard.
Follow for original research & commentary.
🎉Bitcoin Lab 2 is LIVE🎉
Real-time On-Chain Data, updated block-by-block🔥
• Charts — explore on-chain data visually
• Pulse — a status-at-a-glance dashboard
• API — raw data access to 350+ metrics
One-stop free onchain data
👉https://t.co/vlF6d3VhQT
Thread with demos ↓
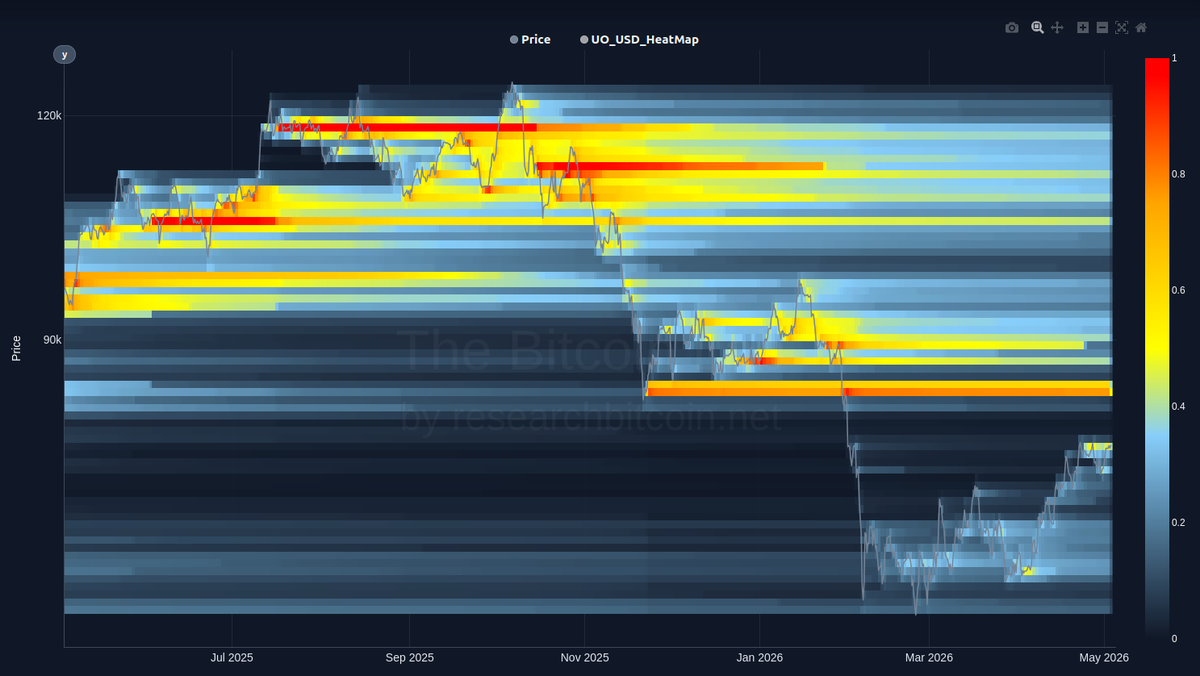
Who spent during the storm?
Bitcoin’s fall from $71K into the low $60K triggered one of the broadest redistribution events of the recent decline.
💥More than 500K BTC changed cost basis!
Let’s look under the hood.
The first pain came from price back from October 2025.
Then came the harder part: time!
Each failed bounce offered hope.
Each rejection extended the discomfort.
Eventually, some holders had spent long enough underwater to accept the loss.
Supply abandoned higher
🔴 $70.6K–$71.3K: −56K BTC
🔴 $71.3K–$72.0K: −57K BTC
🔴 $72.8K–$73.5K: −149K BTC
🔴 $73.5K–$74.2K: −39K BTC
The pattern is consistent with recent buyers capitulating after a prolonged period underwater.
But coins do not disappear.
They migrate.
Supply re-clustered lower:
🟢 $63.3K–$63.9K: +116K BTC
🟢 $63.9K–$64.5K: +50K BTC
🟢 $66.5K–$67.2K: +69K BTC
🟢 $67.2K–$67.8K: +39K BTC
🟢 $69.9K–$70.6K: +100K BTC
The clearest shift was from the $71K–$74K shelf into a new accumulation zone around $62K–$68K.
This is what a market reset looks like:
not only a drop in price, but a transfer of ownership from exhausted holders🫳 to buyers willing to absorb supply when confidence is scarce🫴!
Now the real test begins:
Can the new holders defend the shelf they just built? 🦬
Data is Driven by @ResearchBTCNow
#Bitcoin #BTC #Crypto
Bitcoin’s lower-range test is getting interesting. 👀
🧲The gap below we had worked as a magnet!
On the hourly frames during the drop, the $75k–$79k buckets started to capitulate. 🔴
That looks like weak hands getting flushed out.
Coins that were sitting higher in the active structure began repricing lower — not panic in isolation, but supply rotating into a new cost-basis zone.
Now the map looks different. 🟠
The low-$72k area has filled heavily, suggesting stronger hands may be starting to absorb the forced selling. 🟢
Below this zone, there is still a support shelf — and it’s not trivial. If macro pressure comes back, Bitcoin may still need to prove that shelf is real. ⚠️
For now, the structure looks like:
upper range rejection → weak hands capitulate → lower range absorption by stronger hands
The next question is simple:
Was this a healthy reset into support or just the first leg of a deeper repricing?
Let’s see what the world brings to the table. 🌍
#Bitcoin #Crypto #BTC
🔥Data is powered by @ResearchBTCNow
😫So… is Bitcoin under pressure?
Let’s break it down.
Since 15 May, BTC dropped from ~$81.3k to ~$77.6k.
On the surface, that looks weak.
And yes, there is clear stress:
🔻 Price moved lower...
🔴 Realised Profit/Loss was negative in most frames
⚠️ BTC is trading below key levels - STH cost basis and True Market Mean
🟢 But the active $76k–$82k zone still absorbed +112k BTC net
At the same time lower and upper zones thinned slightly:
🟢 Lower support zone
$66k–$71k
-22.5k BTC
🔴 Upper resistance zone
$84k–$90k
-7.4k BTC
The current trading range absorbed the supply.
That suggests while weak hands are being flushed out, demand is still stepping in around $76k–$78k.
💡The key nuance:
Demand exists here — but BTC is still trading below important behavioural levels.
Now the real question is simple:
Is $76k–$78k becoming the base for the next move higher… or just a temporary absorption shelf below STH cost basis? Time will show..
#Bitcoin #BTC #OnChain #URPD
🔥Data is powered by @ResearchBTCNow
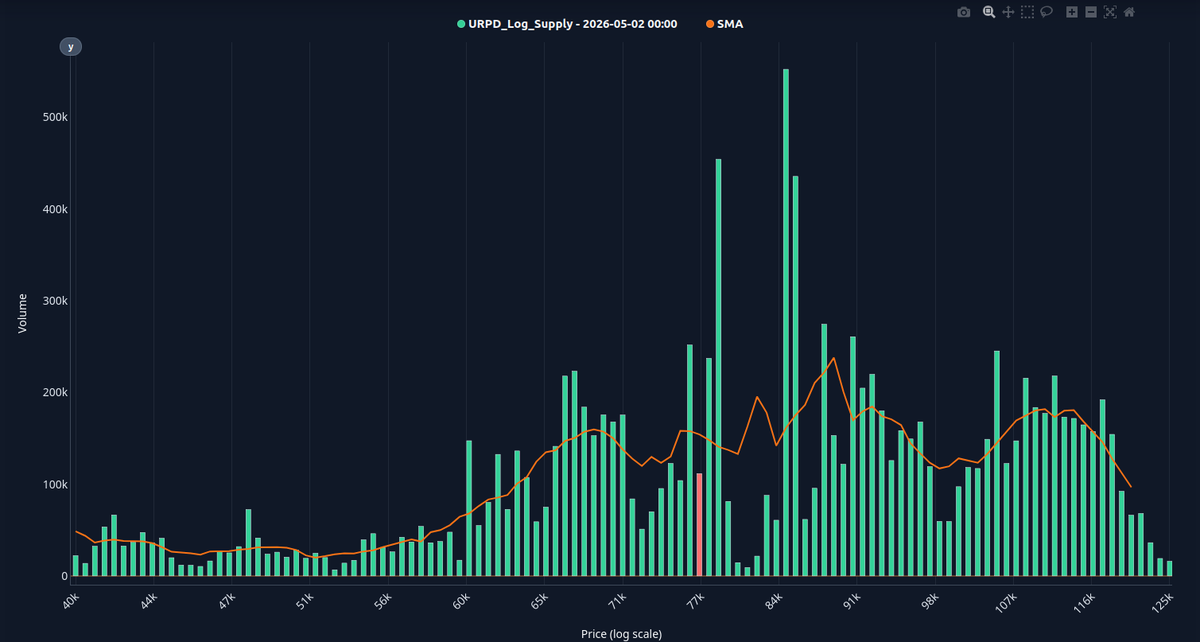
❓ Price barely moved… so why did Bitcoin’s supply map change so much?
From Apr 18 → May 17, BTC only rose ~2.2%…
But underneath the surface, the structure shifted dramatically.
🟢 The $78k–$82k cost-basis zone absorbed ~960k BTC
🔻 Lower bands thinned
🔻 Overhead supply reduced
🔁 Coins repriced closer to spot
This is why URPD animation matters.
It doesn’t show exact coin-by-coin movement , it shows the net redistribution of supply between snapshots.
And right now, the market looks less like “nothing is happening”…
…and more like a major repricing cluster is forming around current price.
So the real question is:
🧲 Is this absorption before continuation — or is the market getting heavier right where it stands?
#Bitcoin #BTC #OnChain #URPD
Powered by Data from @ResearchBTCNow
Is the probability rising that the ~$60k bottom is already in?
Let’s look at the mechanics of the latest tiny dip into high-$ 78k / $ 79k. 👇
From 12 May → 14 May, Bitcoin didn’t break down.
It absorbed the selling pressure well & rebalanced.
Lower bands thinned:
$65k–$70k: -19,312 #BTC
$70k–$75k: -8,246 BTC
$75k–$78k: -7,716 BTC
But the current spot zone absorbed supply:
$78k–$80k: +73,387 BTC 🔥
Meanwhile, overhead barely moved:
$80k–$82k: -9,882 BTC
$82k–$85.4k: -1,812 BTC
$85.4k–$90k: -2,765 BTC
This is the key:
The dip did not create panic.
It created cost-basis migration toward spot absorbing selling pressure.
Coins are moving from lower and nearby shelves into the current range, building a thicker base around $78k–$80k.
That does not confirm expansion yet.
The $83k–$85k wall is still overhead.
But it does suggest the market is reacting to dips with absorption, not collapse.
🟢So yes, mechanically, the probability that the deeper bottom is already in is rising as dips getting bought out/absorbed.
The next test:
Can Bitcoin hold this new $78k–$80k shelf and absorb the overhead wall?
If yes, this starts looking less like a bear-market bounce…
and more like early recovery becoming real. #Bitcoin
Data is powered by @ResearchBTCNow
#Bitcoin is still testing 78k with a fair chance to break through. If price flips this level, next stop is likely 84/85k.
Live URPD (cost basis) chart
👉https://t.co/WfCIlwTlxQ
Do your own research at The Bitcoin Lab - free Charts, Dashboard and API.
https://t.co/CWsmLarkTV
#Bitcoin still trading around the True Market Mean Price and Short Term Holder cost basis.
Interesting note🤓
Accumulation outweights distribution.
Live dashboard: https://t.co/DqipqjzvSK
#Bitcoin Lab Pulse dashboard provides a clear view:
Price on the verge of breaking STH and True Market Price (78k), while accumulation is dominant and execution pressure is neutral.
Last week it did not look this convincing, but situation is improving.
👉https://t.co/sv0W625tVl
#Bitcoin is still testing 78k with a fair chance to break through. If price flips this level, next stop is likely 84/85k.
Live URPD (cost basis) chart
👉https://t.co/WfCIlwTlxQ
Do your own research at The Bitcoin Lab - free Charts, Dashboard and API.
https://t.co/CWsmLarkTV
#Bitcoin is close to breaking 78-79k USD, the Short Term Holder cost basis and True Market Mean Price.
On-chain is more promising than last attempt in Feb, with stronger accumulation: https://t.co/VxYmFNZoE2
Follow on-chain. Free Charts, Dashboard, API
👉https://t.co/xNBJE2a32U
#Bitcoin Long Term Holders reaching new heights.
15.9 million BTC has not moved for 155+ days.
Almost 2 million BTC has acquired LTH status since Dec 2025.
This is the effect of accumulation, and current regime has been stable for months.
Live chart 👉 https://t.co/vRyL7gb1xW
🚨Bitcoin Lab Pulse dashboard is flashing extremes
Sentiment and sell-side execution pressure are at levels we typically see ~0–2×/year
Capital is rotating out of the Bitcoin network
Older coins are distributing—long-held conviction is being released
👉https://t.co/DqipqjzvSK
#Bitcoin Long Term Holders reaching new heights.
15.9 million BTC has not moved for 155+ days.
Almost 2 million BTC has acquired LTH status since Dec 2025.
This is the effect of accumulation, and current regime has been stable for months.
Live chart 👉 https://t.co/vRyL7gb1xW
Not saying price must go up. But, although price is in a wide range, a lot has changed under the surface.
For reference, the highest LTH supply ever occurred in Dec 2023 with over 16.25 million BTC.
Enjoy free charts, dashboard and API services at https://t.co/CWsmLarkTV
#Bitcoin is close to breaking 78-79k USD, the Short Term Holder cost basis and True Market Mean Price.
On-chain is more promising than last attempt in Feb, with stronger accumulation: https://t.co/VxYmFNZoE2
Follow on-chain. Free Charts, Dashboard, API
👉https://t.co/xNBJE2a32U
#Bitcoin Lab Pulse dashboard provides a clear view:
Price on the verge of breaking STH and True Market Price (78k), while accumulation is dominant and execution pressure is neutral.
Last week it did not look this convincing, but situation is improving.
👉https://t.co/sv0W625tVl
#Bitcoin Lab Pulse dashboard provides a clear view:
Price on the verge of breaking STH and True Market Price (78k), while accumulation is dominant and execution pressure is neutral.
Last week it did not look this convincing, but situation is improving.
👉https://t.co/sv0W625tVl
Bitcoin Lab Pulse is the first and only place I check the #bitcoin situation. It is on phone, in my car, on work computer and home computer.
It displays market sentiment, execution pressure, capital tide and conviction release.
Made for me, but I gladly share. It is free.
#Bitcoin Lab Pulse dashboard provides a clear view:
Price on the verge of breaking STH and True Market Price (78k), while accumulation is dominant and execution pressure is neutral.
Last week it did not look this convincing, but situation is improving.
👉https://t.co/sv0W625tVl