Nutrition Expert with great passion in Resolving Overnutrition and Undernutrition,Researcher,Writer,Youth Climate Activist, and critical thinker.0759001974.
UPDATE: Nutritionists have called on the government to introduce a tax on sugar-sweetened beverages, saying it would help reduce the consumption of sugary drinks, curb obesity and support healthcare funding. Prof Charles Muyanja of Makerere University's Department of Food Technology and Nutrition said the measure could help address rising cases of obesity, diabetes and other non-communicable diseases linked to excessive sugar consumption. The experts also welcomed recent increases in excise duty on cooking oil, sugar and cooking fat in the FY2026/27 budget.
#MonitorUpdates
📹: @PrinceWdavid
Yesterday, I participated in a discussion on how the Middle East conflict is adding new pressure to global food systems, hosted by @IFPRI, @CGIAR, and the @FCDOGovUK.
Amid challenges facing global supply chains, strengthening resilience and investing in analysis is critical.
💡 Every $1 invested in nutrition can generate up to $23 in returns.
At the Post-N4G G7 Side Event in Lyon DDG & @UN_Nutrition Chair Najat Mokhtar made the economic case for sustained action—even in a challenging global context.
Learn more : https://t.co/8ruiKUpH2B
#Nutrition
The 2nd ARUMDA–IAEA Workshop has been successfully completed @TIFRH_buzz
A big thank to all speakers and participants for the engaging discussions and knowledge exchange. #ARUMDA#IAEA#stableisotopes#metabolomics
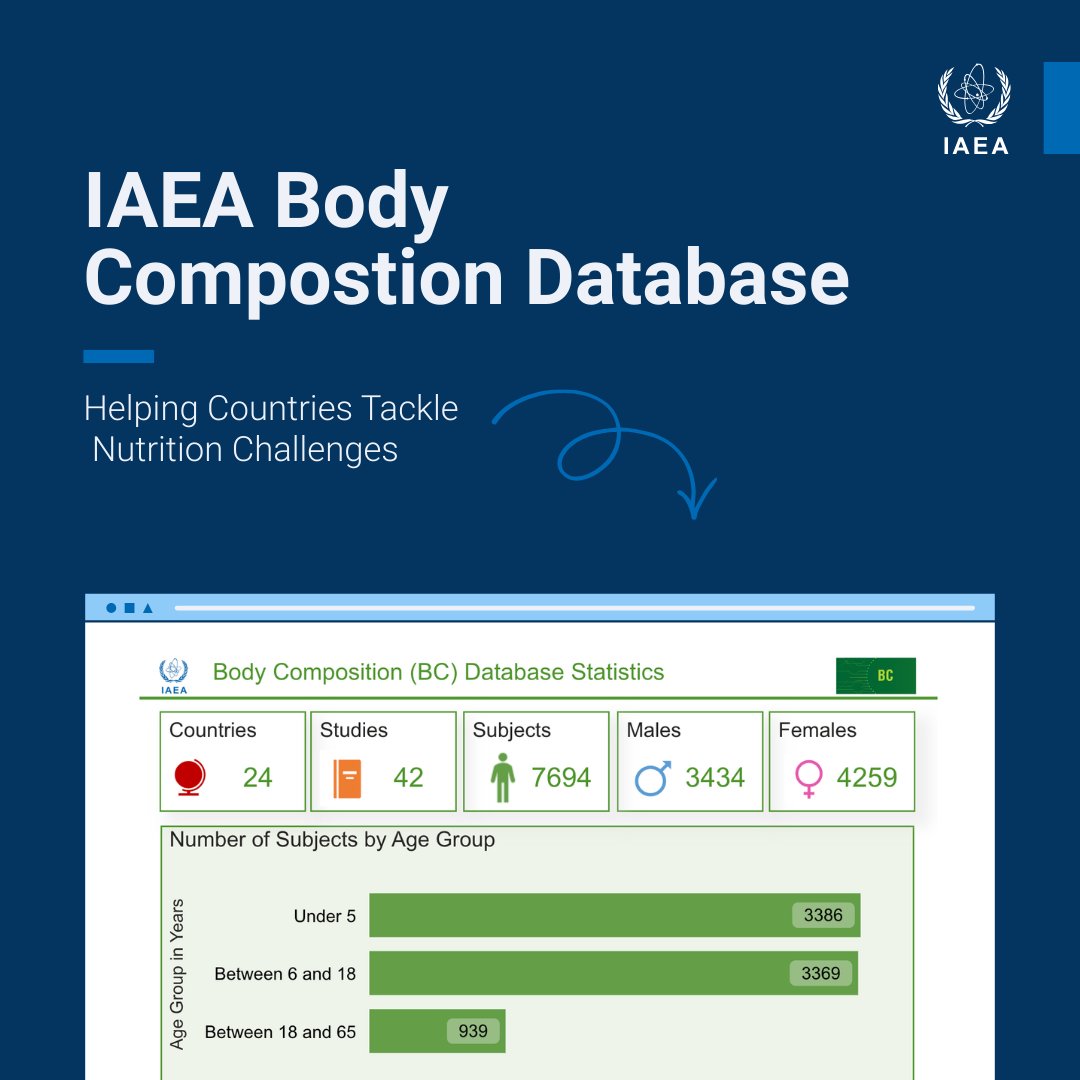
The obesity crisis is a major health concern affecting millions globally. The IAEA Body Composition Database is created to provide countries with resources to devise better health policies to combat obesity.
���� https://t.co/2Rb9AFYpQk
📢 We are hiring for many positions at the IAEA! Check all positions that are closing soon and apply before the closing date �📢 We are hiring for many positions at the IAEA! Check all positions that are closing soon and apply before the closing date �📢 We are hiring for many positions at the IAEA! Check all positions that are closing soon and apply before the closing date �📢 We are hiring for many positions at the IAEA! Check all positions that are closing soon and apply before the closing date �📢 We are hiring for many positions at the IAEA! Check all positions that are closing soon and apply before the closing date �📢 We are hiring for many positions at the IAEA! Check all positions that are closing soon and apply before the closing date 👇
Adding statistical test results directly to your plots is a powerful way to make your findings clear and accessible at a glance. With tidyplots, functions like add_test_pvalue and add_test_asterisks make it easy to display p-values or significance levels on your charts, helping viewers quickly understand the statistical differences between groups.
Using add_test_pvalue, you can place exact p-values between groups, as shown in the example plot, where p-values highlight the differences between treatment groups A, B, C, and D. Alternatively, add_test_asterisks enables you to display significance levels with asterisks, conveying statistical insights without detailed numbers.
✔️ Quick Setup: With just a few lines of code, you can emphasize significant differences between groups.
✔️ Clear Communication: These functions enhance readability by allowing viewers to easily interpret the significance of results.
✔️ Flexible Options: Customize the format, choose specific groups for comparison, and display either exact p-values or simplified asterisks.
The example plot shown here illustrates the use of add_test_pvalue to show p-values between treatment groups. Each line represents a comparison, with p-values displayed above. This example is taken from the tidyplots website: https://t.co/fgIWzxFVZI
To dive deeper into data visualization in R, consider joining my Data Visualization in R Using ggplot2 & Friends course. Click this link for detailed information: https://t.co/ztlEzoEDWv
#DataAnalytics #Python #ggplot2 #statisticians #DataViz #Statistics #tidyverse #database #VisualAnalytics #RStats #Rpackage #Python3
Effect size measures the strength of a relationship between variables or the difference between groups, providing deeper insights than p-values alone. It helps assess the practical significance of results, making it valuable in fields like psychology, medicine, and social sciences.
✔️ Provides Practical Insight: Quantifies the importance of results beyond statistical significance.
✔️ Enables Comparisons: Allows results to be compared across studies with different scales or sample sizes.
✔️ Supports Meta-Analysis: Useful for combining results from multiple studies.
✔️ Offers Flexibility: Includes measures like Cohen’s d, Hedges’ g, Pearson’s r, and odds ratios for different data types.
❌ Sample Size Sensitivity: Small data sets can produce unstable estimates.
❌ Over-Reliance Risk: Interpreting effect size without confidence intervals can be misleading.
❌ Assumption Sensitivity: Some measures assume normality and equal variance.
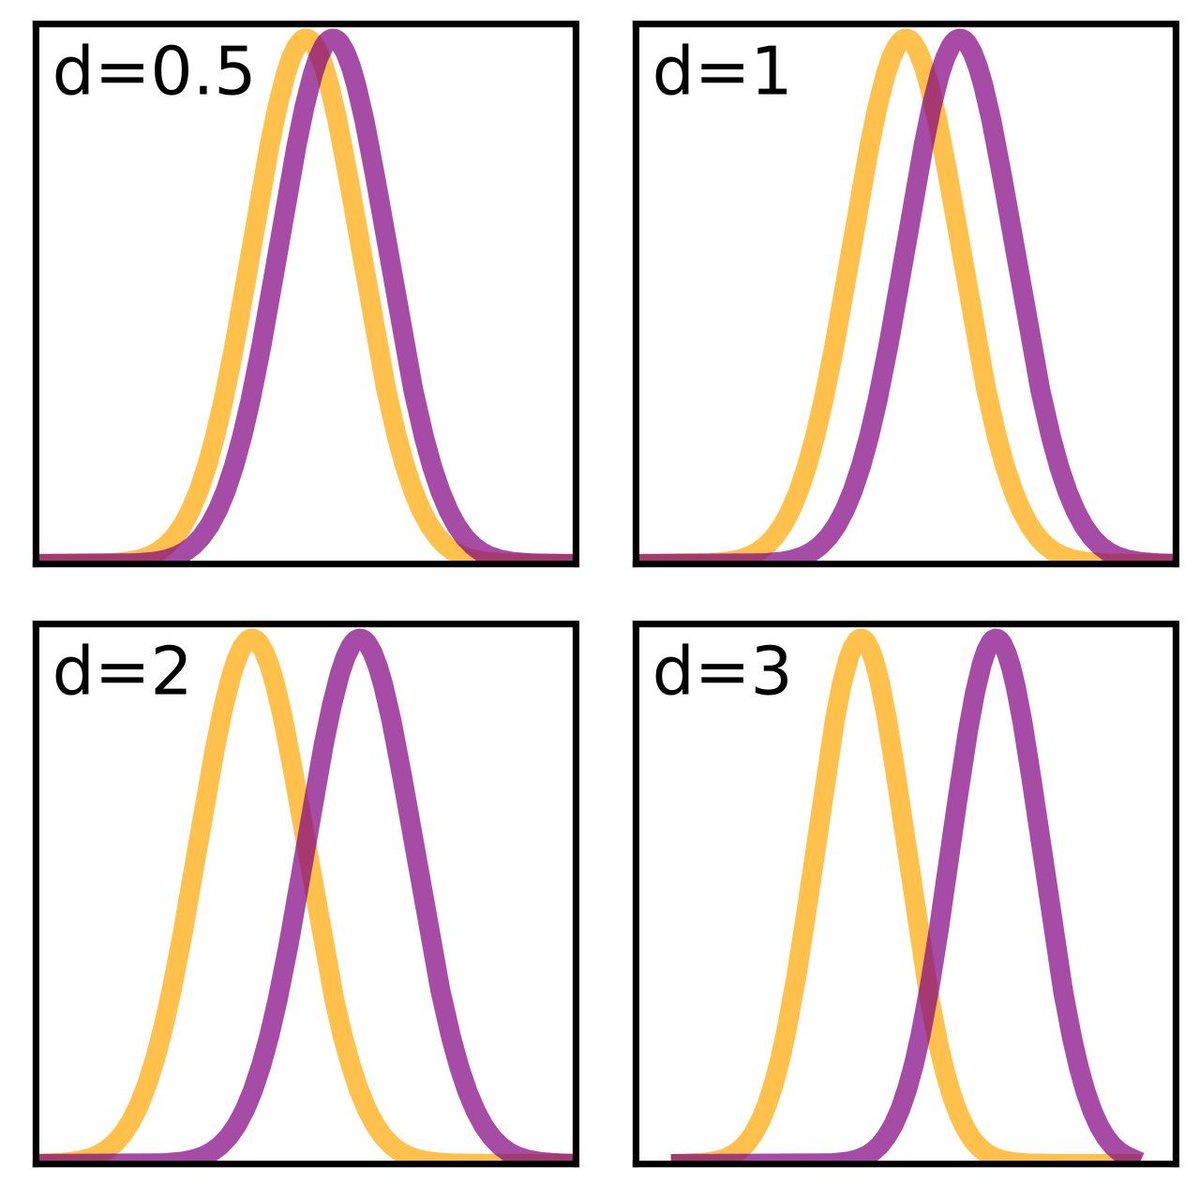
The image below shows plots of Gaussian densities illustrating various values of Cohen's d, highlighting how larger values indicate greater differences between groups. Image credit to Wikipedia: https://t.co/gXrrBbvMSj
🔹 In R: The effectsize package calculates Cohen’s d, Hedges’ g, and other measures, while the MBESS package provides confidence intervals.
🔹 In Python: The statsmodels library offers tools for effect size calculations, and the pingouin library provides user-friendly functions for a range of measures.
Looking to learn more about Statistics, Data Science, R, and Python? Subscribe to my email newsletter! See this link for additional information: https://t.co/ktUcWo9XpO
#Python #Statistical #datastructure #R #RStats
5 Signs You’re Improving Your Statistical Thinking:
1️⃣ You think in distributions.
You no longer view data as isolated points. Instead, you think in terms of distributions—mean, variance, skewness, and kurtosis. You understand that analyzing these aspects helps uncover the underlying patterns in your data.
2️⃣ You appreciate the value of sampling.
Random sampling and representative data are more than buzzwords to you. You understand the implications of sampling bias, how to design experiments to minimize it, and the impact it can have on the conclusions you draw from your data.
3️⃣ You consider statistical power in your analyses.
Before conducting a study, you think about power and sample size. You know that the probability of detecting an effect when it exists is crucial, and you calculate power to ensure that your tests are meaningful and well-designed.
4️⃣ You use model assumptions to guide analysis.
You don’t blindly apply models to your data anymore. You consider assumptions like normality in linear regression, independence in time series, or homogeneity in ANOVA. Knowing when to transform data, use non-parametric tests, or adjust your model is part of your analytical mindset.
5️⃣ You think beyond correlation to causation.
You know that "correlation is not causation," and you actively seek ways to establish causal relationships. You’re exploring tools like randomized controlled trials, natural experiments, or statistical techniques like propensity score matching to understand real cause-and-effect relationships.
Looking for more data science insights? Check out my free email newsletter. For more information, visit this link: https://t.co/ktUcWo9XpO
#Data #Statistical #pythoncode #Python #RStats
Big win for America's kids! 🥛 Whole milk is officially BACK in schools – loaded with real nutrients to help them grow strong and thrive.
A real, practical step to Make America Healthy Again.
Happening now: @HHSGov has announced beginning next fall, medical students in America will begin studying Nutrition as a part of their official curriculum
FINALLY 👏👏
RFK Jr. says we are moving to front-of-product labeling so people know exactly what they’re eating.
“And if you want to have a soda pop and a doughnut, that’s up to you.”
“We live in America, you ought to be able to make those choices.”
“But we are moving right now to front-of-product labeling.”
“We’re going to tell people exactly what’s in their food and whether it’s good for them or bad for them, and let them make healthy choices.”
I was happy to be invited to serve as a scientific advisor to HHS to help compile and analyze the substantial data that suggested a change in dietary guidelines was due. I’m very pleased with the result!
There is a strong link between food and disease. The food we eat can be the culprit or the cure. Time for the latter!
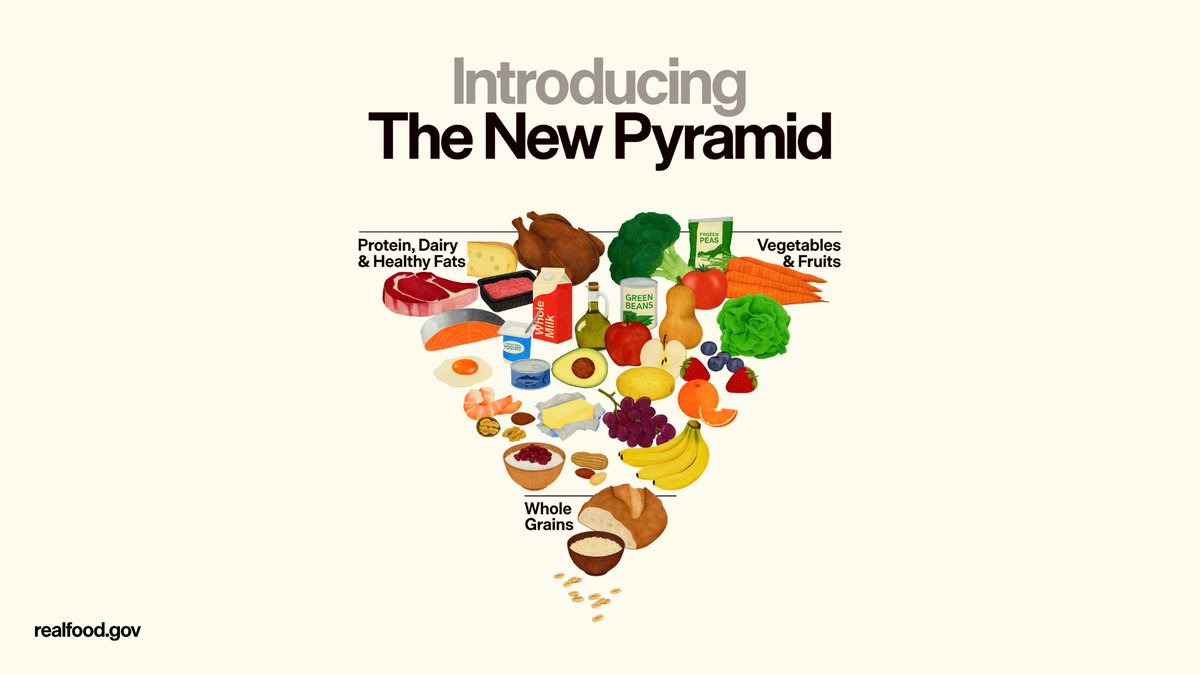
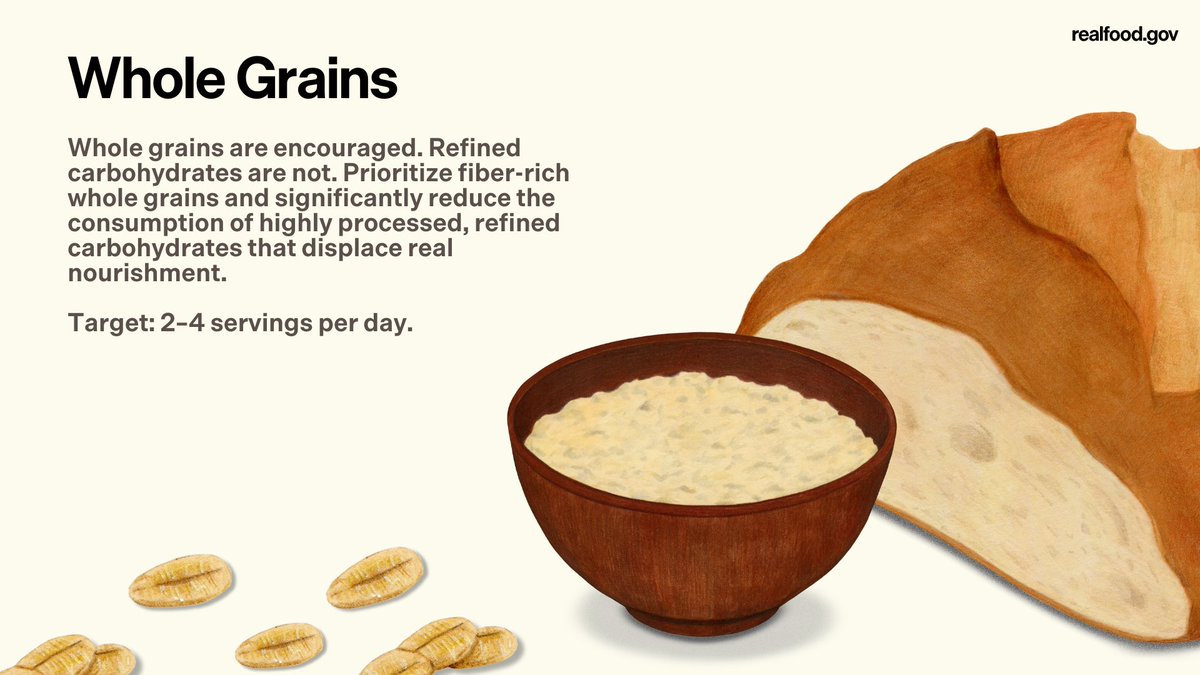
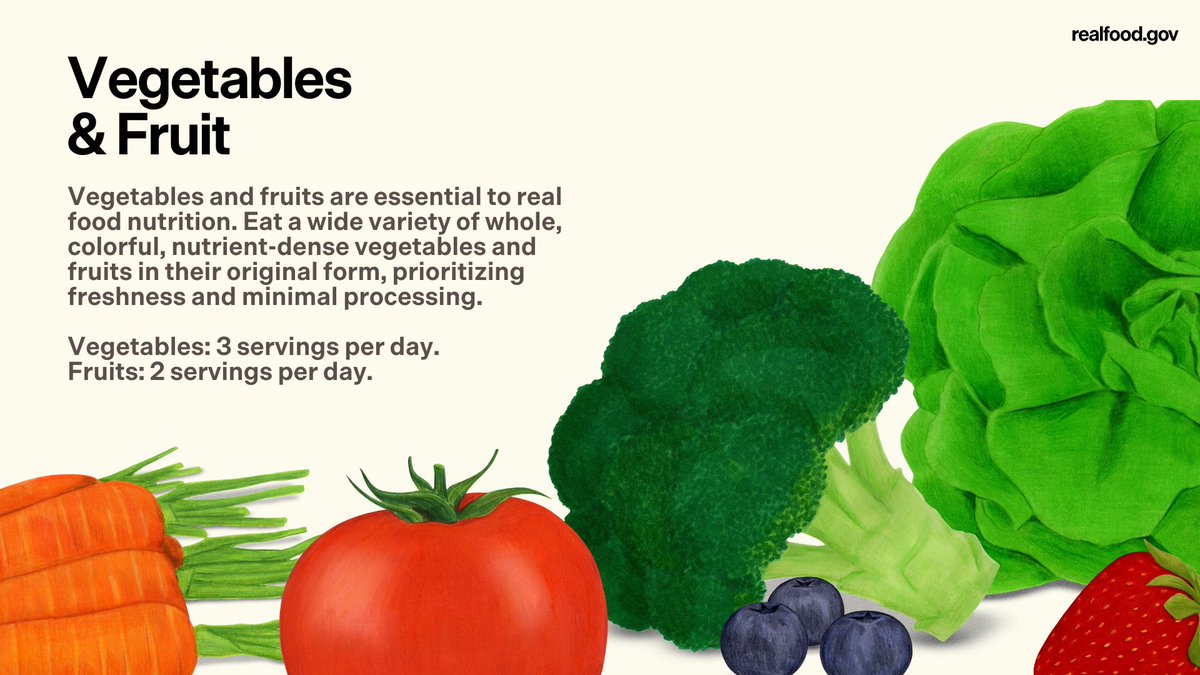
AT LAST UPDATED DIETARY GUIDANCE THAT MAKES SENSE !! Note the top line protein and green veg The bottom line starchy carbs. NOWHERE sugar or packets. Just eat real food. We have waited years for this HURRAH !
The new US Dietary Guidelines for Americans are slated to be released tomorrow! This policy is by far the most important nutrition reform of this administration.
Sadly, butter will not be back, after all. See this and other changes to the guidelines--a sneak peek in this column. No paywall.
https://t.co/M1Vt0px7OK
🚨Big news for Americans! Real food is BACK!
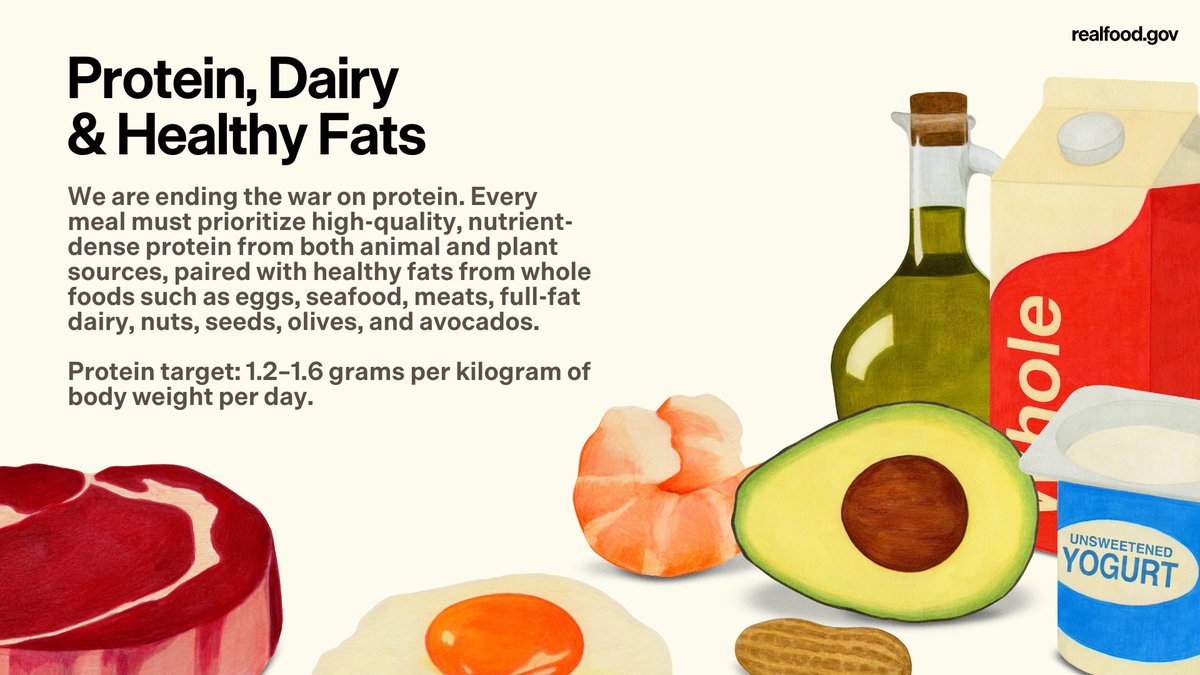
The Dietary Guidelines for 2025-2030, released today by @SecKennedy and @SecRollins, reestablish food—not pharmaceuticals—as the foundation of health and reclaim the food pyramid as a tool for nourishment and education.
🔗 https://t.co/abpubQBbr0
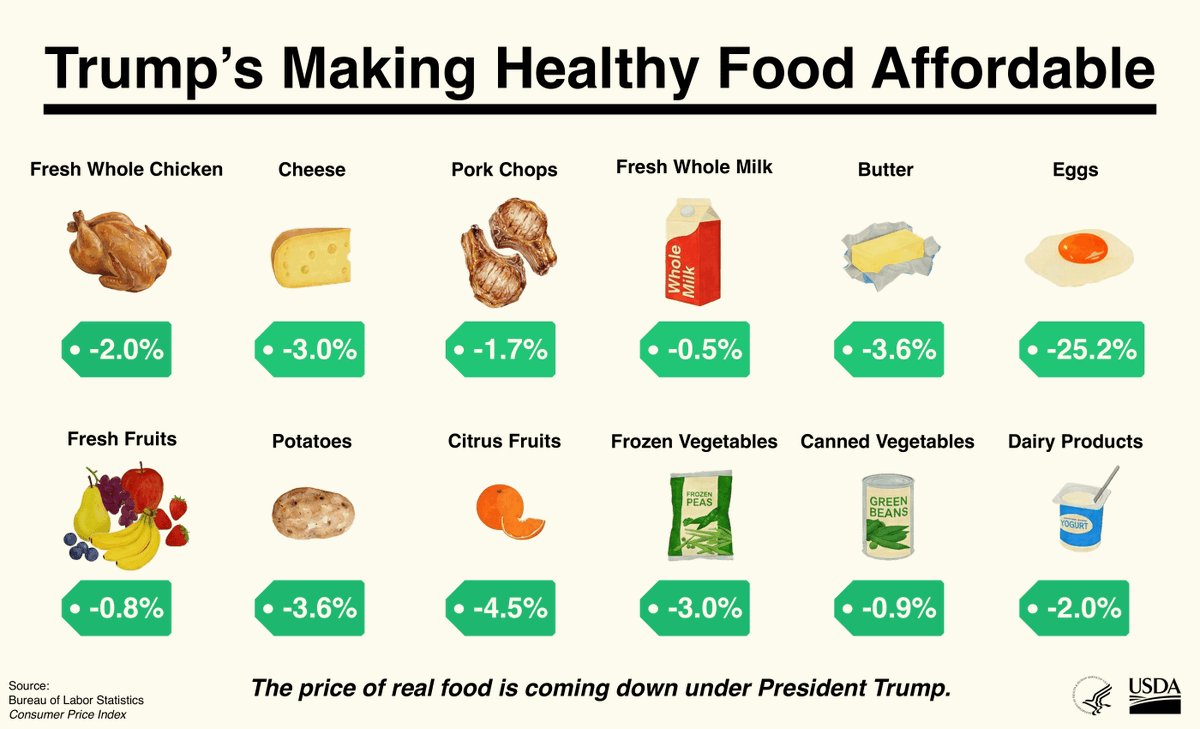
The cost of a poor diet is weighing heavily on America. Today, under President Trump’s leadership, common sense has been restored to federal food and health policy.
It's time we reduce healthcare costs & MAKE AMERICA HEALTHY AGAIN. 🥦🍇