Goldman Sachs just dropped the most precise map of where $7.6 trillion is going over the next five years and it tells you exactly which companies are standing in the middle of an unavoidable flood of capital (Save this).
The numbers are worth understanding precisely before talking about who benefits.
Goldman's baseline projects $765 billion in AI capital expenditure in 2026 alone, growing to $1.6 trillion annually by 2031.
Over the full 2026 to 2031 period, cumulative spend breaks down to $5.1 trillion in compute, $2.1 trillion in data centers, and $358 billion in power.
Nvidia is assumed to command 75% of all compute spend throughout the period, using the Rubin VR200 chip at $80,500 per GPU as the baseline.
The data center specification charts reveal how dramatically physical requirements are escalating.
A standard cloud data center runs 5–15 kW per rack while a transitional Blackwell era AI data center runs 130–200 kW per rack.
The AI factory of the future, running Rubin and Feynman silicon operates at 500+ kW per rack, at greater than 1 gigawatt scale, with liquid cooling only.
Traditional hyperscale data centers cost roughly $10 million per megawatt to build while the next generation AI data centers are being discussed at $15 to $20 million per megawatt.
Goldman identifies silicon useful life as the single biggest swing factor in the entire model.
At a 3-year replacement cycle, cumulative compute depreciation hits $3.99 trillion and at 7 years, it drops to $2.23 trillion, a $1.76 trillion difference on one assumption alone.
Power is only $358 billion of the total, but Goldman is explicit, it is the only component that can prevent the other 95% of the stack from deploying.
Amazon's Andy Jassy put it, "Our single biggest constraint is power." Connecting large data centers to the grid takes years.
Now here are the companies standing directly in the path of each layer of this capital.
Nvidia is still the most concentrated bet on the compute layer.
At 75% of $5.1 trillion in compute spend over six years, that is $3.8 trillion in cumulative revenue flowing through one company's products.
The 75% gross margin on data center GPUs is the reason every hyperscaler is trying to build custom silicon to escape it while simultaneously continuing to buy Nvidia because nothing else performs at the same level.
Vertiv is the direct infrastructure play on the data center upgrade cycle.
Every rack going from 40 kW to 500+ kW needs liquid cooling systems, power distribution, and thermal management infrastructure that simply did not exist at prior density levels.
Vertiv just deepened its liquid cooling capabilities through a strategic acquisition and was named a key partner on Hut 8's large AI-focused Texas data center campus.
The liquid cooling market is growing from $5.5 billion today to $15.75 billion by 2030, and Vertiv is the dominant provider in that market.
Vistra is the power thesis in its most direct form.
The $358 billion power segment is the critical path for the entire $7.6 trillion, and Vistra has spent the last 18 months locking up that critical path through long-term nuclear power purchase agreements.
Vistra secured a 20 year agreement with Meta for over 2,600 MW of nuclear energy, plus a separate deal with AWS from its Comanche nuclear facility.
Goldman Sachs and Jefferies both upgraded the stock after the Meta deal was announced.
The architecture of this trade is simple.
Goldman's model is not a prediction of whether AI spending happens but rather a model of the minimum physical capital required to deploy infrastructure that has already been contracted, already been announced, and is already under construction.
The compute layer requires the chips, data center layer requires cooling and power infrastructure and the power layer requires nuclear at scale on multi-decade contracts.
All three layers are being funded simultaneously, and all three have identifiable public companies sitting directly in the path of the capital.
Come join Milk Road Pro and get our full $7.6 trillion infrastructure breakdown which names across compute, data centers, and power we're currently positioned in and our full thesis on the AI trade.
Link below!
🚨 EVERYTHING THAT COULD GO WRONG FOR MARKETS WENT WRONG TODAY.
S&P 500 down -1.65%, wiping out $1.14 trillion.
Nasdaq down -2.60%, wiping out $1.11 trillion.
Gold down -3.38%, wiping out $1 trillion.
Silver down -6.9%, wiping out $280 billion.
Bitcoin down -6.31%, wiping out $80 billion.
In total $2.5 TRILLION wiped out in a single session. These were not isolated moves. Everything started breaking at the same time.
It started with the jobs report this morning.
The US economy added 172,000 jobs in May. Wall Street expected 88,000. That is almost double.
On any normal day, strong jobs is good news. But inflation is already at 3.8% and oil is sitting at $90. A labor market this strong tells the Fed it cannot cut interest rates and may actually need to raise them.
The probability of a rate hike this year went from 40% to 57% in a single day. That spooked every investor holding tech and growth stocks because higher rates mean those stocks are worth less today.
Then the AI trade started cracking.
Yesterday Broadcom reported record earnings: revenue up 48%, AI chip sales up 143% and the stock still crashed 12.6%. The reason was simple.
Broadcom did not raise its AI revenue targets for the year. Investors had expected it to. That single miss made people ask a question they had been avoiding for months: are we paying too much for AI stocks?
That question got louder today when a research firm called SemiAnalysis revealed that Nvidia's next-generation AI chips will need significantly less memory than everyone assumed, roughly half of what the market was pricing in.
Memory chips are what companies like SK Hynix and Samsung make. SK Hynix fell nearly 10% today. Samsung fell over 6%.
South Korea's entire stock market crashed 5.5% in a single session. Japan's semiconductor stocks did the same.
And then Anthropic added fuel to the fire by publishing a report warning that AI is getting close to the point where it can improve itself without human help and calling for a global pause in AI development.
Coming on the same day as the memory demand news and Broadcom's miss, it fed a single growing fear across the market: what if the AI boom is moving faster than the business models can keep up with?
Underneath all of this, there is a liquidity problem nobody is talking about.
SpaceX goes public next week at a $1.75 trillion valuation. Anthropic just filed to go public. OpenAI is next.
These three companies together are worth $4 to $5 trillion. Fund managers need cash to buy into these listings.
But cash levels are already at their lowest since early 2024. The only way to raise cash is to sell what they already own. That selling is happening right now.
The new Fed Chair Kevin Warsh will also hold his very first policy meeting in 11 days. He was appointed by Trump with the expectation of cutting rates.
He is now walking into a situation where inflation is high, oil is high, and the job market is running hot. Investors do not know what he will do.
When nobody knows what the most powerful central banker in the world will decide in less than two weeks, the safest move is to reduce risk today.
Everything that could go wrong, went wrong at the same time. A hot jobs report, a collapsing ceasefire, a crack in the AI trade, a trillion dollar liquidity drain, and a Fed meeting with no clear outcome.
What happened: the selloff changed character through the day.
Morning was sorted, AI and rates names red, defensives green. Rotation. Now the whole board's red, even safe names. That's liquidation. Strong jobs killed the cut story, but the shape is mechanical: VIX up 30%+ forces levered funds to cut at once. BTC -50% is the same flush.
What just happened?
The S&P 500 just erased nearly -$2 TRILLION of market cap just hours after 3rd strongest US jobs report in 18 months.
Meanwhile, Bitcoin is officially down over -50% from its record high in October 2025.
What's happening? Let us explain.
(a thread)
If you had $1,000,000,000, what would you do with it?
If you want our suggestion, investing over the long term, using macroeconomics to help you, is the best option for you.
J.P. Morgan pays $650,000+ a year for quants.
They built this exact Python training to get you there & released it for free.
Zero to quant directly from J.P. Morgan technologists.
Bookmark this before someone takes it down:
Traditional risk models were not built for hedge funds. Value-at-Risk, beta, mean-variance analysis.
Did you know this?
Andrew Lo published the full framework.Survivorship bias. Liquidity risk. Nonlinear exposures.
🔥 "The Volatility Edge" Esta estrategia de volatilidad hizo +86,9% en 2008, el año que el S&P 500 se desplomó 36,8%. Y rinde 16,3% anual desde entonces cobrándole el miedo al mercado
Zarattini y Aziz, los mismos del paper de ayer, se juntaron con Antonio Mele, profesor del Swiss Finance Institute, para atacar el trade más temido del mercado: vender volatilidad
La idea de fondo es simple. El VIX sobreestima la volatilidad que después se materializa el 80% del tiempo, porque la gente paga de más por asegurarse
El que vende ese seguro cobra una prima. El problema es que cobrás de a poquito y cada tanto viene un 2008 o un COVID y te lleva puesto
El paper arma 4 versiones de la estrategia, de la más naive a la más fina, usando solo ETNs de VIX que opera cualquiera:
- Pasiva, siempre vendido: 6,2% anual, Sharpe 0,48, drawdown de 32%
- Con filtro de prima esperada: 6,9% anual y menos drawdown
- Sumando la pendiente de la curva del VIX, y si se invierte se pone COMPRADA de volatilidad: 10,5% anual, Sharpe 0,87
- Con tamaño dinámico según el nivel del VIX: 16,3% anual, Sharpe 1, correlación de 15% con la bolsa
Los años bravos son una bestia:
- 2008: +86,9% contra -36,8% del S&P
- 2020: +42,3%
- 2022: +1,8% contra -18,2% del S&P
Todo neto de costos de transacción. Y el detalle que más me gustó: publicaron el código Python completo para automatizarla por la API de Interactive Brokers, gratis
Para no vender humo: vender volatilidad ya fundió gente, XIV cayó 97% en UN día en 2018 y lo terminaron cerrando. La diferencia entre cobrar la prima y volar por los aires son las reglas y el tamaño de la posición
Mi conclusión: la volatilidad dejó de ser terreno exclusivo de los hedge funds, pero es un seguro que cobrás de a centavos y pagás de a millones si no tenés reglas
Link al paper en el primer comentario
+63.9% this year with -16.9% drawdown so far.
And I will share 100% of the rules here.
Not from AI.
Not from some complex quant model.
Just a very basic monthly Nasdaq 100 rotational system.
The rules:
* Trade only when $NDX is above its 200-day moving average
* Every month scan Nasdaq 100 stocks
* Keep only stocks above their own 200-day moving average
* Keep only stocks with positive 250-day percentage change
* Rank them by 250-day percentage change
* Buy the top 10
* Hold for one month
* Repeat
That is it.
No prediction.
No macro forecasting.
No discretionary chart reading.
No secret sauce.
Just:
market regime filter
stock trend filter
momentum ranking
monthly rebalance
Of course, not every year will look like this.
Some years will be choppy.
Some years will underperform buy and hold.
Some years will feel too simple to trust.
But this is exactly why I trade systematically.
The edge is not in predicting the next winner.
The edge is in building a repeatable process.
And once you understand the basic concept, you can push it much further.
A great way to start testing this properly:
RealTest + Norgate data.
Especially because Norgate gives you survivorship-bias-free Nasdaq 100 constituents through history, so you are not accidentally testing today’s winners in the past.
🚀 Master Claude Code Like a Pro
Learn: • MCP integrations • Multi-agent workflows • Memory systems • Prompt engineering • Automation workflows • Essential slash command
Claude Code is more than a chatbot it’s a powerful AI workspace for developers
creators and builders.
Inflation in Europe is rising rapidly:
Eurozone Manufacturing PMI Input Prices spiked to 80 points in May, the highest since May 2022.
This also marks the largest monthly increase in costs for firms over the last 4 years.
Furthermore, PMI Output Prices surged to 62 points, the highest in 3.5 years.
The rate companies are increasing the prices they charge for goods they produce has surged +12 points, or +24%, since the start of 2026.
This surge has been primarily driven by rising energy and raw material costs.
Meanwhile, supply chain delays are up to the highest level since the pandemic supply squeeze of 2022, adding further pressure on prices.
As a result, factories are forced to pass higher costs on to customers, which will push inflation even higher over the next few months.
Price pressures across Europe are accelerating.
Well, I did warn that Zcash ($ZEC) was developed from technology originating at Tel Aviv University, involved a venture-funded private company that charged a 15% founders’ tax on mining, had prominent Zionist investors such as Barry Silbert, and relied on assurances from Zionists such as Peter Todd that the keys had been destroyed.
Based on those factors, I viewed it as a questionable Mossad honeypot.
You can search my history for warnings about this one.
BREAKING.: Biggest privacy token $ZEC crashed over -50% in the last 24 hours and wiped out $5 Billion from its market cap.
The flaw was hidden inside Zcash's Orchard privacy pool since May 2022 and remained undetected for nearly 4 years despite multiple security audits.
Security researcher Taylor Hornby reportedly used Claude Opus 4.8 AI model to build a working proof-of-concept that successfully generated counterfeit ZEC in local testing on May 29.
Although the bug has now been patched on June 2, The issue is that Zcash's privacy design makes it impossible to know if any fake ZEC was minted before the fix. Unlike Bitcoin, where anyone can verify the supply, Zcash's privacy design makes it impossible to audit whether fake coins were secretly minted before the fix.
The team denies any fake ZEC was minted, but traders are selling on the fear alone. Imagine someone secretly adding extra chips to a casino, but because of the way the system works, neither the casino nor the players could tell which chips were real and which were fake.
Shielded Labs is exploring a proposed Network Upgrade to allow anyone to verify the integrity of Zcash supply.
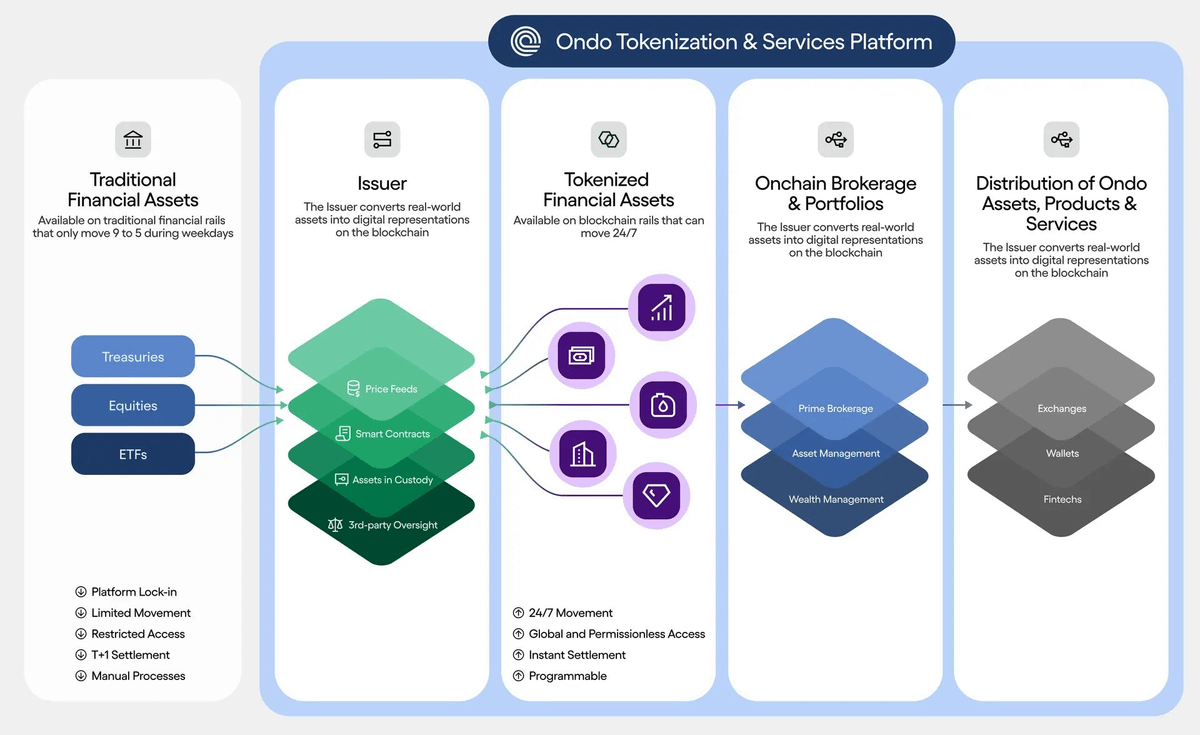
The next financial system is being shaped.
Ondo is building the tokenization engine, distribution network, and institutional standard to power the next phase of global markets.
The legacy financial system was built for the few, tokenization is opening it up to everyone.
Claude is now controlling TradingView live from my terminal.
Switching symbols. Writing Pine Script. Batch scanning futures. Replay trading. Drawing levels.
All autonomous. Zero clicks.
Still has rough edges but the vision is crystal clear.
I told it:
Find me every BTC futures contract with RSI below 30 and volume spike above 200%.
14 seconds later:
→ 6 contracts identified
→ Charts loaded
→ Support levels drawn
→ Pine Script backtests running
→ Entry zones marked
Didn't touch the mouse once.
Then I said:
Replay last week. Show me where your system would have entered.
It switched to replay mode. Scrolled through price action. Marked every edge. Calculated P&L in real-time.
$4,780 theoretical profit from 9 trades.
83% win rate.
Now it writes custom Pine indicators on command:
Build me a momentum oscillator that tracks whale wallet activity correlated with price.
40 seconds. Script deployed. Indicator live on chart.
Most traders are still clicking through 50 charts manually.
Claude scans 200+ in under a minute.
Finds the setups. Draws the levels. Backtests the edge. All while you watch.
This is not about replacing your strategy.
It's about executing it 100x faster.
You only need Claude + laptop + 1 hour/day.
Giving This Free for 24 hours. To get it:
1. Comment the word CLAUDE
2. Like and Retweet this post
3. Follow me @codewithimanshu (so i can DM you)
Save this post. Deploy this setup this weekend. Start testing. Scale on evidence.
There are 3 types of players in the tokenization industry:
🔶 Tokenization for Retail (No KYC needed)
Price exposure and/or low-yield exposure, not direct ownership of the underlying asset. Synthetic stocks and yield-bearing stablecoins are the main products.
Examples: $AAPLon by @OndoFinance, $TSLAx by @xStocksFi, $deSPXA by @centrifuge, $XAUT by @tether
🔶 Tokenization for Institutional Investors (KYC needed)
Onchain real-world exposure and ownership claims on offchain assets such as funds, money markets, bonds, and stocks.
Examples: $BUIDL by @Securitize, $BENJI by @FTDA_US, Maple Institutional by @maplefinance
🔶 Tokenization for Banks and Institutional Companies
Infrastructure for institutions to bring assets onchain. This includes complex financial instruments like repo markets and home equity lines of credit.
Examples: Broadridge Repo on @CantonNetwork and $FIGR _HELOC on @provenancefdn
--------------
Different characteristics for different use cases. This is how the tokenization industry will eat TradFi.
The world is hitting tank‑bottom oil inventories by September.
Oil inventories work like blood in the human body: you can donate a bit, but below a certain level your blood pressure tanks and organs start failing. You don’t die because blood hits zero, you die because circulation collapses
That’s where we are with oil. We began the year with more than 8 billion barrels in storage, yet only around 10% was actually usable without pushing the system into stress... that safety margin has now been drawn down.
The next stage is dropping to operational floor levels, where pipelines and refineries start failing – that’s the real tank bottom.